
LS 13 320 XR – Pigment Sizing Application Note
Using Laser Diffraction Analysis in Pigment Sizing
INTRODUCTION
Pigments and paints are an important class of industrial materials. They play an important role and can be found in everyone’s lives. From cosmetics to car paint, from household paint to the ink in the humble ballpoint pen or the ubiquitous inkjet printer, nobody today will fail to encounter a wide variety of pigments and paints in their daily routine. The application properties of a given pigment/paint system are determined largely by the particle size distribution of the pigment particles. Particle size determines the tinctorial strength or the depth of colour (neglecting self-scattering of the pigment); additionally, it may also be an important physical parameter of the pigment system itself. For example, in printing inks, it is important that the ink particles are not larger than the nozzle delivery system that dispenses the ink. The ability of a given pigment to absorb light (tinctorial strength) increases with decreasing particle diameter, and accordingly increased surface area, until it reaches a point when the particles become translucent to the incident light. This one factor alone makes the measurement of particle size critical to the performance for many of today’s pigment applications.
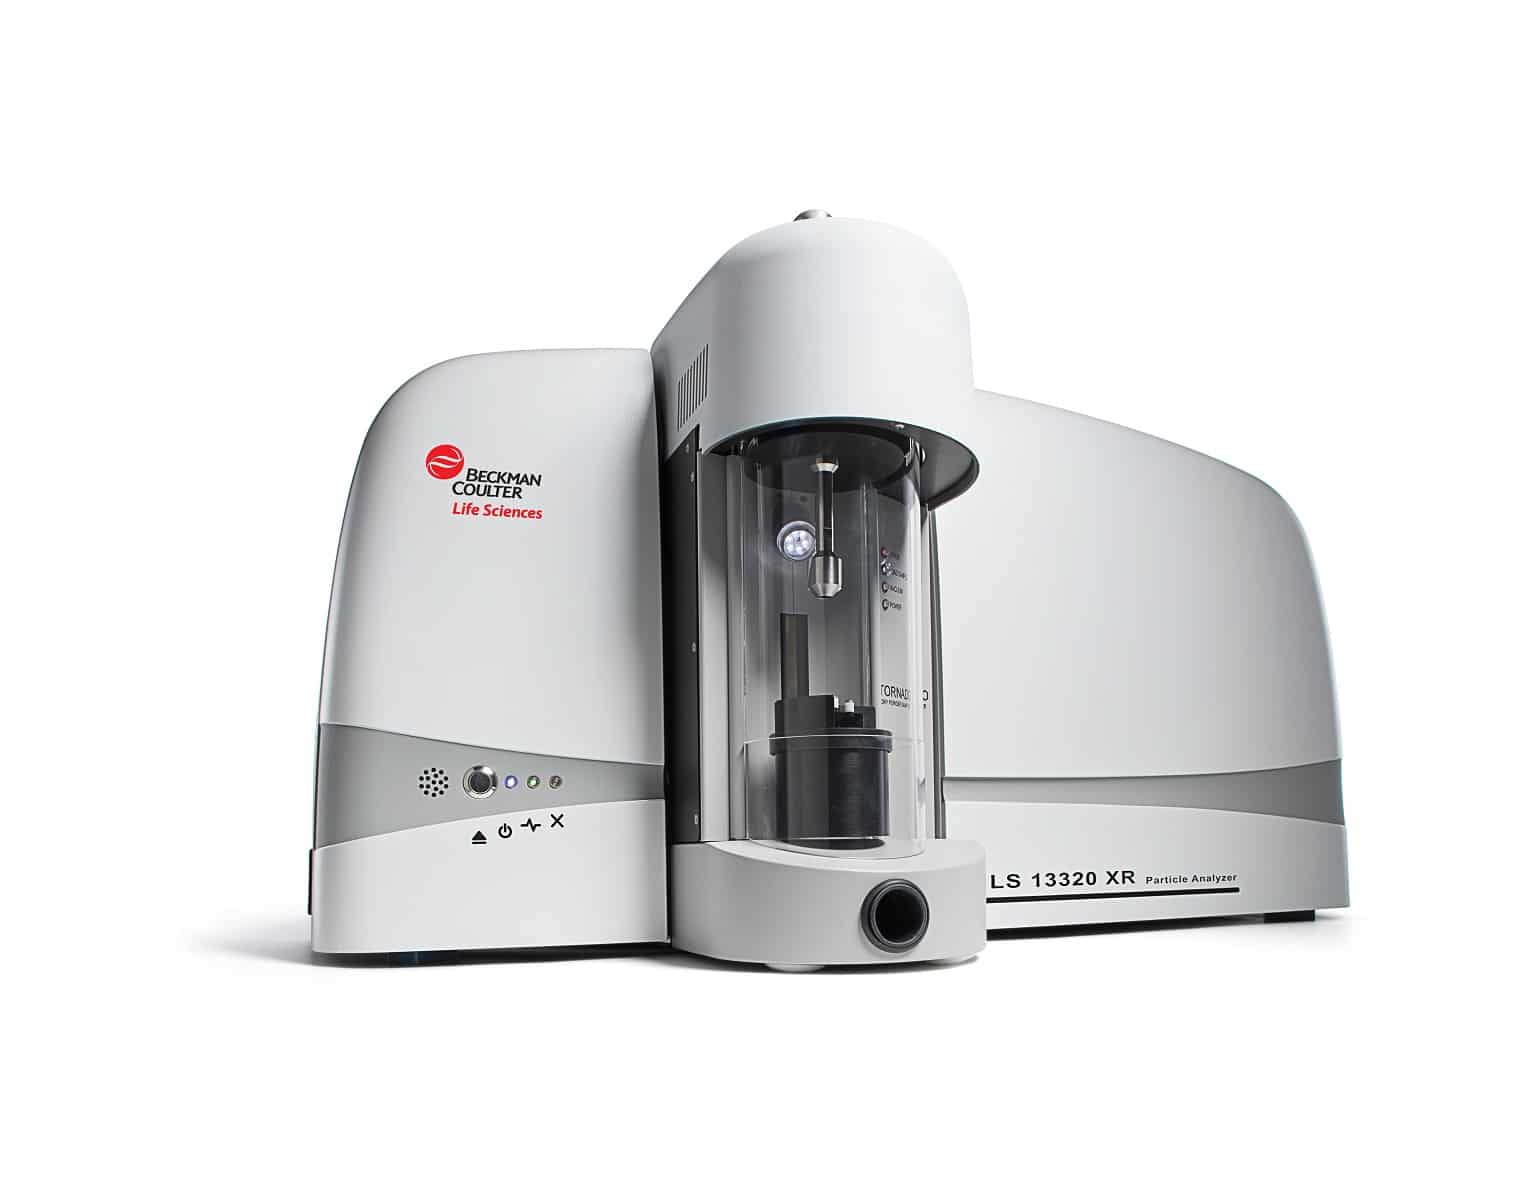
Figure 1. Beckman Coulter LS 13 320 XR Particle Size Analyser with the Tornado Dry Power Module. The LS™ Series multi-wavelength particle size analysers from Beckman Coulter, Inc. utilise a complementary scattering technology for the sizing of sub-micron particles. This technical note describes,by reference to real samples, how pigment particles are sized using the PIDS™ system (Figure 1).
A variety of particle sizing technologies have been employed to measure the particle size distributions of pigment systems. But, laser diffraction has increasingly become the most commonly employed technique in the determination of particle size distributions. The acceptance of the technique stems from its ease of use and the varied ways that samples can be presented to the system for analysis. A sample of interest is illuminated by laser light of a given wavelength. The technique relies upon the fact that the particles will scatter light when exposed to electromagnetic radiation. The resulting scattering pattern can be measured electronically and then deconvulated mathematically to infer a particle size distribution. The ease of use coupled with a short analysis time, typically less than one minute, has made laser diffraction, as stated earlier, the primary method by many companies for process control. However, there is a drawback: a majority of pigment systems are sub-micron in nature and this is the size range where standard laser diffraction instruments have typically struggled to provide accurate information.
It is important to first understand why laser diffraction particle size analysers have difficulties sizing sub-micron materials. When illuminated by a laser beam, large particles scatter light strongly at small angles and with readily detectable maxima and minima in the scattering pattern. This means that detectors placed at small angles, relative to the optical path and with sufficient angular resolution, can detect the fine detail in the scattering pattern. It is the accurate measurement of these maxima and minima that allows the determination of the mean size of the material being analysed and the width and detail of the distribution. Conversely, small particles scatter light weakly and without any discernible maxima and minima until high angles of measurement are reached. As can be seen in Figure 2, once there are particles below 1 µm, many difficulties in the measurement are encountered with weak scattering signals. Different manufacturers have adopted different solutions to overcome these limitations with varying degrees of success. Most early efforts have focused on the measurement of back-scattered light, and indeed some manufacturers continue to pursue this approach. In the early 1990s, Beckman Coulter devised a novel technique for enhancing sub-micron sizing in standard laser diffraction systems. This involved the utilisation of additional wavelengths apart from the main diffraction laser source. The technique is called PIDS™, for Polarisation Intensity Differential Scattering.
PIDS
The technology employed in PIDS™ is simple and takes advantage of the well-established and understood Mie theory of light scattering. PIDS™ (Polarisation Intensity Differential Scattering) relies upon the transverse nature of light, i.e., it consists of a magnetic vector and an electric vector at 90 degrees to it. If, for example, the electric vector is “up and down,” the light is said to be vertically polarised. When we illuminate a sample with light of a given wavelength and polarisation, the electric field establishes a dipole. The oscillations of the electrons in this dipole will be in the same plane of polarisation as the propagated light source. The oscillating dipoles in the particles radiate light in all directions except that of the irradiating light source. PIDS™ takes advantage of this phenomenon. Three wavelengths – 450 nm, 600 nm, and 900 nm – sequentially illuminate the sample, first with vertically and then horizontally polarised light. The scattered or re-radiated light from the sample is then measured over a range of angles. By analysing the differences between the horizontally and the vertically polarised light for each wavelength, we can gain information about the particle size distribution of the sample. It is important to remember that we are measuring the differences between the vertically and the horizontally polarised signals, and not simply the values at a given polarisation. The intensity vs. scattering angle information from the PIDS™ signals is then incorporated into the LS™ algorithm from the intensity vs. scattering angle data from the primary laser, giving a continuous size distribution, 0.04 µm to 2,000 µm (Beckman Coulter LS 230 and LS 13 320).
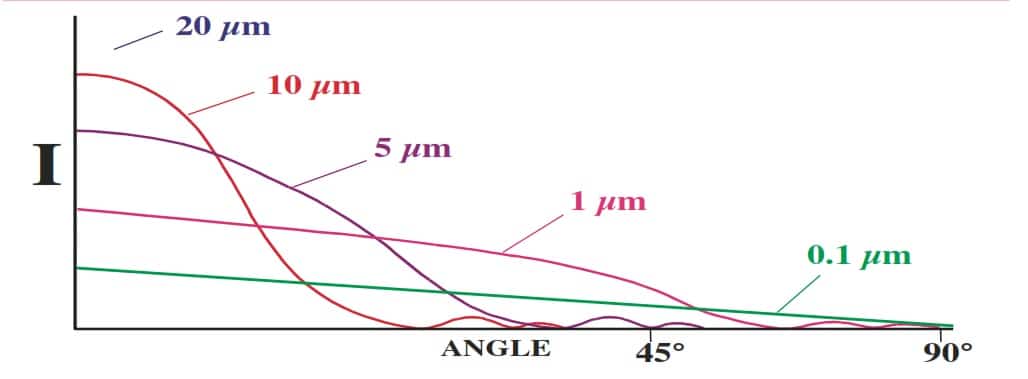
Figure 2. The weak scattering signal from particles below 1 µm in size present difficulties in measuring the maxima or minima at high angles.
The technique has proven to be extremely accurate for the sizing of both spherical and non-spherical sub-micron particles. Other manufacturers have begun to utilise multi-frequency wavelength analysis for sub-micron analysis, typically using just one additional wavelength, though they do not adopt the same approach as is taken for PIDS™. While providing extra data, it does not offer the same amount or level of detailed information that is offered by PIDS™ technology. The extra wavelength is normally provided by a blue light source with a wavelength of approximately 460 nm. By shortening the wavelength, gains are made by primarily ensuring a larger light flux signal is generated compared to the standard laser light source, thereby making its quantification easier. Secondly, by using a shorter wavelength, the difference between the small particles are minimalised, in terms of size and the wavelength of the illuminated light source; this is an important parameter for standard diffraction analysis. Diffraction data, in effect, stops being meaningful as particles get smaller in relation to the wavelength that is irradiating them.
THE PROBLEMS WITH PIGMENTS
Pigments provide a unique problem not encountered with most materials that are measured using laser diffraction instruments. The vast majority of samples measured on commercially available instruments are not coloured and this makes their analysis more straightforward. It is important to consider why this is the case. For an accurate particle size to be calculated, both the real refractive index of the material and its imaginary component must be known. This becomes more important for small particles as the mathematical treatment to successfully size them becomes the more rigorous Mie theory. While the real refractive index is a value that is well understood by the majority of analysts, the imaginary component is less so. It is, in fact, the degree of absorbance that is exhibited by the sample at a given wavelength. Non-coloured materials exhibit a fairly uniform absorbance across the ultra violet/visible (UV/Vis) electromagnetic spectrum. Pigments, however, provide an entirely different challenge. The reason they are coloured lies with the fact that they absorb certain wavelengths preferentially. This must be taken into account when calculating the particle size distribution, particularly if the particles are small. For example, how will a blue pigment with an absorbance maximum at 630 nm interact with a helium neon laser (wavelength 633 nm), which is the choice of a number of manufacturers for their primary laser light source? The material essentially behaves as a black body, which must be taken into account during optical modelling. Failure to do so will lead to significant errors that will increase with a decrease in particle size. The real refractive index remains an important function and can be either calculated or estimated from known constants, and any error associated with this can be minimised. Thus, it is easy to see that the quantification of the imaginary component of the complex refractive index is extremely important for the accurate determination of pigment particulate systems.
DETERMINING THE IMAGINARY COMPONENT
The determination of the imaginary component of a pigment is a relatively straightforward measurement. It is achieved using a UV/Vis spectrophotometer, which measures the relative absorbency of a material per given wavelength. It is this preferential absorption that dictates the colour of a material. Two things must be taken into account: first, one must ensure that no large particles are present in the spectrophotometer sample cell, as they will give rise to forward scatter and will “blind” the detector, compromising the absorbance measurement. It may be necessary to filter a sample to remove large particles; particles should be no bigger than a few microns. Second, the relative amount of absorption must be taken into account in the calculation of the optical model. This will not be a constant and will need to be determined for each type of instrument. Once this has been done, these values can then be used when calculating optical models for a given pigment. In terms of the allowance used for the imaginary component, the approach taken for each complementary wavelength needs to be fully evaluated. A novel approach related to the obscuration value, which is associated directly with the amount of sample in the analyser, can be employed. A more sophisticated method would be to use Beer’s Law. However, one would need to know the exact concentration of the solution. But, absorbencies taken at a specific concentration could then be directly related to one another. The more quantitative approach would be to determine the exact concentration of the solution. Each manufacturer takes a different approach to the calculation of optical models. Beckman Coulter allows users to calculate a complete Mie theory optical model for a given sample. The optical model can be generated with the latest version of software in as little as three seconds.
USING COMPLEMENTARY INFORMATION
When analysing pigments, it is also beneficial to utilise other sources of information to initially verify or confirm the results obtained. Once correlating information has proven the suitability of a given model for a particular sample it can then be used with confidence for that material. The best sources of correlating information are photomicrographs. These can be images from simple microscopes to electron microscopes. This approach is particularly important for the detection of small amounts of oversized materials. This can be a common problem with many pigment systems due to the type of size reduction or milling techniques utilised. Ball mills can give rise to small amounts of oversized materials that may remain undetected by laser diffraction, particularly if the imaginary component of the refractive index is not taken into account. Beckman Coulter, working in conjunction with a selected number of pigment manufacturers, has now gained valuable experience in the particle size analysis of many different pigment systems. The applicability of an optical model for a given pigment is best determined if one tracks a milling process over time. If the correct refractive index values have been used to create the optical model, one should obtain a constant reduction of the mean size.
THE QUESTION OF SHAPE
A criticism levelled at all laser-based particle sizing devices is that they make no allowance for the shape of the materials under test, regardless of the size of the particles. The reasons for this lie with the underlying assumptions, used in calculating size distributions from the raw data generated during the analysis. The mathematical models used to calculate distributions are based on scattering of light by a sphere. So any reported distribution is, in effect, an equivalent spherical distribution of the material being analysed. In most instances this is quite adequate since most particles approximate to a spherical system adequately enough. Particles in milled pigments will not be perfect spheres, so how does this affect their recovered sizes using the technique described above? The ideal way to evaluate this is with reference to known standards. Until recently, sourcing suitable sub-micron, non-spherical particles for studies of this type has been difficult because of the lack of independently produced and assayed materials. However, the colloid chemistry department at the University of Utrecht now produces a variety of mono-dispersed, non-spherical materials. Figure 6 shows the results obtained for the analysis of sub-micron hematite spindles (spheroids). The size of the particles (determined by SEM, or scanning electron microscopy) is 46.9 nm in width and 130.8 nm in length, giving them an approximate aspect ratio of 3:1. The particles are mono-sized and are readily dispersed.
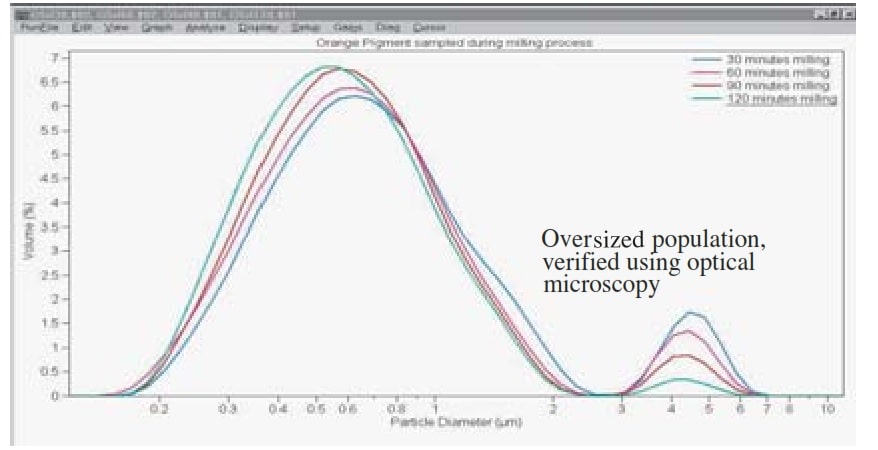
Figure 3. Size distributions of an orange pigment progressively milled over a two-hour period. Maximum UV/Vis absorbance shown at approximately 450 nm.
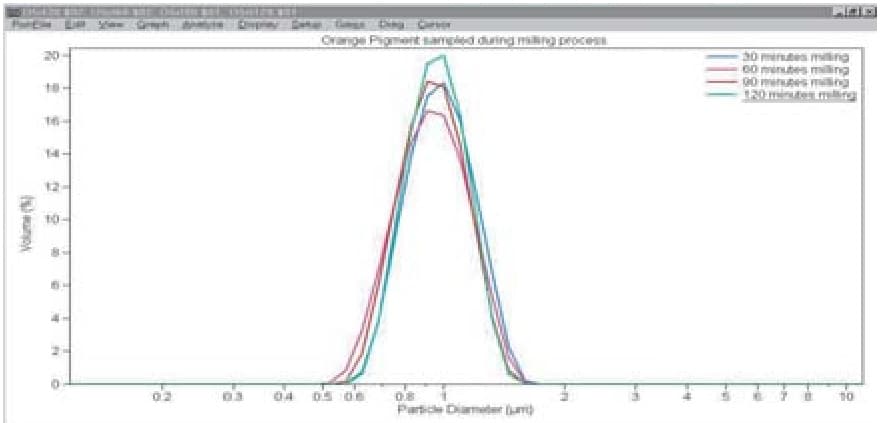
Figure 4. An illustration of the problems that can be encountered if the wrong imaginary values are used. The distributions are of the same samples analysed in Figure 3 but have been calculated using the imaginary values for a blue pigment. Note the narrow distribution and the lack of the population of oversized particles.
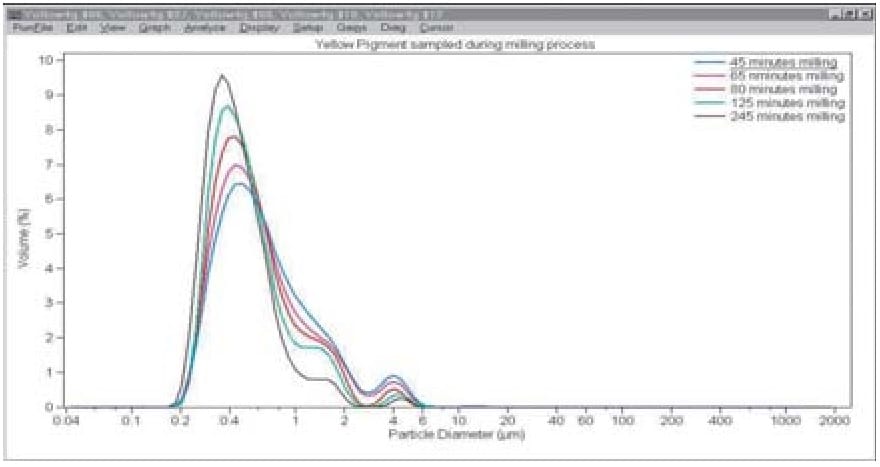
Figure 5. Yellow pigment, milled during a four-hour period, yields a meaningful distribution by using imaginary values of the refractive index that were determined by UV/Vis spectroscopy. The distribution may also be corroborated by using other methods.
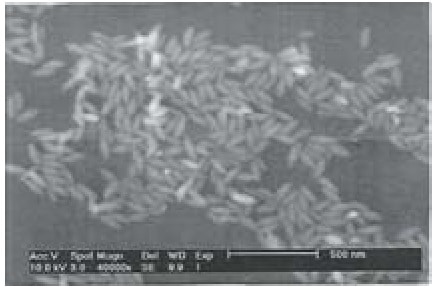
Figure 6. The photomicrograph SEM shown is a representative sample of hematite spindles analysed.
LS™ SERIES PARTICLE SIZE DISTRIBUTION FOR HEMATITE SPINDLES
The optical properties of the hematite spindles have been determined from UV/Vis spectroscopy for the imaginary component of the refractive index and from UV/Vis spectroscopic ellipsometry data for the real component. Using hematite has an added benefit, in that being a coloured material it mimics a pigmented material well. The reported value for the mean size from the LS Series Analyser is 78 nm (Figure 7), which is well with in the range of what one would expect given the random motion of the particles in the sample cell. Statistically, one would expect the reported mean size to be a function of all the possible orientations of the particles as they traverse through the illuminated beam. Indeed, instruments are designed to ensure that particles in the sample cell are orientated in a random manner with regard to their morphology or shape.
SUMMARY
If the right approach is taken, enhanced multi-frequency laser diffraction can be employed successfully to size particulate pigment systems. For pigments, steps can be taken to determine the imaginary component of the optical model for laser diffraction particle size analyser. It is also worthwhile considering using other techniques to initially corroborate the results obtained.
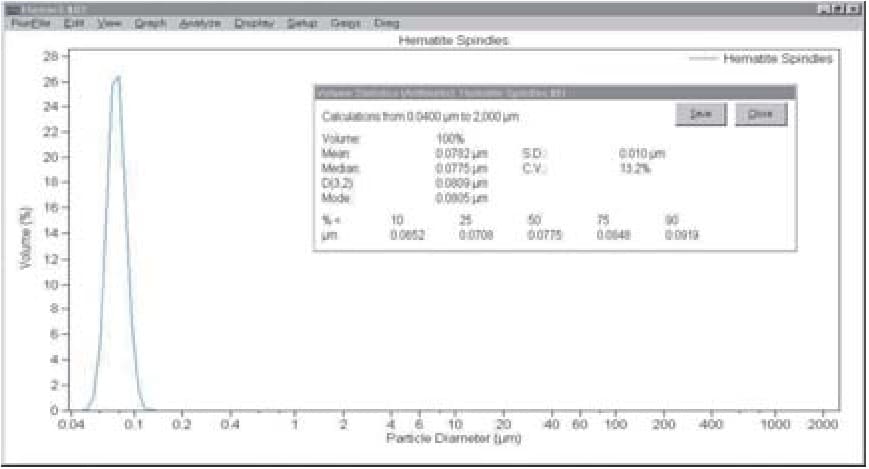
Figure 7. The reported mean value of 78 nm using an LS Series Analyzer is expected, assuming random motion of particles in sample cell.