
SA-9600 – Applications Data Sheet
A Comparison of Single Point Surface Area Meeasurement to Multi Point Determination
Summary
The Flowing Gas Technique for determining BET Surface Area has been in use for over 60 years. Many facets of the technology make it a very attractive alternative to the Static-Volumetric approach. First and foremost is the fact that the detection is done by measuring a gas concentration difference instead of an absolute pressure. Difference measurements are typically more accurate than one absolute measurement. The speed of analysis and the resulting high sample throughput is also quite attractive. As a result, for routine QA/QC analysis, there has been a renewal of interest in this technique.
The analytical technique is very easy to understand to its great similarity to chromatographic determinations. The change in the nitrogen to helium ratio of the gas after going over the sample is measured by a thermal conductivity detector. The trace of the output from the detector is shown below in Figure 1 for the measurement of a silica sample.
Analytical Test Method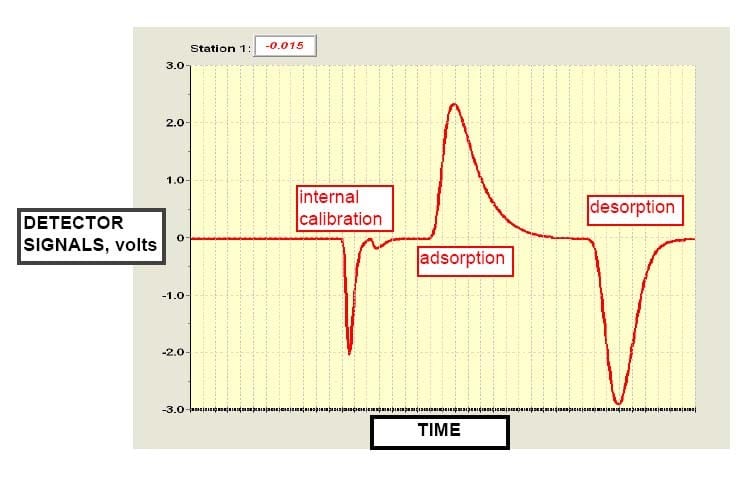
The measurement typically involves the integration of the area under the desorption peak. The simple hardware, plus the lack of any waiting time following dosing as happens in the Static-Volumetric case, makes this a very popular tool in a product production environment.
One of the key questions is how to implement this technology. For speed, a single point measurement is typically completed in less than five minutes. For greater accuracy, a multi point determination can be completed in less than 15 minutes. The chart below (Figure 2) compares these two types of analyses for a number of real world samples.
Summary of Data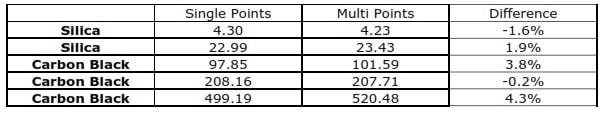
As can be seen, the single point value is very close to the multi point value, but typically a bit lower in value. This derives directly from the assumptions that were used to derive the single point equation. In a production environment that difference proves to be completely negligible. The point is to always measure the samples in a similar fashion, set an acceptable tolerance on the average value and check each batch to be certain that it is within these tolerances. The decision between using a higher or lower number becomes a mute point as the change between batches becomes the more critical issue. As a result, most customers produce their final result in less than 5 minutes.