LS 13 320 XR Capabilities
The LS 13 320 XR particle size analyser uses advanced laser diffraction and PIDS technology for the sizing of non-spherical, sub-micron particles. Initially, particle sizing by laser diffraction was limited to the use of the Fraunhofer diffraction theory. Laser diffraction offers a number of advantages – laser diffraction analysers go beyond simple diffraction effects. General approaches are now based on the Mie theory and the measurement of scattering intensity over a wide scattering angular range is employed.
Using PIDS Technology
Initially, particle sizing by laser diffraction was limited to the use of the Fraunhofer diffraction theory. Laser diffraction offers a number of advantages – laser diffraction analysers go beyond simple diffraction effects. General approaches are now based on the Mie theory and the measurement of scattering intensity over a wide scattering angular range is employed.
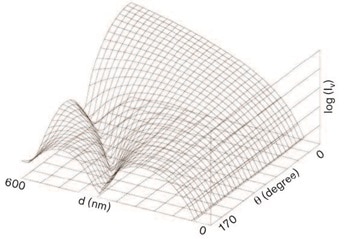
Figure 1: 3D display of Mie scattering intensity
Then, two different routes were developed among instrument manufacturers. One is to extrapolate from the measured lower limit to an even lower limit, sometimes even beyond the theoretical lower sizing limit, e.g., 10 nm. Certainly this brings uncertainty or even completely wrong information in the extrapolated region. The other approach is to use the polarization effects of the scattered light.
Vertically polarized scattered light has different scattering patterns and fine structures from that of horizontally polarized light for small particles. The main characteristic of the horizontal scattering intensity (Ih) for small particles is that there is a minimum around 90 degrees. This minimum shifts to larger angles for larger particles. Thus, although both vertical scattering intensity (Iv) and (Ih) have only small contrast in the case of small particles, the difference between them can reveal a more distinguished fine structure, thereby making the sizing of small particles possible. Combining polarization effects with wavelength dependence at large angles, we can extend the lower sizing limit to as low as 10 nm, almost reaching the theoretical limit. This combined approach is known as the Polarization Intensity Differential Scattering (PIDS) technique patented by Beckman Coulter.
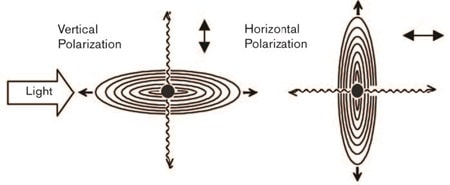
Figure 2: Scattering from different polarizations
The origin of polarization effects can be understood in the following way. When a very tiny particle, much smaller than the light wavelength, is located in a light beam, the oscillating electric field of the light induces an oscillating dipole moment in the particle; i.e., the electrons in the atoms comprising the particle move back and forth relative to the stationary particle. The induced motion of the electrons will be in the direction of oscillation of the electric field, and therefore perpendicular to the direction of propagation of the light beam. As a result of the transverse nature of light, the oscillating dipole radiates light in all directions except in the direction of oscillation; if the detector is facing the direction of oscillation it will receive no scattering from single dipoles. When the light beam is polarized in either the v direction or the h direction, the scattering intensity Iv and Ih for a given angle will be different. The difference between Iv and Ih (Iv – Ih) is termed the PIDS signal. As particle size increases the intra-particle interference makes the particle’s behaviour deviate from that of a simple dipole and the scattering pattern will become more complex. For small particles the PIDS signal is roughly a quadratic curve centred at 90 degrees. For larger particles the pattern shifts to smaller angles and secondary peaks appear due to the scattering factor. Since the PIDS signal is dependent on particle size relative to light wavelength, valuable information about a particle size distribution can be obtained by measuring the PIDS signal at several wavelengths.
Figure 4 displays the shift in the peak value and the change in contrast for particles of various diameters are clearly shown. In addition, because the PIDS signal varies at different wavelengths (it becomes flatter at longer light wavelengths), measurement of the PIDS signals at several wavelengths will provide additional scattering information that can be used to further refine the size retrieval process.
From Figure 4, the angular patterns for 100 nm and even for 50 nm particles are recognizable, in addition to the shift in the axis of symmetry. It has been verified through both theoretical simulation and real experimentation that accurate sizing of particles smaller than approximately 200 nm by scattering intensity without the use of the PIDS technique is practically difficult and probably unrealistic. The combination of the three approaches (wider angular range, wavelength variation, and polarization effects) improves the accurate characterization of submicron particles using light scattering.
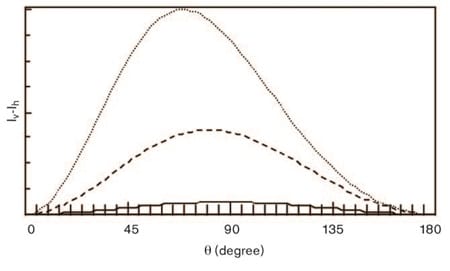
Figure 3: Shift in peak value
Figure 5 is a typical trimodal distribution retrieved in a laser diffraction experiment using the PIDS technique at multiple wavelengths (λo = 475, 613, 750 and 900 nm) and over a scattering angular range with angles up to 144 degrees, with (solid line) and without (dashed line) using the polarization effect. The dotted lines represent the nominal diameter values of the latexes in the mixture as reported by the PSL vendor. Without the PIDS technique the smallest component is missed, even when using the information gathered at large scattering angles and short wavelengths. Figure 6 is an SEM image of the sample in Figure 5 in which three different sizes of particles can be seen.
In summary, only using all three approaches, i.e., wide angular range, short wavelength and polarization effect, can particle size as small as 10 nm can be correctly measured, not extrapolated. There is no mixing of technologies. All signals are from the same scattering phenomenon and treated integrally in a single data retrieval process just like in an ordinary laser diffraction measurement.
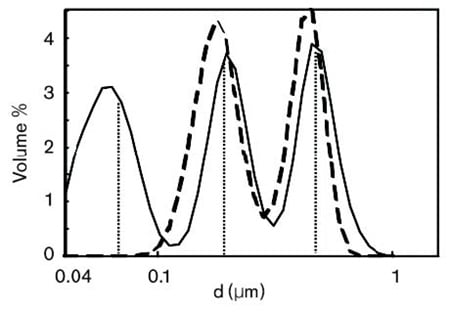
Figure 4: Trimodal mixture of PSL
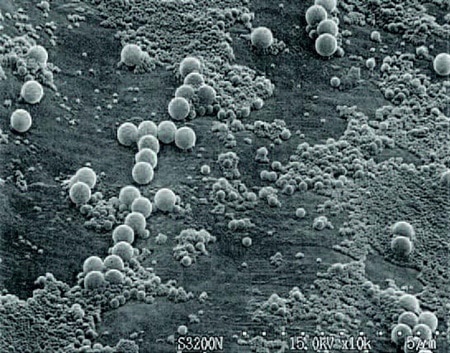
Figure 5: Electron microscopic image