
Mercury Scientific Revolution ASTM Paper
ASTM COMMITTEE B09 WORKSHOP ON POWDER CHARACTERISATION
W. Brian James
IntroductionNew powder characterization tests such as the rotating drum and the Freeman FT4 rheometer have been introduced in recent years. These instruments have yet to be standardized for use with metal powders. Greg Martiska, Mercury Scientific Inc., presented the results of testing with the Revolution Powder Analyzer and Joe Tauber, Kennametal Inc., presented data from testing with a Granudrum. The third workshop participant was Tim Freeman, Freeman Technology, a Micromeritics company. He presented the test results obtained using the FT4 rheometer.
Louis-Philippe Lefebvre from National Research Council Canada also gave a presentation of work he had performed with an FT4 rheometer, but what he presented is not summarized here. Some of what he presented may be found in the proceedings of the AMPM2019 conference.
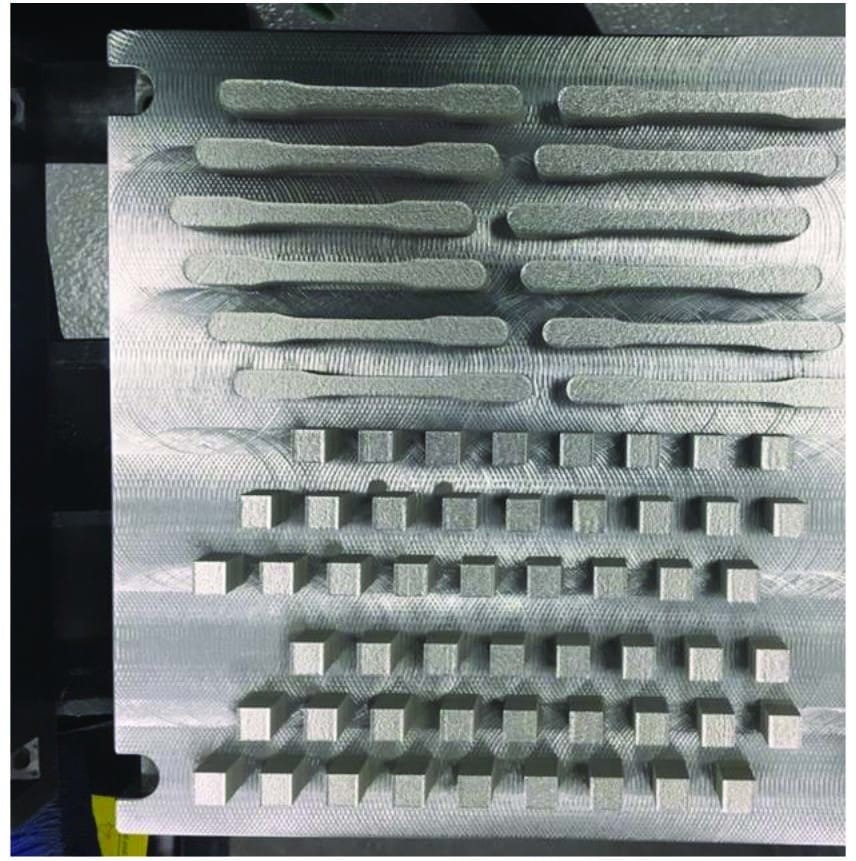
Two sets of metal powders were provided to each of the three participants. Samples A, B, and C were Ti-6Al-4V powder and samples X, Y, and Z were SS-316L powder. Both sets of powder had a particle-size-distribution suitable for laser-beam powder-bed-fusion processing. Each set of powders contained virgin powder plus powder that had been cycled through an EOS M290 unit multiple times (with no replenishment with virgin powder)—see Figure 1. At the time of testing, the participants only knew which alloy system the samples were from. They did not know the nature of the other samples in each set.
The objective of the workshop was to see whether the instruments were able to detect quantitative differences between the virgin and recycled powders, and to see how repeatable the test results were. Each participant was requested to run three test repetitions on fresh test portions of powder from each process condition.
It was not the objective of the exercise to comment directly on which powder characteristics are associated with successful performance in any given application. Depending on the outcome of this initial phase of testing, the B09 Standards Committee will decide whether developing a standardized test protocol and proceeding to conduct an inter-laboratory testing program to determine the repeatability and reproducibility of the tests performed using the instruments is worthwhile.
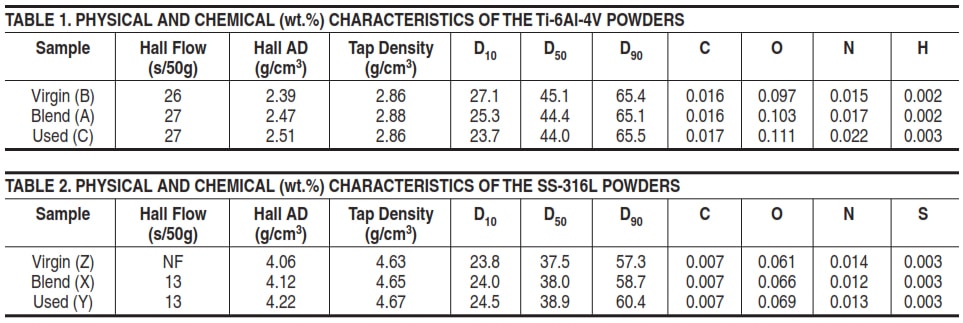
Some characteristics of the powders that were tested are summarized in Tables 1 and 2. The participants did not know these until after they completed their testing—the information was provided after they had presented their findings at the workshop. The “used” powder had been through seven machine cycles while the remaining sample was a 50:50 blend of the virgin and used materials.
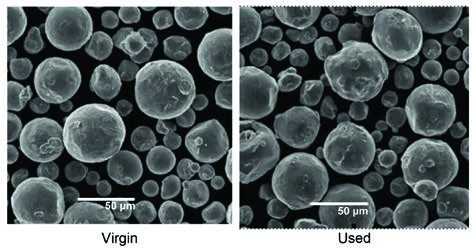
Figure 2. SEM photomicrographs (secondary electron images) of the Ti-6Al-4V powder
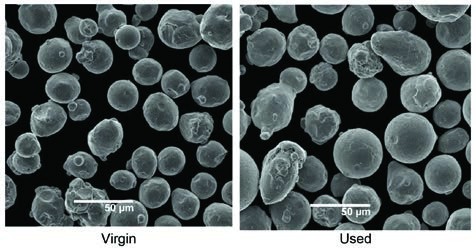
Figure 3. SEM photomicrographs (secondary electron images) of the SS-316L powder
Secondary electron images of the virgin and used powders are shown in Figures 2 and 3.
A more detailed characterization of the powders was subsequently presented by Tony Thornton, Micromeritics, at POWDERMET2019 and is published in the conference proceedings, Advances in Powder Metallurgy & Particulate Materials 2019.1
This summary will be divided into two parts. The first covers the testing conducted using rotating drums and the second the testing conducted using the FT4 rheometer.
ROTATING DRUM TESTS
Revolution Powder Analyzer
The Revolution Powder Analyzer (Figure 4) uses a rotating drum with borosilicate glass sides to measure the flowability potential of powders. The operator starts the flowability test by placing a 100 cm3 test portion of the powder into the drum (other drum sizes are available). A motor rotates two high-precision rollers that in turn rotate the drum. A digital camera, with the assistance of cold-cathode back-light illumination takes digital images of the powder during the rotation process. From the images collected, the software measures the behaviour of the powder due to the drum rotation and how this behaviour changes over time.
The digital camera captures images of the powder in the rotating drum at the specified rotation speed. The three images displayed in Figure 5 represent an avalanche cycle from initial image, peak, and the completed avalanche. Images are collected and processed at a high frame rate to capture the exact motion of the powder sample.
Samples were tested on the Revolution Powder Analyser using the flow test to study low-speed flowability (how powders flow in the avalanching or slip-stick regime), the packing test to study vibrational packing and consolidated flow (how powders respond to vibration and how they flow after consolidation), and the multi-flow test for high speed flow (how powders transition from avalanching to continuous flow as their flow speed increases). The complete sequence of testing for each test portion took approximately 15 minutes.
DYNAMIC FLOW TESTING
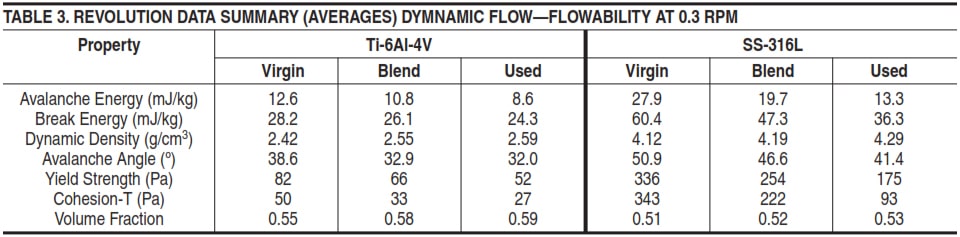
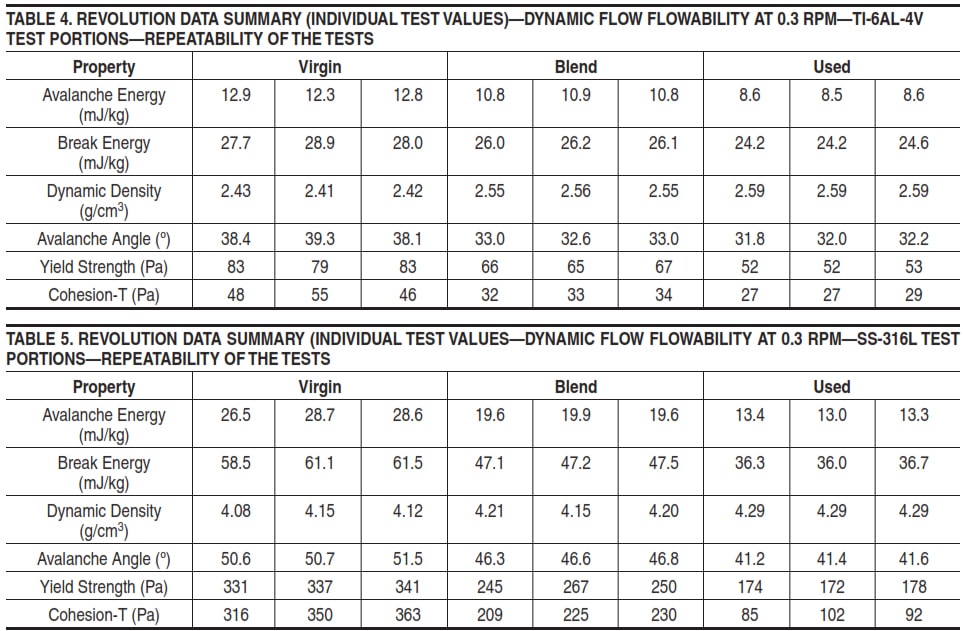
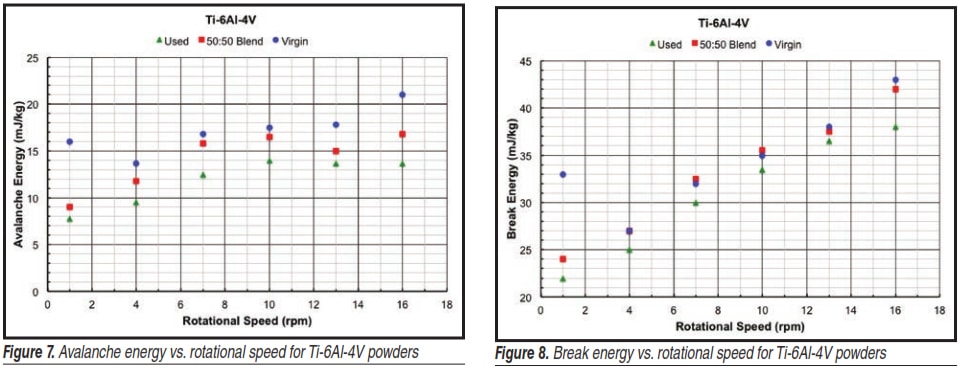
For the dynamic flow test, 100 cm3 test portions were placed in the test drum and the drum was loaded into the Revolution Powder Analyzer. The flowability test was conducted at a rotation rate of 0.3 rpm and the frame rate for the test was 20 frames per second. The results for the Ti-6Al-4V and SS-316L powders are summarized in Table 3, and the repeatability of the tests is reported in Tables 4 and 5 for the Ti-6Al-4V and the SS-316L powders respectively.The avalanche energy is the amount of energy released by an avalanche in the powder test portion. It is calculated by subtracting the energy level of the powder after an avalanche from the energy level before the avalanche. The reported avalanche energy is the average avalanche energy for all of the powder avalanches.
The break energy is the maximum energy level of the powder test portion before an avalanche begins. This energy level or force represents the amount of energy/force required to start each avalanche. The reported break energy is the average break energy for all of the powder avalanches.
For every digital image taken, the software measures the density of the sample. The software then calculates the average density (dynamic density) of the powder during the test.

Figure 4. The Revolution Powder Analyzer
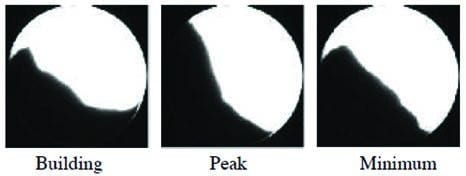
Figure 5. Example images of powder in the rotating drum
The software collects the angle of the powder at the position of maximum energy prior to the start of the powder avalanche occurrence. The reported value for the avalanche angle is the average value for all the avalanche angles. For the avalanche cycle depicted in Figure 4, the avalanche angle would be calculated at the peak cycle. The software calculates the flowability angle from the centre point on the powder edge to the top of the powder edge.
The yield strength is the average of the shear stresses created when the test portion starts to flow.
The cohesion-T or thickness cohesion is the average of the shear stress created by the thickness of the flowing layer in the test portion as the powder moves between the point where it starts to flow and when it stops flowing. The shear stress is calculated using the thickness of the flowing layer, the density of the powder bed, the volume fraction of the powder bed, and the angle of the powder bed.
For both the Ti-6Al-4V and the SS-316L powders, the used powders had the best low-pressure flow properties with the lowest avalanche energy, break energy, avalanche angle, yield strength, cohesion-T, and surface fractal. The used powders also had the highest dynamic density. This is typical, as samples that flow better usually allow particles to flow around each other better and fill the air spaces between the particles more efficiently. The excellent repeatability of the tests is apparent from the data summarised in Tables 4 and 5.
PACKING ANALYSIS
With the same test portion in the drum that was used for the dynamic flow test, the drum was rotated at 20 rpm for 10 seconds to condition the test portion for the packing analysis test. Images were then taken to calculate the volume of the test portion after conditioning. The powder was then vibrated at 100 Hz at a vibration amplitude of 6.4 mm for 15 seconds and after vibration an image was taken to calculate the new volume of the test portion. The powder was then rotated at 2 rpm until the compacted powder broke (or avalanched). The software captured the angle when the powder broke and the amount of drum rotation required to break the powder, and then calculated the energy needed to initiate flow in the test portion. The digital camera recorded images of the powder after preparation (conditioning), after vibration, and prior to the powder break as seen in Figure 6.
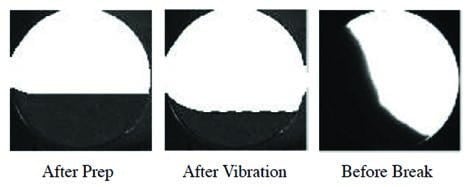
Figure 6. Images taken at various stages of the packing test
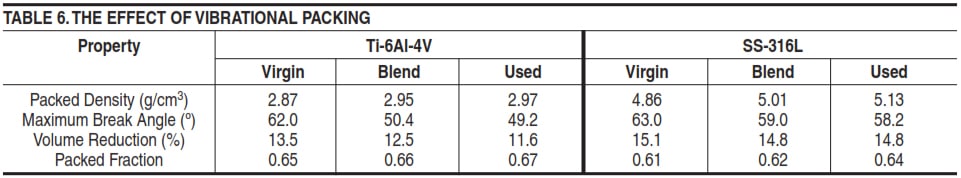
The results of the packing tests are summarized in Table 6.
For both the Ti-6Al-4V and SS-316L powders, the used test portions had the lowest volume change and break angle. All test portions showed a significant increase in density due to vibration but all had little memory of the compression once they flowed again. All test portions had an increase in the strength required to initiate flow compared with samples already flowing. This is indicated by the increase in the maximum break angle compared with the avalanche angle from the dynamic flow test.
MULTI-FLOW TESTING
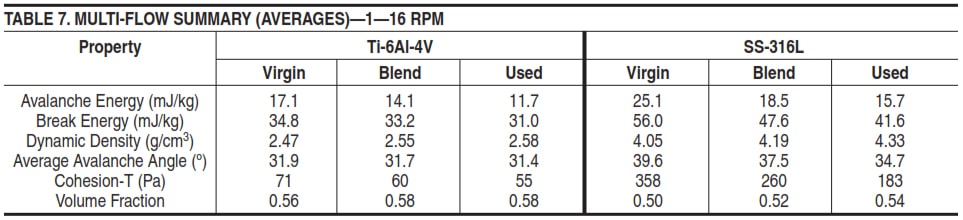
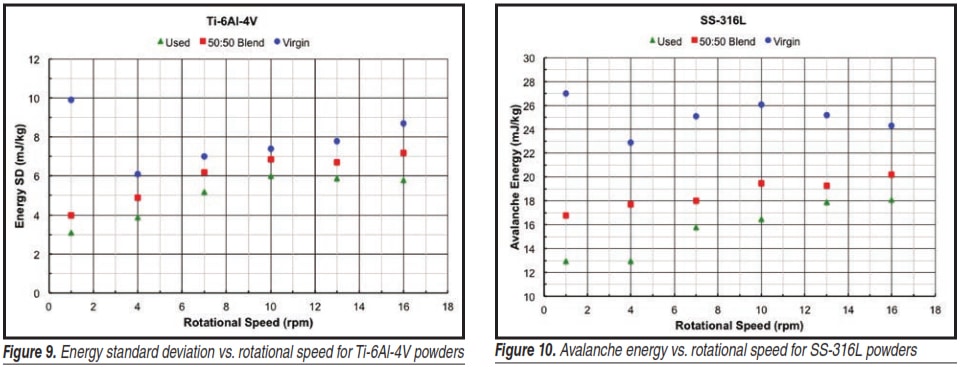
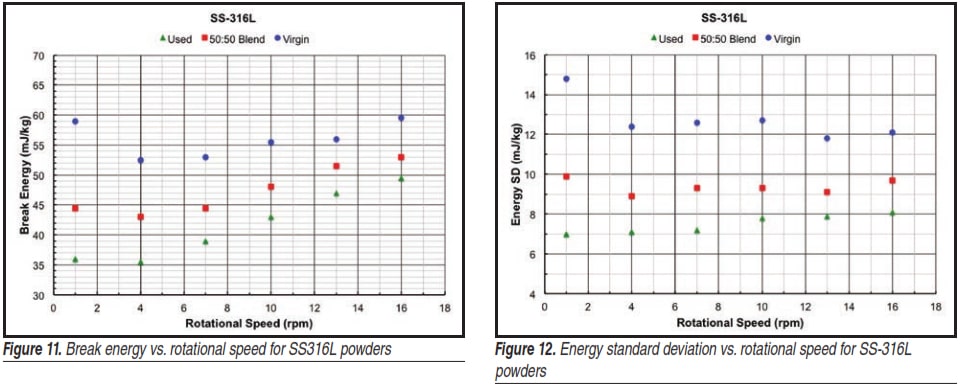
For the multi-flow test the test portions were rotated at speeds from 1 rpm to 16 rpm (1 rpm, 4 rpm, 7 rpm, 10 rpm, 13 rpm, and 16 rpm). The frame rate for these tests was 40 frames per second. The results are summarized in Table 7 for both the Ti-6Al-4V and SS-316L powders.
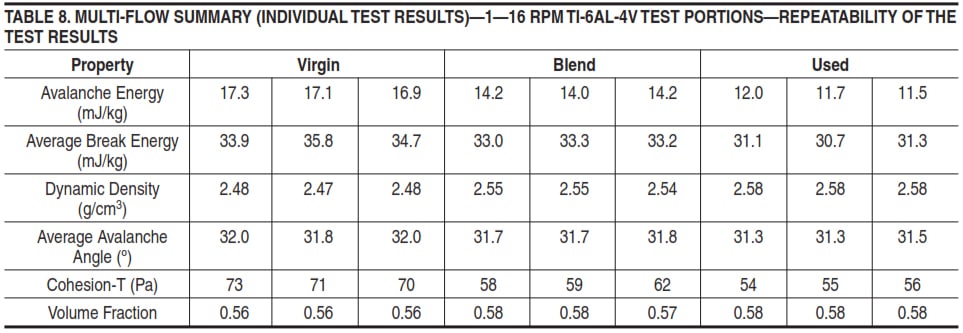
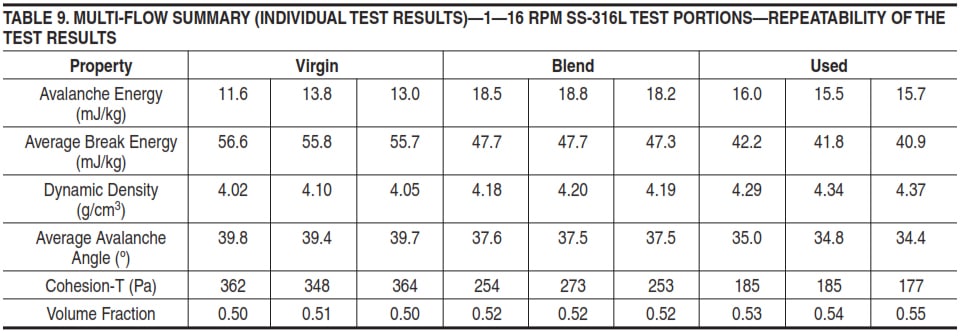
The used test portions had the best flow properties across different flow speeds. They also had the highest volume fraction. The effect of rotational speed on selected properties is illustrated in Figures 7–12. The repeatability of the multi-flow test results can be seen from Tables 8 and 9.
Granudrum
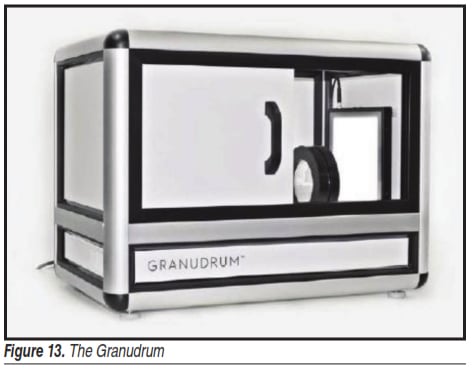
The Granudrum (Figure 13 ) is similar in principle to the Revolution Powder Analyser. The specific equipment used is, however, slightly different and the algorithms used to analyse the data are also different.
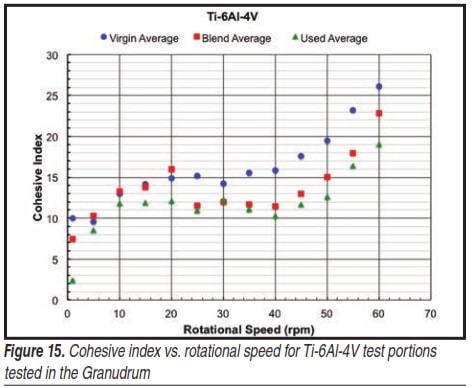
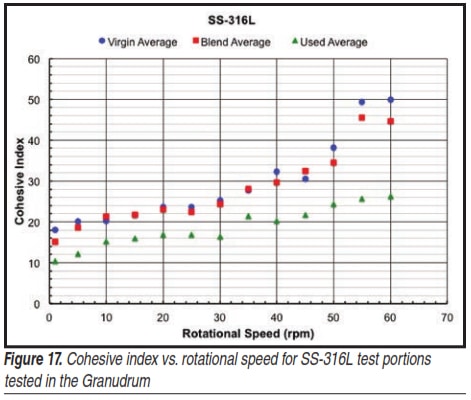
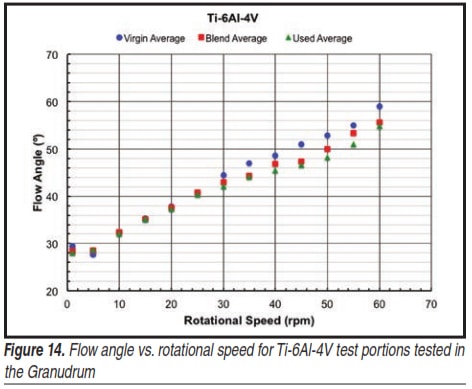
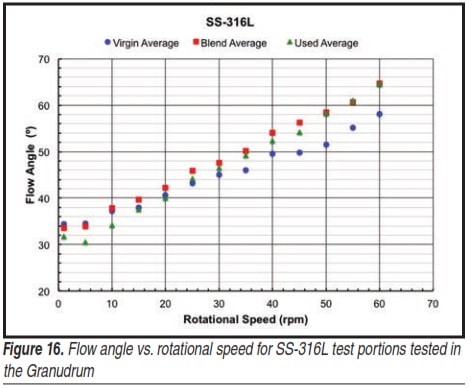
For the tests conducted using the Granudrum, 50 cm3 test portions were used. Tests were conducted at 1 rpm and the rotational speed was then increased to 5 rpm and then in increments of 5 rpm up to a rotational speed of 60 rpm. Measurements were made at each rotational speed as the speed of rotation was increased and also when the speed was decreased. Fifty digital images were taken for each increasing and decreasing rotational speed. The results obtained are summarised in Figures 14–17.
At low rotational speeds (<30 rpm) the Granudrum shows no difference in the flow angle for the Ti-6Al-4V powders. At higher rotational speeds there appears to be some differentiation. However, when the repeatability of the test is considered the data overlap even at the higher rotational speeds.
For the SS-316L powders, the Granudrum appears to show a difference at low speeds (up to 10 rpm) and at rotational speeds above 30 rpm. Again, however, when the repeatability of the test is considered (the results from the three repetitions on fresh test portions), the values overlap and no discrimination is possible.
For the Ti-6Al-4V powders, the “cohesive index” is different at a rotational speed of 1 rpm (the used powder has a lower cohesive index), shows no difference between 5 rpm to 15 rpm, and then discriminates between the virgin and used powders at higher rotational speeds where the used powder has a lower cohesive index.
The cohesive index is lowest for the used SS-316L powder at all rotational speeds. It is, however, not possible to distinguish the virgin powder from the 50:50 blend.
No units are listed for the cohesive index, and the cohesive index calculation is not described in the literature so it is not clear how or why the calculation relates specifically to cohesion in the samples.
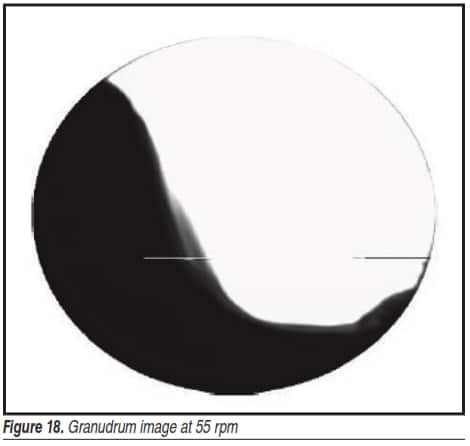
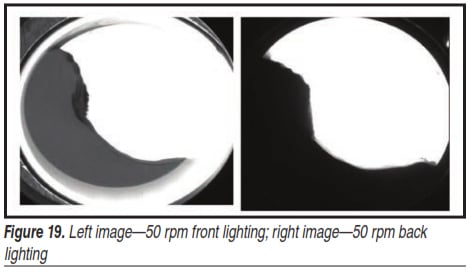
While the tests on the Revolution Powder Analyzer were restricted to rotational speeds up to 16 rpm, those on the Granudrum covered speeds up to 60 rpm. At rotational speeds >40 rpm it appears that the powders start to cataract at the top of the drum making measurements questionable. Under these conditions, a portion of the powder is free falling and not in contact with the powder bed, and at this point, the powders do not have a flow angle nor do they have a flowing layer. It is hard to see the cataract in the powder bed when looking at a back-lit grey scale image (Figure 18). However, when both front and back lighting are compared, the cataract is clearly visible when the drum is lit from the front (Figure 19).
COMMENTS ON ROTATING DRUM TESTING
The Revolution Powder Analyzer was able to discriminate between the various test portions and had very repeatable data. It therefore appears worthwhile to continue testing with this equipment to determine how reproducible (testing at various laboratories) the results are. The Granudrum, however, was unable to discriminate on the basis of flow angle and the cohesive index data for the virgin and used powders only differed at rotational speeds where the powder was cataracting and where measurements are questionable. For the Ti-6Al-4V powder the 50:50 blend could not be distinguished from the used powder, and for the SS-316L powder the blend could not be distinguished from the virgin powder. It is clear that there are differences between the two rotating drum units and this will need to be addressed if and when a standardized test method is written—ensuring that the conditions required to achieve good data are satisfied.
FREEMAN FT4 RHEOMETER TESTS
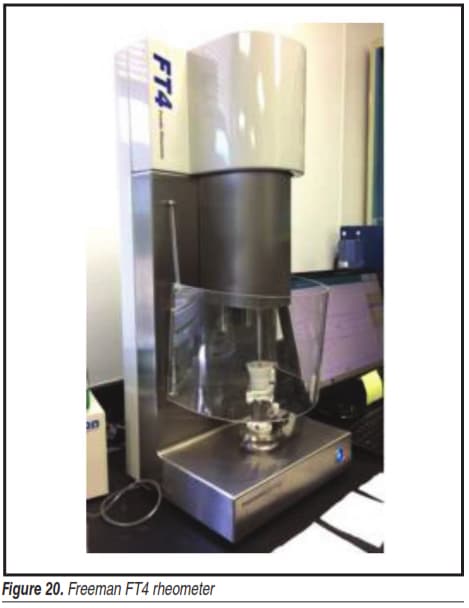
The Freeman FT4 rheometer is described as a universal powder tester. It was developed originally to characterize the flow properties of powders and this is still a primary function of the instrument. Accessories and methodologies have been added, however, such as a shear cell to measure a powder’s shear strength, a wall friction kit to quantify how the powder shears against the wall of the process equipment, plus means to measure bulk properties such as density, compressibility and permeability. In this article, emphasis will be placed on the dynamic measurements.
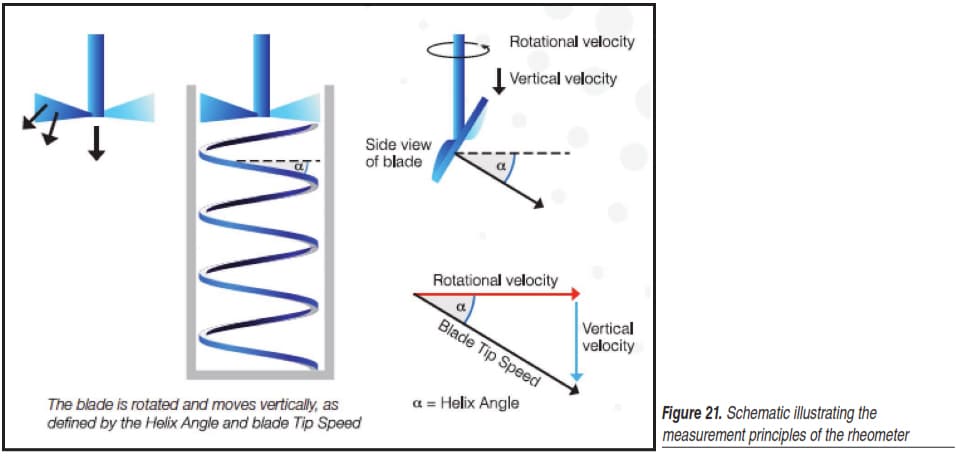
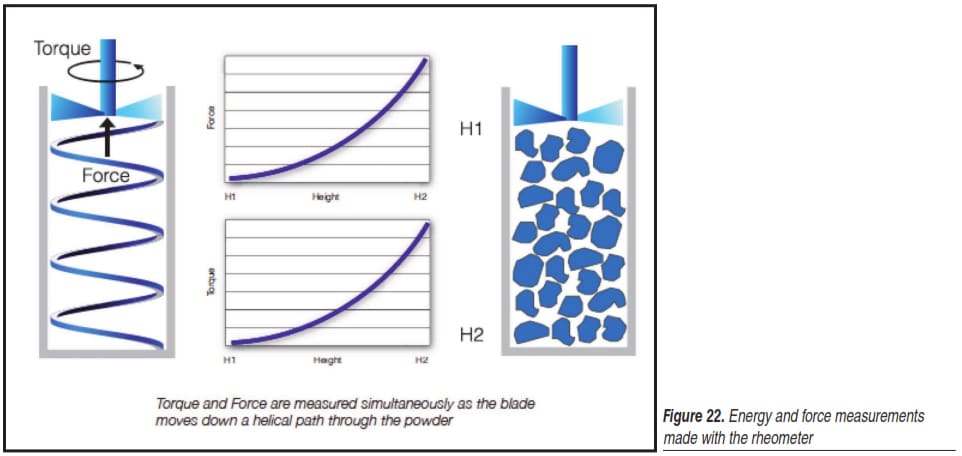
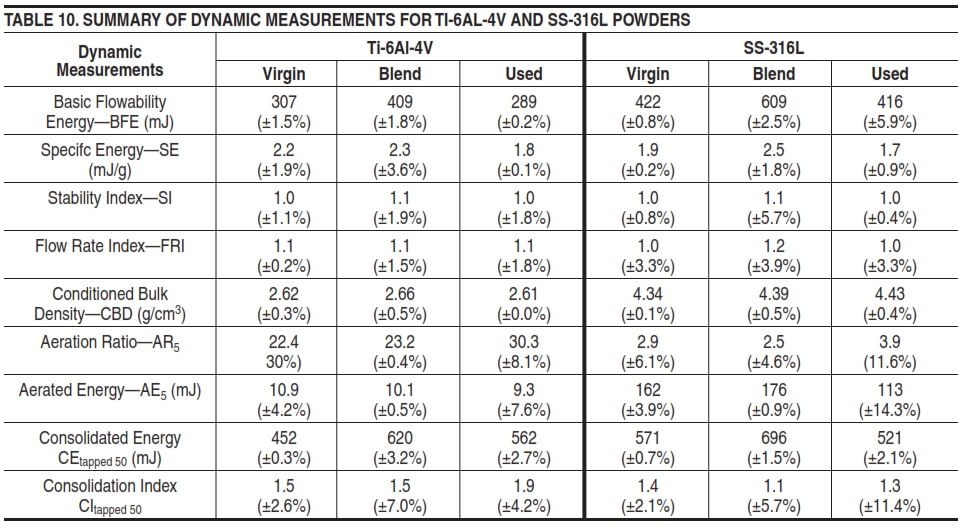
The FT4 rheometer is shown in Figure 20 and the principles of the dynamic measurements illustrated in Figures 21 and 22. The rheometer measures the resistance of the powder to flow whilst the powder is in motion. A precision blade is rotated and moved downwards on a helical path through the powder to establish a precise flow pattern. The resistance experienced by the blade is measured both on the downward as well as the upward motion of the blade. The instrument measures both rotational and vertical resistance and it is the composite of the two signals that quantifies the total resistance of the powder to flow. A conditioning step is performed prior to any testing. The results of dynamic measurements for both the Ti-6Al-4V and SS-316L powders are summarized in Table 10. The tests were carried out using a 23.5-mm blade and a 25-mm diameter vessel.
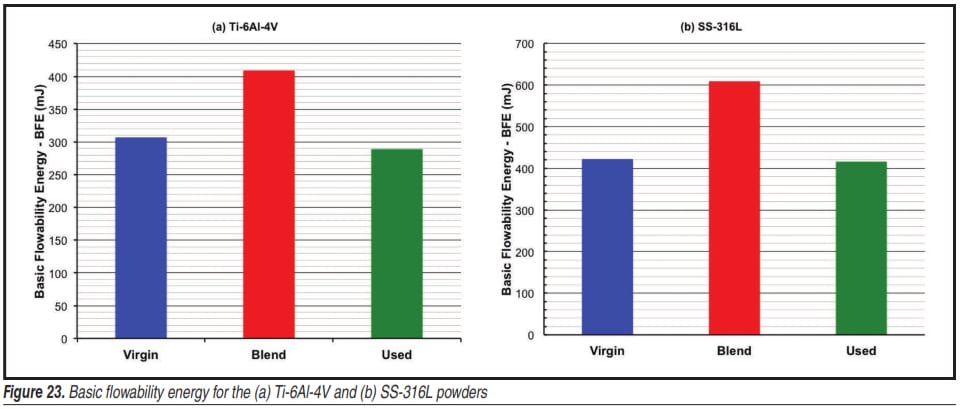
Basic flow energy (BFE) is the energy required to establish a particular flow pattern in a conditioned, precise volume of powder. The flow pattern is a downward anti-clockwise motion of the blade that generates a compressive, relatively high stress flow mode in the powder. The BFE is calculated from the work done in moving the blade through the powder from the top of the vessel to the bottom—i.e., during the downward traverse.
The basic flowability energy (BFE) for the SS-316L powder test portions is higher than for the Ti-6Al-4V powders—Figure 23. However, it is not possible to distinguish between the virgin and used powders for either material. The reason for the higher basic flowability energy of the blend is under investigation.
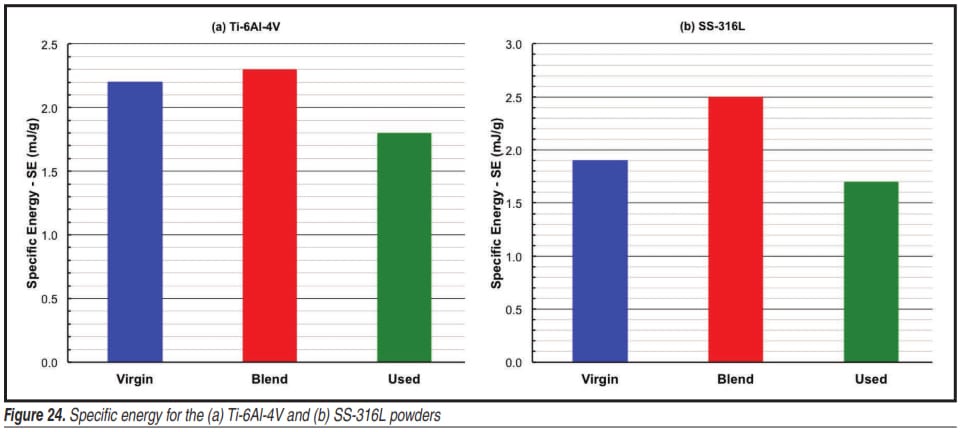
The specific energy (SE) is measured during the upward movement of the blade through the powder.
The flow pattern is identical to that during the downward flow pattern. However, because it is established on the upward traverse and because the powder is now unconfined, i.e., the powder can lift up, the energies measured are more dependent on inter-particular forces and less influenced by other factors such as compressibility (such as in the BFE test—powder is confined and can’t move down due to the base of the vessel).
The specific energy (SE) of the used powders was lower than that of the virgin powder for both the Ti-6Al4V and SS-316L materials and it is possible to discriminate between the virgin and used powders—Figure 24. The specific energy of the blended powder was higher for both materials and, in the case of the Ti-6Al-4V powder, there was overlap between the SE of the virgin and blended powders.
The stability index indicates whether the flow energy, and therefore the powder itself, is changing as a function of being tested. Particle attrition, segregation, de-agglomeration and de-aeration are examples of what could result in instability.
The stability index values indicate that all of the powders that were tested were physically stable.
The flow rate index measures how sensitive the powder is to being made to flow at different rates through a process by varying the blade tip speed (by a factor of 10).
The flow rate index (FRI) values show minor differences with respect to changes in the flow rate for both materials whether virgin, blended, or used.
Conditioned bulk density (CBD) is calculated automatically using the inbuilt balance of the instrument.
This density is stated to be precise due to the conditioning process that is carried out on the powder before an exact volume of powder is sampled. The conditioning process utilizes the standard blade and moves the powder in a gentle, reproducible way to establish a homogenized stress in the powder. This is stated to be essential for the subsequent measurements, but also for the CBD to be determined.
The CBD of the virgin and used Ti-6Al-4V powders were similar while that of the blended powder was slightly higher. In the case of the SS-316L powders, the used powder had the highest CBD and the virgin powder the lowest.
The presence or absence of air in a powder can greatly affect its flow properties. The addition of air occurs naturally when powder is moved freely, e.g., when discharging powder from a hopper. When aerated, less energy is normally required to move the powder. The aeration behaviour can be represented by the aeration ratio (AR), the factor by which the flow energy is reduced by aeration at a given air velocity—an air velocity of 5 mm/s was used for the tests.
The aeration ratios were significantly higher for the titanium alloy powders compared with those for the stainless steel powders. In the case of the Ti-6Al-4V powders, the used powder had the highest AR suggesting the greatest sensitivity to the introduction of air. The used SS-316L powder had the highest AR for the stainless steel powders.
The aerated energy (AE) is the flow energy measured when air is passed through the powder at a given velocity—in these tests at 5 mm/s.
The consolidated energy (CE) is the energy needed to displace the consolidated powder after a specified number of taps—in these tests after 50 taps.
The consolidation index (CI) is the factor by which the flow energy is increased as a result of consolidation of the powder before testing—in these tests after 50 taps. It is the total flow energy of the consolidated test portion divided by the basic flowability energy.
The Ti-6Al-4V powders had slightly higher values for the CI than the SS-316L powders with the used titanium alloy powder having the highest value of all suggesting a greater sensitivity to tapping and vibrational forces.
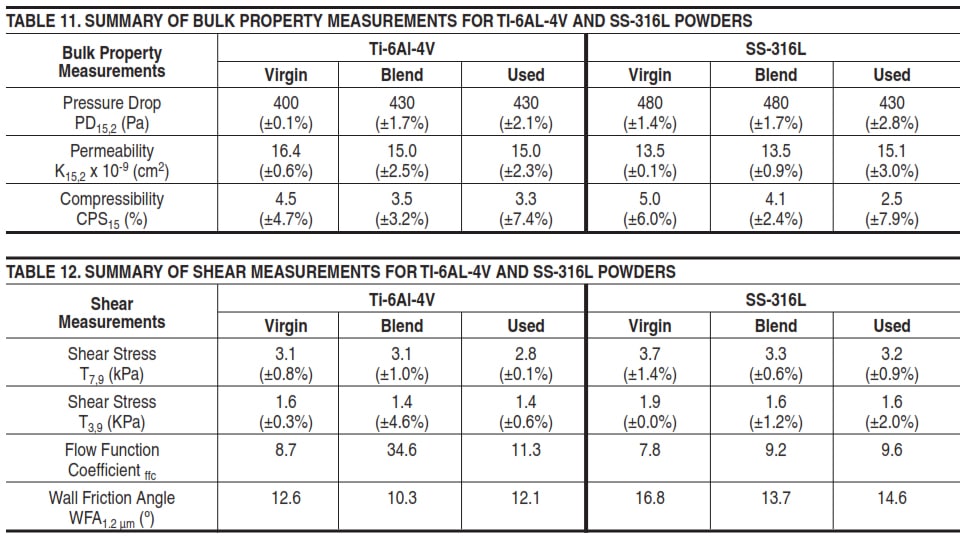
Bulk property measurements and shear measurements were also made using the FT4 rheometer and the results are summarized in Tables 11 and 12.
Permeability measures the ease with which the powder bed will transmit or release air over a range of stress conditions. It measures the air pressure required to maintain a constant airflow through the powder bed whilst being consolidated at increasing normal stresses.
Generally, a higher normal stress results in a higher pressure drop as the permeability is reduced due to particles being more closely packed. Higher pressure drop values indicate that the material is less permeable. The pressure drop was measured at a normal stress of 15 kPa and an air velocity of 2 mm/s.
Minor differences were observed between pressure drop values for the various test portions.
The compressibility is the percentage by which the bulk density increases at a normal stress of 15 kPa. The virgin test portions of both the Ti-6Al-4V and SS-316L powders exhibited the highest compressibility percent age suggesting less efficiently packed powder beds for these powders.
Shear cell tests are intended to determine the shear stress required to initiate flow in a pre-consolidated powder. This provides an indication of how easily a powder will move from a static condition into dynamic flow (e.g., when the outlet of a hopper is opened). The test involves applying a known normal stress to the powder and then applying a rotational torque to determine the point of failure, i.e., steady-state flow is achieved between the two shearing surfaces.
Minor differences were observed between the various Ti-6Al-4V test portions. The virgin SS-316L test portions exhibited the highest shear stress values suggesting an increased resistance to the onset of flow.
The wall friction test is similar to the shear cell test. However, instead of the powder being forced to shear against itself, a disc of a known material is forced to shear against the surface of the powder bed whilst subjected to varying normal stresses. Tests were conducted using a 1.2 μm Ra 316 stainless steel coupon. The blended Ti-6Al-4V test portions had the lowest wall friction angle, suggesting less friction between the powder and the walls of the test equipment. The virgin SS-316L test portions generated the highest wall friction angle for the stainless steel powders suggesting an increased resistance to the onset of flow.
COMMENTS ON THE FT4 RHEOMETER TESTING
The anomalous behaviour, in many instances, of the blended powders in the FT4 rheometer requires further investigation, particularly as the blended powders exhibited values between those of the virgin and used powders for the various tests conducted using the Revolution Powder Analyzer.
The inability of the rheometer to discriminate between the virgin and used powders with respect to basic flowability energy is somewhat of a concern. Fortunately, the specific energy (SE) of the used powders was lower than that of the virgin powder for both the Ti-6Al-4V and SS-316L materials and it is possible to discriminate between the virgin and used powders. Nevertheless, in the case of the Ti-6Al-4V powder, there was overlap between the SE of the virgin and blended powders.
The various tests with the rheometer require different pieces of equipment, and the full battery of tests needs more time than for the full series of tests run on the Revolution Powder Analyzer. It is, however, likely that additional testing will be carried out using the FT4 rheometer. However, the testing probably will initially be focused on a few of the many possible tests that can be carried out.
ACKNOWLEDGEMENTS
Thanks to Chris Schade and Dave Cernava of Hoeganaes Corporation for supplying the powder samples for testing and to the companies that participated in the workshop: Greg Martiska of Mercury Scientific Inc., Joe Tauber of Kennametal Inc., Tony Thornton of Micromeritics Instrument Corporation, and Tim Freeman of Freeman Technology, a Micromeritics Company.
REFERENCES
1. Tony Thornton, John Guerin, and Jack Saad, The “Effect of the Number of Printer Cycles on Titanium and Steel Powders Used for AM,” Advances in Metal Additive Manufacturing—2019, Metal Powder Industries Federation, Princeton, NJ, 2019.
–