
Sizing of non-spherical, sub-micron particles
The sizing of non-spherical, sub-micron particles using polarisation intensity differential scattering (PIDS)
Introduction
Nearly all laser-based particle-sizing devices make no allowance for the shape of the materials under test, regardless of the size of the particles. The reason for this lies with the underlying assumptions used for calculating size distributions from the raw data generated during the analysis.
The mathematical models used to calculate distributions are based on spherical systems. So any reported distribution is, in effect, an equivalent spherical distribution of the material being analysed. In most instances, this is quite adequate since most particles approximate to a spherical system adequately enough.
The LS Series multi-wavelength particle size analysers from Beckman Coulter, Inc. utilize a complementary scattering technology for the sizing of sub-micron particles. This technical note will describe, by reference to real samples, how non-spherical particles are sized using the PIDS system.
Why PIDS?
Why use PIDS for sizing sub-micron particles rather than the standard, forward, low-angle scattering technologies employed by the majority of instrument manufacturers? It is not the aim of this note to discuss light scattering theory in detail, but rather to give an overview of the most important factors as they relate to the sizing of small particles.
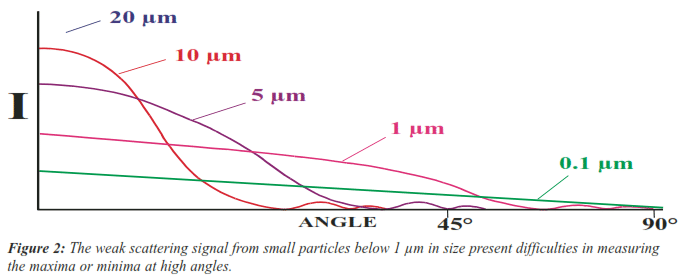
When illuminated by a laser beam, large particles scatter light strongly at low angles and with easily detectable maxima and minima in the scattering pattern. This means that detectors placed at low angles relative to the optical path and with sufficient angular resolution can detect these maxima and minima (Figure 2).
Conversely, small particles scatter light weakly and can only measure maxima and minima at very high angles. This makes the detection and the resolution of the scattering pattern difficult.
Different manufacturers have adopted different solutions to overcome these limitations with varying degrees of success. Most efforts have focused on the measurement of back-scattered light. While such strategies help, they are not complete solutions and should be viewed as stop-gap approaches.
For this reason Beckman Coulter developed PIDS for high resolution sub-micron sizing, allowing for the first time a complete solution to the problem of sub-micron sizing.
PIDS
The technology employed in PIDS™ (Polarization Intensity Differential Scattering) is simple and takes advantage of the well established and understood Mie theory of light scattering.
PIDS relies upon the transverse nature of light, i.e., it consists of a magnetic vector and an electric vector at 90 degrees to it. If, for example, the electric vector is “up and down” the light is said to be vertically polarized.
When we illuminate a sample with a light of a given polarized wavelength, the oscillating electric field establishes a dipole, or oscillation, of the electrons in the sample. These oscillations will be in the same plane of polarization as the propagated light source. The oscillating dipoles in the particles radiate light in all directions except that of the irradiating light source.
PIDS takes advantage of this phenomenon. Three wavelengths (450 nm, 600 nm, and 900 nm) sequentially illuminate the sample, first with vertically and then horizontally polarized light. We measure the scattered or radiated light from the samples over a range of angles. By analysing the differences between the horizontally and the vertically scattered light for each wavelength we gain information about the particle size distribution of the sample. It is important to remember that we are measuring the differences between the vertically and the horizontally polarized signals, and not simply the values at a given polarization.
The intensity vs. scattering angle information from the PIDS signals is then incorporated into the standard algorithm from the intensity vs. scattering angle data from the laser light scattering to give a continuous size distribution, which in the case of the LS 230 and LS 13 320 is 0.04 µm to 2,000 µm.
One major benefit of acquiring PIDS data is that by simple interpretation of the raw data we can quickly confirm whether small particles are genuinely present or not.
Sub-Micron Sizing
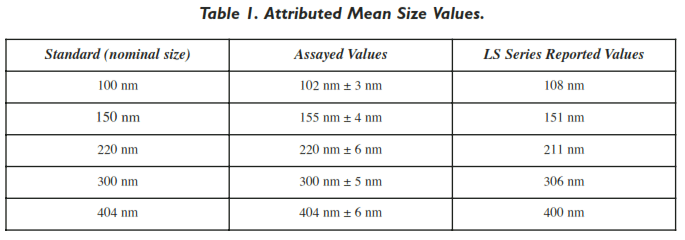
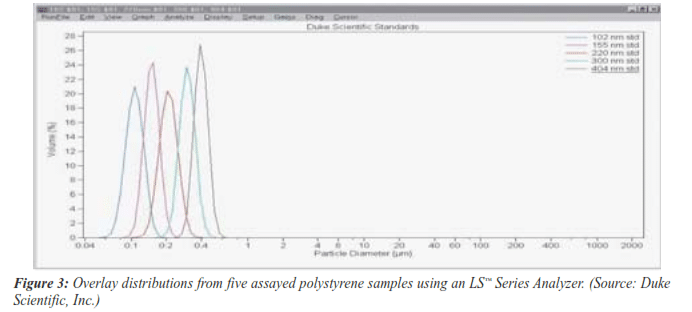
First, let us examine the effectiveness of PIDS for sizing spherical particles. The soundest way to do this is to measure independently assayed materials. The optical properties of polystyrene spheres are well documented and the material represents a reliable source of materials for such studies.
Figure 3 and Table 1 show the results attained by the LS Series for the standards tested.
Having demonstrated the suitability of PIDS to measure accurately the particle size of spheres, let us proceed to evaluate PIDS for the measurement of non-spherical particles.
Sizing Non-Spherical Sub-Micron Particles
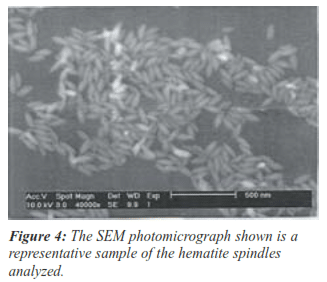
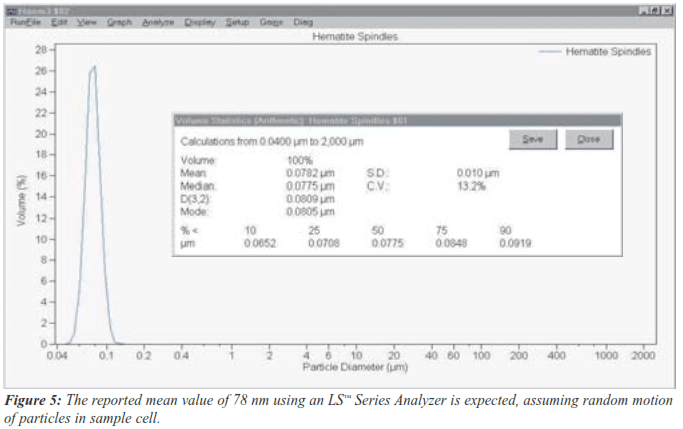
Until recently, sourcing suitable sub-micron, non-spherical particles for studies of this type has been difficult because of the lack of independently produced and assayed materials. However, the colloid chemistry department at the University of Utrecht now produces a variety of mono-dispersed, non-spherical materials. Figure 4 shows the results obtained for the analysis of sub-micron, hematite spindles (oblate spheroids).The size of the particles (determined by scanning electron microscopy, or SEM) is 46.9 nm in width and 130.8 nm in length, giving them an approximate aspect ratio of 3:1. The particles are mono-sized and are readily dispersed.
LS Series Particle Size Distribution for Hematite Spindles
The optical properties of the hematite spindles have been determined from UV/Vis spectroscopy for the imaginary component of the refractive index and from UV/Vis spectroscopic ellipsometry data for the real component.
The reported value for the mean size from the LS Series Analyzer is 78 nm (Figure 5), which is well in accordance with what one would expect given the random motion of the particles in the sample cell. Statistically, one would expect the reported mean size to be a function of all the possible orientations of the particles as they are traversed to the optical path. Indeed, most instruments are designed to ensure that particles in the sample cell are orientated in a random manner with regard to their morphology or shape.
PIDS Raw Data Analysis
As mentioned, PIDS™ offers a dual benefit in that the raw data can also shows if small particles are present in the distribution. This is a unique feature of the PIDS technology and removes most of the “guess work” when trying to establish that a sub-micron population is real or is an artefact. This is an undesirable effect found in many laser-based particle size analysers.
The presence of large particles does not interfere with the PIDS signals and does not give rise to artefacts, because, while large particles will give rise to an amount of scatter, which is detectable by the PIDS system, it is not differential in nature. Put simply, large particles scatter essentially equal scatter at both horizontal and vertical polarizations for each wavelength. The PIDS system measures the differences between the polarization scattering signals (only present with small particles).
Detecting Small Particles by Raw Data Analysis
Two samples are compared (Figure 6) by viewing the raw data in PIDS; the first sample having a mean size of 102 nm and the second having a mean size of 13 µm. For each sample, a total of 42 discreet measurements are taken, representing six detectors and a concentration detector and six sublets with a specific wavelength and polarization.
For the sub-micron test material, note the following:
• There is a large difference in the PIDS intensities for each polarization at each wavelength.
• There is a significant angular dependencies (changes in the shape of the flux vs. angle/detector number) in the horizontal light scatter intensity data for each wavelength, especially note the parabolic (curved) shape of the horizontal data sets.
• There is also a large, easily measured scattering signal (Detector Flux, Y-axis).
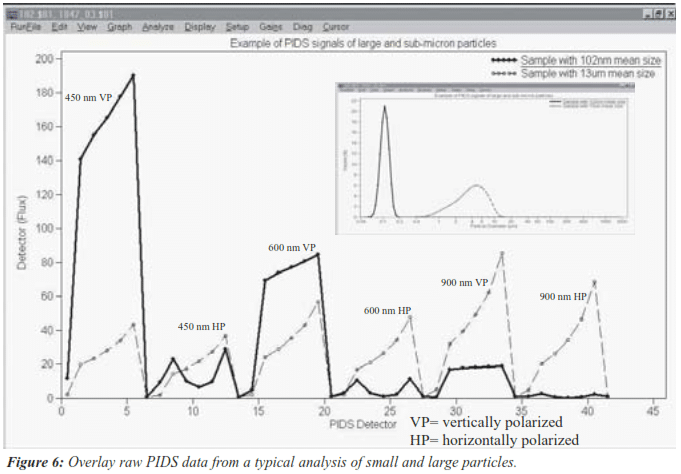
For the larger test material, note the following:
• There is no significant difference in the PIDS intensities for each polarization at each wavelength.• There is a simple linear relationship for both polarization states, for each wavelength, in terms of angular scattering intensity.
• There is also a small scattering signal (Detector Flux, Y-axis).
Conclusion
This work suggests that PIDS technology is an accurate and usable technique for the sizing of spherical, sub-micron materials. Even for nonspherical, sub-micron particles, the technique also yields meaningful data despite the limitations to which all scattering techniques are subject.