Author: Sophie Lindsey

Powder Coatings Application Note

Particle characterisation of Powder Coatings

Industrial
Applications
Powder Coatings

Particle Size and Shape Analysis of Powder Coatings

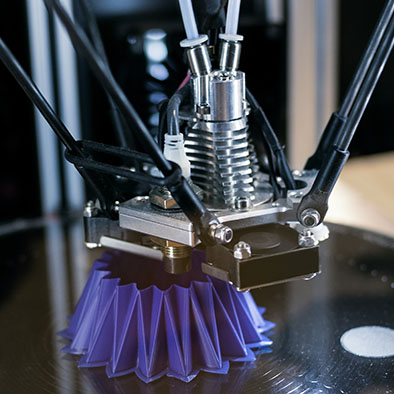
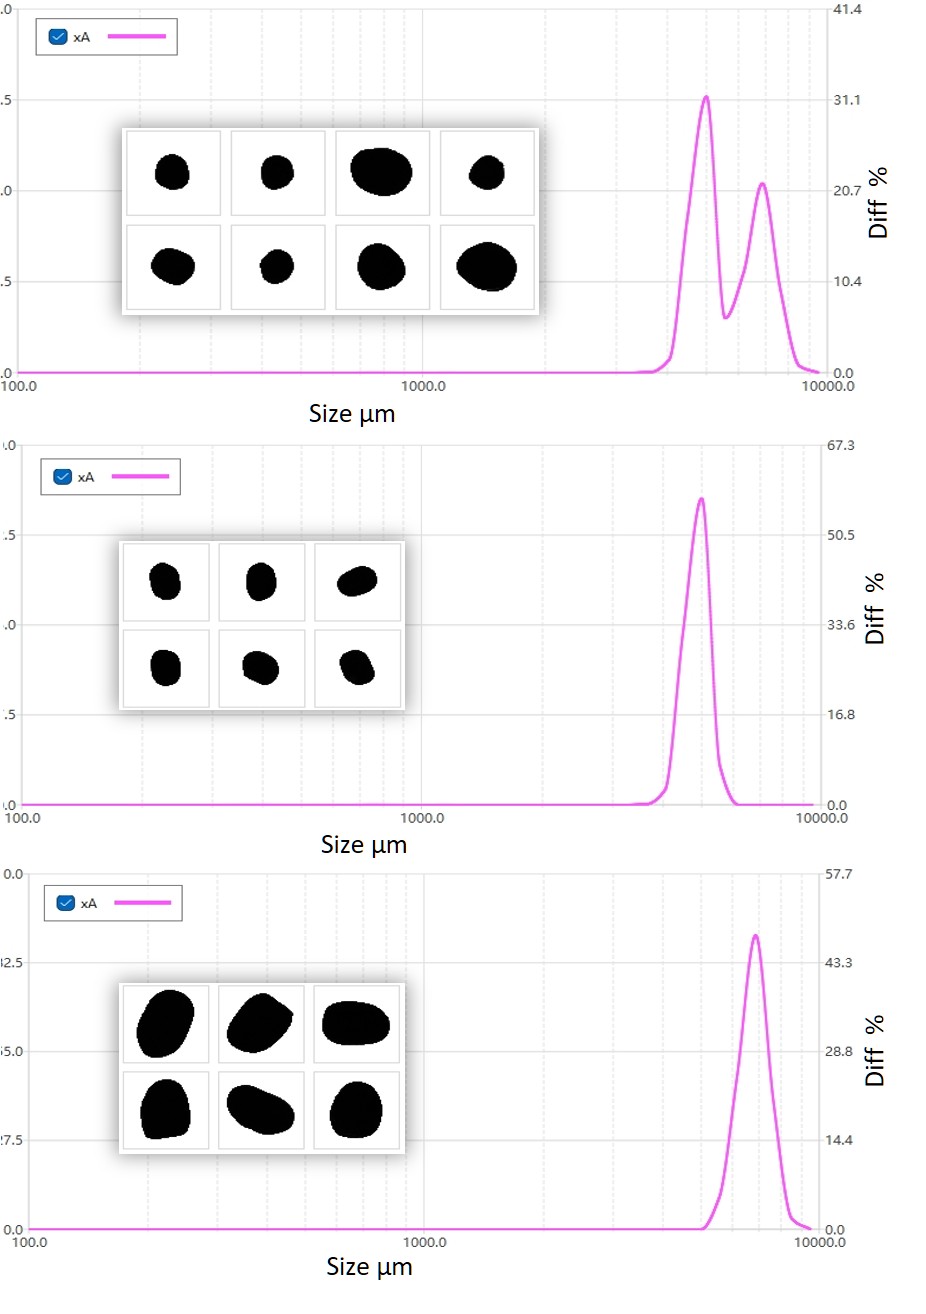
In the production process of powder coatings, particle size is one of the most important physical properties, which not only affects the spraying performance of finished coatings, but is also closely related to the entire production process of coatings. In this note, different kinds of powder coatings have been successfully characterized by laser diffraction analysers, which have replaced conventional methods to a large extent mainly due to the advantages of the technology including ease of use, fast operation and high reproducibility, which are powerful tools for the powder coating industry.

Continue reading

Ceramic Products Application Note

Advanced Ceramic Materials

Industrial
Applications
Ceramic Products

The Quality Control of Advanced Ceramic Products by the Bettersizer S3 Plus

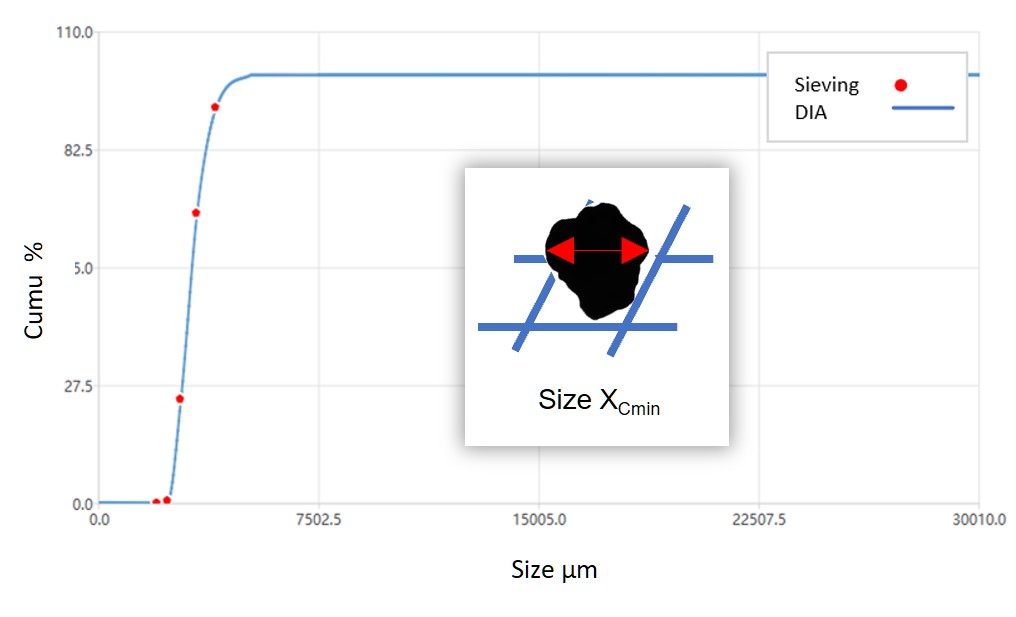
The global demand for advanced ceramics, with the unique thermal, wear, and corrosion resistant capabilities, in biomedical, aerospace industry, precision tools, electronics, and environmental fields is on the increase. Optimizing and controlling the particle size distribution of powder to improve the microstructure of ceramic products are crucial to the final performances. The Bettersizer S3 Plus and BT-A60 autosampler can provide ceramic powder producers and ceramic product manufacturers with a highly automatic and time-saving method for measuring large numbers of samples. The high performances and the combination of dynamic image analysis enable the Bettersizer S3 Plus to be a reliable and powerful tool for quality control during any process of ceramic production.

Continue reading

Soy Milk Application Note

Characterisation of Soy Milk using Bettersizer S3 Plus

Industrial
Applications
Soy Milk

Particle Size Analysis: Exploring the Impact of Homogenization on Soy Milk

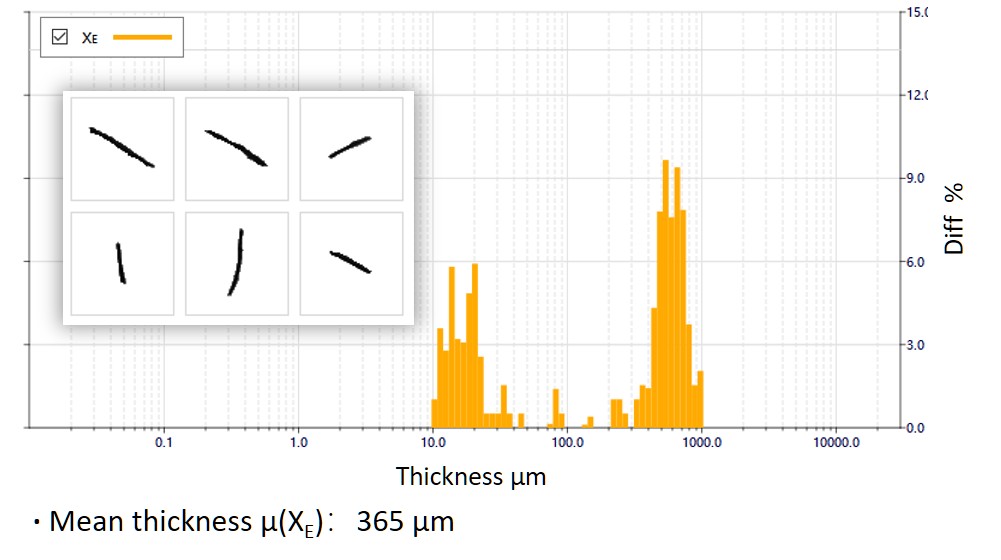
To enhance the taste and stability of soy milk, homogenization, subjecting the liquid to intense shearing, breaking down large fat globules particle and protein clusters, is a crucial step in the manufacturing process. Bettersize can provide the soy milk particle analysis with the combination of two instruments: Bettersizer S3 Plus and BeVision S1, so as to ensure the overall quality of soy milk product and create a homogeneous liquid that effectively prevents fat floating and protein settling.

Continue reading

Laser Diffraction

Technology
Laser Diffraction

Introduction

The particle size distribution is a crucial parameter in many applications that involve powders or dispersions. These include construction materials like cement and sand, pharmaceuticals, ceramics, colored pigments, fertilizers, emulsions, and more. As the range of applications expands, so do the requirements for measuring methods in terms of size range, measurement time, and reproducibility.

Measuring particles close to the range limits and simultaneously detecting particle sizes of both small (nanometer range) and large particles (lower millimeter range) for polymodally or broadly distributed samples is particularly challenging. However, modern laser diffraction particle size analyzers such as the Bettersizer S3 Plus overcome these challenges through innovative optical system design that detects backscattered light of very small particles and captures large particles with an integrated high-speed CCD camera or a combination of laser diffraction method and image analysis method.

Measuring Method

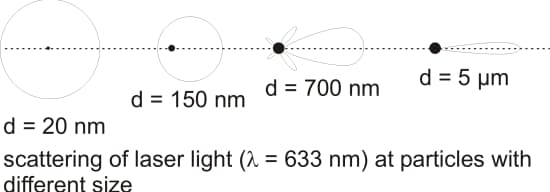
Laser diffraction method of particle sizing involves the interaction of laser (monochromatic and coherent light) with particles that need to be measured in terms of their size. The diffraction of light waves by the particles follows a distinct pattern depending on their size: larger particles scatter more light in the forward direction. For particles smaller than 100 nm, the scattering intensity is almost the same in all directions.

BioLector Microbioreactor

The scattering intensity is determined by stationary detectors depending on the angle. State-of-the-art laser diffraction systems such as the Bettersizer S3 Plus laser diffraction particle size analyzer guarantee the determination of scattering intensities in a continuous angular range of 0.02 – 165°, i. e. in the forward, side, and backward direction. This is achieved by means of the unique Dual Lens and Oblique Incidence (DLOI) optical system: Fourier lenses (collective lens) are positioned between the laser and particles as well as between particles and detectors. The particles will interact with the light within a parallel laser beam. This offers the advantage that the scattered light can also be detected at very large angles (in the backward scattering direction) and thus even very small particles can be detected and measured precisely. Thanks to DLOI technology, the problems of conventional measurement setups can also be avoided. Therefore, neither the suitable lenses for the corresponding particle size measurement range have to be selected prior to the measurement (in comparison to the Fourier optics), nor do measurement inaccuracies result from different particle-to-detector distances if not all particles lie in one plane (in comparison to the inverse Fourier optics).

BioLector Microbioreactor

To calculate the particle size distribution from the measured scattering spectra, the theory of either FRAUNHOFER or MIE is applied. The FRAUNHOFER theory is based on the hypothesis of opaque and spherical particles: the scattered pattern corresponds to a thin opaque two-dimensional plate – diffraction only occurs at the edges. Therefore no additional optical input constants of the material are necessary for this calculation. In contrast, the MIE theory uses the hypothesis of virtually translucent and spherical particles, meaning that light permeates the matter and is scattered elastically at the atoms of the particle. The knowledge of the complex refractive index of the particles and the liquid as well is necessary. This theory is applicable to particles of all sizes.

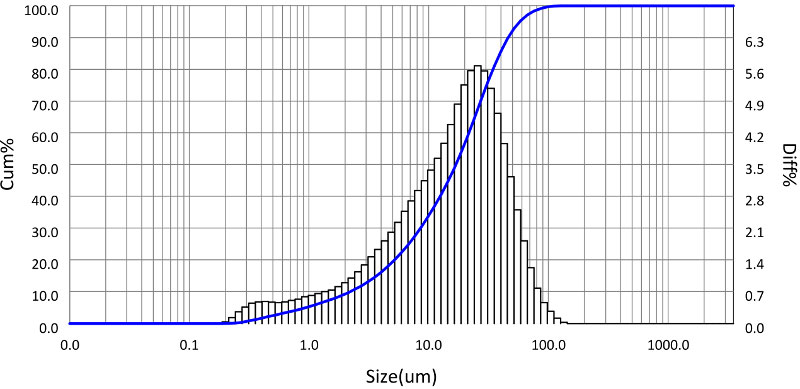
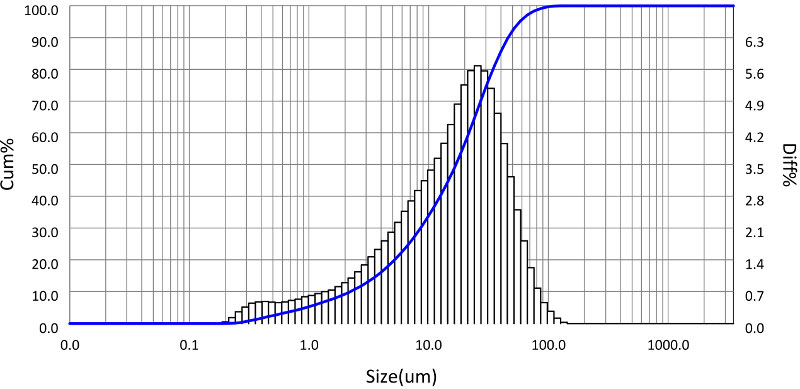
The following figure shows an example of a volume-weighted particle size distribution of a calcium carbonate powder – measured with a Bettersizer S3 Plus. The cumulative throughput curve (blue line) and the resulting histogram (black bar) can be seen.

BioLector Microbioreactor

Product

Continue reading

Image Analysis

Technology
Image Analysis

What is image analysis?

The term “image analysis” is describing the mechanism: the image analyzer will capture an image of a 3-D particle first, then do the analysis based on the 2-D particle projection image. Depending on the movement state of particles during the measurement, the image analysis method is divided into 2 kinds: one is the dynamic image analysis method (DIA), and another is the static image analysis method (SIA).

Why Image Analysis?

Today, particle size alone may not be sufficient to get qualified products out the door. Many industries are turning to particle size and shape analysis. This is where the image analysis method comes in. The necessity for size and shape analysis of every single particle, combined with ever-increasing PC processing power, ensures that automated imaging methods are becoming increasingly more relevant to a market which is taking advantages of non-spherical particles.

Automated imaging methods for the determination of the particle size distribution of a material offers a fundamental advantage over alternative methods such as static light scattering, sedimentation or sieving: Each particle is photographed and thus analyzed individually! In addition, the individual photography of the particles gives the opportunity to make statistical calculations of not only the particle size but also the particle shape, this results in several important advantages for the determination of the particle size (shape) distribution:

  • Realistic proportional values also at the edges of the size distribution, i. e. detection of oversized particles or fine particles
  • More meaningful size and shape parameters of each single particle, instead of diameter of ideal spheres. e. g. geodetic length or elongation for fibers.
  • For more information, please check the particle size and shape parameter guidebook
  • Flexible changeovers between distribution types (volume / area / number) depending on the particular task
  • Visual assessment of the dispersing state of a sample (dispersing quality, presence of agglomerates)
  • Further differentiation of materials. For example, in addition to the particle size distribution, the roughness of the particle surface plays an important role for the success of shaping or polishing.

How to Image Analysis?

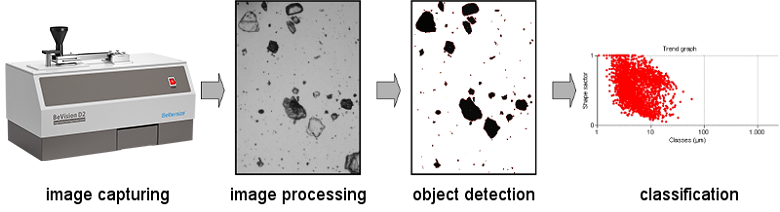
The determination of the particle size and shape by image analysis method includes 4 basic steps:

1. Image taking

The image taking process is the base of the image analysis method. Special digital cameras are ultilized to ensure a clear vision contains sharp images of particles. If necessary, the camera can be in combination to a microscope.

2. Image processing and particles detection

Appropriate software processes captured pictures: signal noise, isolated pixels and edging particles are eliminated, brightness is adjusted to strengthen the contrast between the particle and the background, etc.

Particles are then separated from the background. Depending on the application, special requirements will be employed to filter out part of particles, such as agglomerates, bubbles, or reflecting metal powders.

3. Particle size and shape calculation

Size and shape parameters of every single particle will be calculated with the software.

4. Statistical calculations and classification

The particles are arranged in classes (e.g. size equivalent classes) on the basis of their attributed features (size and shape parameters).

BioLector Microbioreactor

Product

Continue reading

Serum

Serum

Biological Information
Serum

Characterisation solutions for Serum

Cell analysis of serum using cell size analysers and zeta potential analysers provides detailed information on cell population distribution and surface charge. This technology aids in understanding cell interactions, stability, and behaviour in serum, crucial for applications in diagnostics, therapeutics, and research in immunology and cellular biology.

Dynamic Light Scattering

Dynamic light scattering (DLS) technology analyses cell size by measuring the scattering of laser light caused by particle movement, providing precise data on cell size distribution and aggregation.

Zeta Potential

Zeta potential analysis of serum uses electrophoretic light scattering to measure the electrical charge on cell surfaces, providing insights into cell stability, interactions, and aggregation tendencies in biological samples.

Analysing Serum in Research

Analysing serum for research involves measuring biomarkers to uncover insights into physiological processes, disease mechanisms, and potential therapeutic targets. By examining various components, such as proteins, hormones, and metabolites, researchers can identify correlations, track changes over time, and validate hypotheses. This detailed analysis enhances understanding of health and disease, contributing to the development of new treatments and advancing scientific knowledge in biomedical research.

Case study

A research laboratory based in the UK aimed to investigate the thermal-sensitive rheological behaviour of bovine serum albumin (BSA) solutions. Understanding the viscoelastic properties of BSA at various temperatures is crucial for applications in biotechnology and pharmaceutical formulations. The laboratory employed Dynamic Light Scattering Microrheology (DLS Microrheology) using the BeNano 180 Zeta to achieve this goal.

The UK research laboratory successfully utilised Dynamic Light Scattering Microrheology with the BeNano 180 Zeta to measure the thermal-sensitive rheological behavior of BSA solutions. Highlighting the instrument’s capability to provide detailed and precise measurements, significantly advancing the understanding of BSA’s viscoelastic properties under varying temperatures. The insights gained are invaluable for optimising applications in biotechnology and pharmaceuticals.

Instruments to support the analysis of serum

Applications to support the analysis of serum

Continue reading

Virology

Particle characterisation in Virology

Biological Information
Virology

Why cell characterisation is important in virology

Cell characterization in virology involves analyzing cell morphology, growth, viability, and susceptibility to viral infections. Techniques like nanoparticle tracking, interferometry, and zeta potential provide critical insights into host-virus interactions, aiding in the development of antiviral drugs, vaccines, and understanding viral pathogenesis and replication mechanisms.

Nanoparticle Tracking Analysis (NTA)

Nanoparticle Tracking Analysis (NTA) accurately sizes and counts viruses in solution by tracking their Brownian motion, providing crucial data for virology research, vaccine development, and understanding viral behaviour in biological fluids.

Nanoparticle Size and Concentration Analysis

Nanoparticle size and concentration analysis of viruses assesses their dimensions and quantity in solutions, essential for virology, vaccine development, and studying viral dynamics in biological environments.

Case study

A British-owned R&D laboratory aimed to optimise the production process of lentiviral vectors, critical for gene therapy and vaccine development. They integrated the Myriade Videodrop, a microfluidic-based platform for nanoparticle analysis, to enhance efficiency and quality control.The platform utilises microfluidic technology to measure size and concentration based on light scattering.

“Integration of our Videodrop streamlined the production process, reducing time and labor-intensive steps.”

The lab achieved significant success using the Myriade Videodrop for optimising lentiviral vector production. They proved the platform’s capability to enhance efficiency, ensuring quality, and accelerate advancements in gene therapy and vaccine development.

The integration of advanced nanoparticle analysis technologies like Videodrop is pivotal for driving breakthroughs in biopharmaceutical research and therapeutic applications.

Instruments to support analysis of viruses

Applications to support the analysis of viruses

Continue reading

Gene and Cell Therapy

Cell and Gene Therapy

Biological Information
Gene and Cell Therapy

Why particle characterisation is important in Gene and Cell Therapy

Characterisation is crucial for ensuring safety, efficacy, and consistency. It helps identify the genetic modifications, monitor cell health, and assess therapeutic potential. Precise characterisation ensures regulatory compliance, guides treatment development, and optimises patient outcomes by tailoring therapies to individual genetic profiles.

Cell Size

Cell size is crucial in gene and cell therapy as it influences cellular uptake, viability, and therapeutic efficacy. Accurate size measurement ensures optimal cell selection and enhances treatment outcomes.

Cell Counting

Cell counting is vital for ensuring accurate dosing, monitoring therapeutic progress, and maintaining quality control. Precise counts ensure treatment consistency and regulatory compliance.

Surface Plasmon Resonance

Surface plasmon resonance is crucial in gene and cell therapy for analyzing biomolecular interactions in real-time, aiding in the identification of binding affinities, kinetics, and specificity, thus enhancing therapeutic development and efficacy.

Case study

In gene regulation studies, understanding molecular interactions between DNA, RNA, proteins, and small molecules is critical. The P4SPR (Four-Channel Surface Plasmon Resonance) system proves invaluable in analyzing these interactions in real-time, offering precise data on binding kinetics and affinities. The objective was to utilise the P4SPR system to study the binding dynamics between transcription factors and regulatory DNA sequences, crucial for elucidating gene expression mechanisms.

The P4SPR system is a powerful tool for studying gene regulation by providing real-time insights into molecular interactions. Its ability to quantify binding affinities and kinetics aids in deciphering complex regulatory networks and designing targeted interventions in gene therapy and biotechnology. This case study underscores the P4SPR’s role in advancing our understanding of gene regulation mechanisms, offering potential applications in therapeutic development and personalized medicine.

Instruments to support Gene & Cell Therapy

Applications to support Gene & Cell Therapy

Continue reading

Pharmaceutical Manufacturing

Industry Information
Pharmaceutical Manufacturing

Why particle characterisation is important in the pharmaceutical industry

Particle characterisation is vital to ensure product quality, efficacy, and safety. It enables precise control over particle size, shape, and distribution, influencing drug performance, stability, and bioavailability. Comprehensive characterisation supports formulation optimisation, process validation, and regulatory compliance, ensuring patient well-being.

Particle shape and light obscuration analysis in pharmaceutical manufacturing

Meritics offers comprehensive particle shape and light obscuration analysis solutions tailored for pharmaceutical manufacturing, ensuring precise characterisation of particles crucial for product quality and regulatory compliance.

Texture analysis 

Meritics provides advanced texture analysis solutions for pharmaceutical manufacturing, ensuring precise characterisation of drug formulations crucial for optimizing product performance and ensuring patient safety and efficacy.

Particle Analysis in Vaccine Manufacturing and Development

Particle size analysis in vaccine manufacturing and development ensures the quality, safety, and efficacy of vaccines by characterising particles, optimising formulations, and ensuring regulatory compliance for global public health.

Case study

As a leading pharmaceutical company dedicated to delivering high-quality medications, ensuring the purity and stability of our active pharmaceutical ingredients (APIs) is of utmost importance to us.

We faced challenges in detecting and quantifying aggregation and agglomeration phenomena in our APIs, which could compromise their efficacy, safety, and stability.

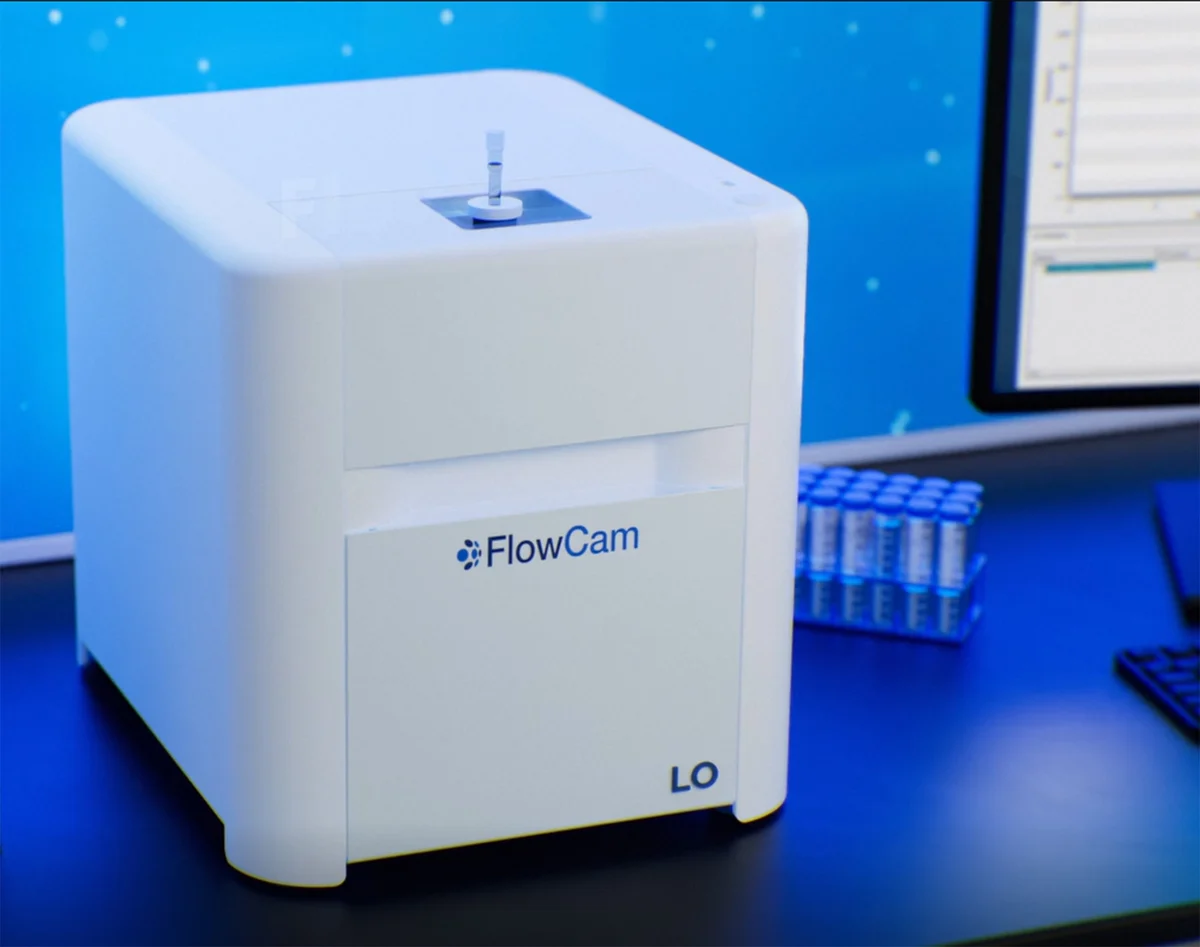
To tackle these challenges, we sought guidance from specialists at Meritics, who suggested and provided a demonstration of the FlowCam LO. This instrument combines flow imaging microscopy and light obscuration analysis, enhancing our quality control procedures.

Instruments to support pharmaceutical manufacturing

Applications to support pharmaceutical manufacturing

Continue reading

Therapeutics (Other) Application Note

Other Therapeutics FlowCam LO

Industrial and Biological
Applications
Other Therapeutics

Particle Characterisation in Biotherapeutics

Particle content is a critical quality attribute for many biologics that must be monitored to meet regulatory requirements like USP <788> and mitigate product safety risks.

Flow imaging microscopy is an established technique recommended by USP <1788> for subvisible and submicron particle analysis, revealing particle count, size, and shape, indicating their type and source.

Monitor the aggregation of adjuvants, nano-drug delivery systems, and other small particles to larger, potentially concerning, submicron and subvisible particles.

Use FlowCam to:

  • Detect aggregation and agglomeration of the active pharmaceutical ingredient (API) and drug delivery vehicles to improve product stability
  • Obtain images and particle morphology information not obtainable from orthogonal techniques to assess product degradation
  • Differentiate between inherent particles, intrinsic particles like glass flakes and silicone oil droplets, and extrinsic contaminants
  • Optimize and control particulates in your formulation

FlowCam – A Flexible Particle Analysis Solution

Apply flow imaging microscopy techniques to therapeutics including aggregates of drug delivery systems like liposomes, exosomes, and gold nanoparticles, and vaccine components like virus-like particles and adjuvants.

FlowCam is ideally suited to analyze samples containing larger particles like CHO cells, cell cultures and associated particles like Dynabeads™ and Tentagel™ beads, and hydrogel spheres.

Obtain size and morphology information of these particles that is related to product quality issues such as cell viability, misshapen drug delivery vehicles, and the form of any aggregates present.

  • Improving vaccine formulations by monitoring API and adjuvant aggregation
  • Characterising large liposome, exosome, and other drug delivery platform morphology with an automated microscopy technique
  • Optimizing cell concentrations and viability during biotherapeutic manufacturing
  • Observing Dynabead binding and measuring unbound bead concentrations in cell culture applications
  • Product

  • Industry

Continue reading

Protein Therapeutics Application Note

FlowCam Protein Therapeutics

Biological
Applications
Protein Therapeutics

FlowCam for Protein Therapeutics Development and Manufacturing

Discover a high-throughput flow imaging microscopy platform for characterizing API aggregates and other particulates in your protein, monoclonal antibody, or antibody-drug conjugate formulation.

Monitor your formulation for protein aggregates, intrinsic particles including silicone oil, degraded polysorbate, and glass flakes, as well as extrinsic contaminants.

FlowCam provides quality assurance for your parenteral drug product to give you peace of mind about the stability and safety of your formulation.

Use FlowCam to:

  • Count and size protein aggregates as small as 300 nm with industry-leading image quality
  • Obtain complementary particle image data recommended by USP <1788> to verify orthogonal particle size measurements by light obscuration
  • Utilize image-based analytics including artificial intelligence tools to classify subvisible and submicron particles

FlowCam Provides Confidence in Protein Formulation Quality

Capture high-resolution images for the identification of particle type, allowing you to detect and mitigate undesirable and potentially harmful particle formation at the source.

Improve formulation design based on knowledge obtained by using FlowCam in accelerated protein stability studies.

  • Use FlowCam LO to obtain USP <787> compendial particle sizing information and images in a single instrument in quality control monitoring
  • Improve lab productivity and data reproducibility with ALH for FlowCam automated liquid handling.
  • Employ VisualAI™ to classify images of protein biotherapeutics automatically with higher than 90% accuracy
  • Product

  • Industry

Continue reading

Advanced Materials Application Note

Advanced materials Flow Cam

Industrial
Applications
Advanced Materials

FlowCam for Advanced Materials Performance Testing

Effective particle analysis techniques are essential to quality control programs across a wide range of manufacturing industries.

FlowCam offers a complete solution for characterising particles, ensuring end-product quality and conformity with industry regulations.

Use FlowCam to:

Perform compliance testing in accordance with ISO and ASTM standards
Enhance quality assurance programs by monitoring particle uniformity and consistency throughout the production process
Determine filter performance by comparing image and concentration data pre and post-separation
Evaluate quality of raw materials as inputs into manufacturing processes

Subtitle

  • Perform compliance testing in accordance with ISO and ASTM standards
  • Enhance quality assurance programs by monitoring particle uniformity and consistency throughout the production process
  • Determine filter performance by comparing image and concentration data pre and post-separation
  • Evaluate quality of raw materials as inputs into manufacturing processes

Enhance Particle Analysis and Characterization with Digital Images

FlowCam is a comprehensive dynamic imaging analysis platform that provides an efficient method to confirm data obtained from other particle analysis techniques.

With real digital images, you can verify the size, shape, and identity of your particles.

  • Confirm size, shape, circularity and material uniformity of printer toner particles during and after production.
  • Evaluate size and shape uniformity of superabrasive particles such as micronized diamonds and cubic boron nitride (CBN).
  • Compare material properties across processing stages using parameters specifically designed to accurately measure fiber morphology.
  • Validate wash water cleanliness and visually confirm, quantify, and characterize each particle type.
  • Product

  • Industry

Continue reading

Advanced Materials

Particle Characterisation in Advanced Materials

Industry Information
Advanced Materials

Why particle characterisation is important in advanced materials industries

Particle characterisation is fundamental in the field of advanced materials, where precise control and understanding of properties contribute to the development of innovative materials. Meritics has a number of particle characterisation solutions for the industry.

Flow Imaging Microscopy

Flow imaging microscopy enables real-time visualisation and analysis of particle morphology, size distribution, and aggregation dynamics, facilitating precise control over material synthesis, formulation, and performance optimisation.

Laser Diffraction Particle Size Analysis

Particle size analysis in advanced materials ensures precise control over particle dimensions, aiding in tailoring material properties for specific applications such as nanotechnology, pharmaceuticals, and composite materials, enhancing performance and functionality.

Pore Size Analysis

Pore size analysis in advanced materials enables characterisation of pore structure and distribution, crucial for optimizing material properties like permeability, adsorption capacity, and mechanical strength in diverse applications.

Powder Flow Analysis

Powder flow analysis assesses flow properties crucial for manufacturing processes like compaction, granulation, and coating, ensuring consistency and efficiency in producing high-performance materials.

Surface Area Analysis

Meritics have a range of surface area analysers. Used in advanced materials to quantify available surface area, vital for optimising adsorption, catalysis, and reactivity in applications such as catalysts, batteries, and gas storage materials, enhancing performance and efficiency.

Case study

In a lithium-ion battery production facility, optimising electrode materials’ tapped density was paramount for enhancing battery performance. By employing tapped density measurements, our engineers fine-tuned electrode formulations to achieve optimal packing density, ensuring maximum electrolyte penetration and ion diffusion pathways.

We use the BeDensi T Pro Series. This improved battery capacity, cycle life, and overall efficiency. As a result, the batteries exhibited enhanced energy density and prolonged lifespan, meeting stringent performance requirements, therefore advancing sustainability and technological innovation.

Instruments to support advanced materials

Applications to support advanced materials

Continue reading

Environmental Sector

Industry Information
Environmental Sector

Why particle characterisation is important in the environmental sector

Particle characterisation techniques commonly used in environmental sciences include laser diffraction for particle size analysis, flow imaging microscopy for soil sciences and pollen viability, surface area analysis analyse soil and dynamic light scattering for measuring particle size distribution in various samples such as soil, water, and air pollutants.

Laser diffraction particle size analysis in soils

Laser diffraction particle size analysis in soils accurately measures particle size distribution, providing essential data for soil classification, engineering evaluations, and environmental assessments in various soil-related applications.

Flow Imaging Microscopy 

Flow imaging microscopy can be used to assess pollen morphology, size, and integrity, enabling precise determination of pollen viability and fertility, vital for agricultural breeding and plant reproduction studies.

Using zeta potential in soil analysis

Zeta potential analysis in soils assesses the surface charge of soil particles, informing on soil aggregation, nutrient adsorption, and soil-water interactions crucial for soil fertility and management strategies.

Surface area measurements to support environmental studies

Surface area measurements quantify the available surface area of particles, aiding in understanding adsorption phenomena, pollutant interactions, and remediation strategies in various matrices.

Case study

Our client is dedicated to studying nanoparticle behaviour in natural ecosystems. Understanding the interactions between nanoparticles and environmental components is crucial for assessing potential risks and developing effective mitigation strategies.

They faced challenges in accurately characterising the surface charge of nanoparticles, which is essential for predicting their fate, transport, and ecological impacts. Conventional techniques lacked the sensitivity and resolution needed to study nanoparticles in complex environmental matrices.

The BeNano 180 Zeta Pro played a pivotal role in advancing their research efforts by providing precise and sensitive measurements of nanoparticle zeta potential. By better understanding nanoparticle interactions in natural ecosystems, they aim to promote environmental sustainability and protect ecological integrity.

Instruments to support the environmental sector

Applications to support the environmental sector

Continue reading

Environmental Application Note

Industrial
Applications
Environmental Research

FlowCam for Environmental Monitoring and Research

Flow Imaging Microscopy offers a new perspective on environmental particle analysis. With high-quality digital images, FlowCam provides insights into soil sciences, pollen viability studies, atmospheric particle studies, microplastics analysis, stormwater runoff, and environmental monitoring.

Additional applications include wastewater processing, aerosol analysis, sediment studies, and advanced material science analysis.

Use FlowCam to:

  • Optimise encapsulation processes by dynamically monitoring the capsule formation process over time
  • Evaluate pollen particles and pollen shell capsule integrity for seed and fruit health
  • Study aerosols and environmental pollutants
  • Determine presence of and monitor health and growth of soil microbes, mites, forest litter invertebrates, and nematodes

Explore FlowCam Applications for Agricultural Sciences

Ensure successful crop production and profitability by monitoring the health and vitality of inputs to your agricultural system and analyzing data to improve the quality of feed, soil drainage, crop yield, and fertilizer potency.

FlowCam provides real-time results and analyses – minimizing the resources you need to meet regulatory, ecological, economic, and social requirements of sustainable farm management.

  • Assess pollen viability using colorimetric data and customizable size and shape filter criteria
  • Evaluate agricultural system health by imaging, categorizing, and quantifying microbial communities in soils and livestock guts
  • Optimize milling and granulation operations by comparing particle images and morphologic features across process steps
  • Detect aggregation and inflated size distributions in fertilizers and soil amendments that may slow the rate of solubility
  • Product

  • Industry

Continue reading

Food and Beverage Application Note

Industrial
Applications
Food and Beverage

FlowCam Particle Analysis Simplifies Quality Control of Food & Beverage Products

Ingredients are critical in all facets of the food and beverage industry. Flow imaging microscopy allows you to isolate different particle types from a heterogeneous mixture in order to ensure quality and detect process flaws.

An efficient, high-throughput analysis tool, FlowCam can detect variations in particle size, morphology, and texture allowing for streamlined quality control.

Use FlowCam to:

  • Ensure uniformity within homogeneous mixtures while also checking for undesirable agglomerations and foreign contaminants
  • Distinguish between and quantify distinct particle types from heterogeneous mixtures to better understand ingredient composition
  • Compare properties between different raw material lots to detect process flaws and reduce product variability

Improve the Taste and Texture of Your Food and Beverage Products with FlowCam

Particle size distribution and shape impacts not only taste and texture but flavor, quality, and production efficiency.

FlowCam has been used in a variety of food and beverage applications for the following advantages:

  • Examine particle morphology and aggregation in relation to viscosity and texture differences between raw ingredient lots
  • Assess size and viability of microorganisms, including yeast and bacteria
  • Study proportion of different structural forms of fungi to create meat and dairy alternatives
  • Characterize size, shape, integrity, and concentration of pulp particles in their concentrate to deliver uniformity of texture and flavor in products
  • Optimize encapsulation process by dynamically monitoring capsule formation process over time
  • Compare images to monitor microencapsulation process for flavoring research and development
  • Product

  • Industry

Continue reading

Plants

Biological Applications
Plants

Solutions for analysing plant cells

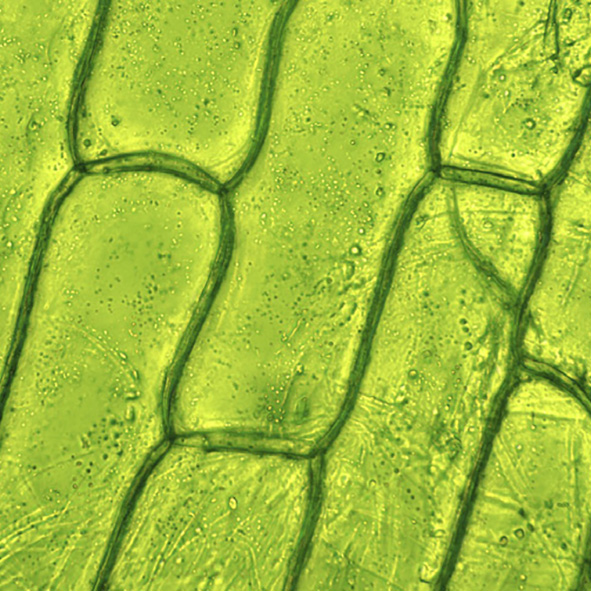
Cell analysis using cell counting and dynamic image analysis involves quantifying and monitoring cells in real time. This method evaluates cell size, morphology, and viability, aiding in understanding plant growth and health. Advanced imaging techniques provide detailed insights, facilitating research in plant physiology, genetics, and disease resistance.

Cell Counting

The Beckman Coulter Multisizer 4e uses electrical impedance to count and size cells, providing high-resolution data on cell volume and concentration, essential for precise analysis of cell cultures.

Dynamic Image Analysis

Dynamic image analysis of plant cells employs high-resolution imaging and software to monitor live cells, providing detailed insights into cell morphology, growth dynamics, and physiological responses in real time.

Analysis of Pollen

Analysing pollen involves examining its size, shape, and surface texture to identify species and track environmental changes. This process uses microscopy and various imaging techniques to capture detailed features, which helps in understanding pollen distribution, allergenicity, and ecological impacts. Accurate pollen analysis is essential for applications in agriculture, climate research, and allergy studies, offering insights into plant biodiversity and seasonal patterns. Advanced tools and methods enhance precision, aiding researchers and professionals in environmental and health-related fields.

Case study

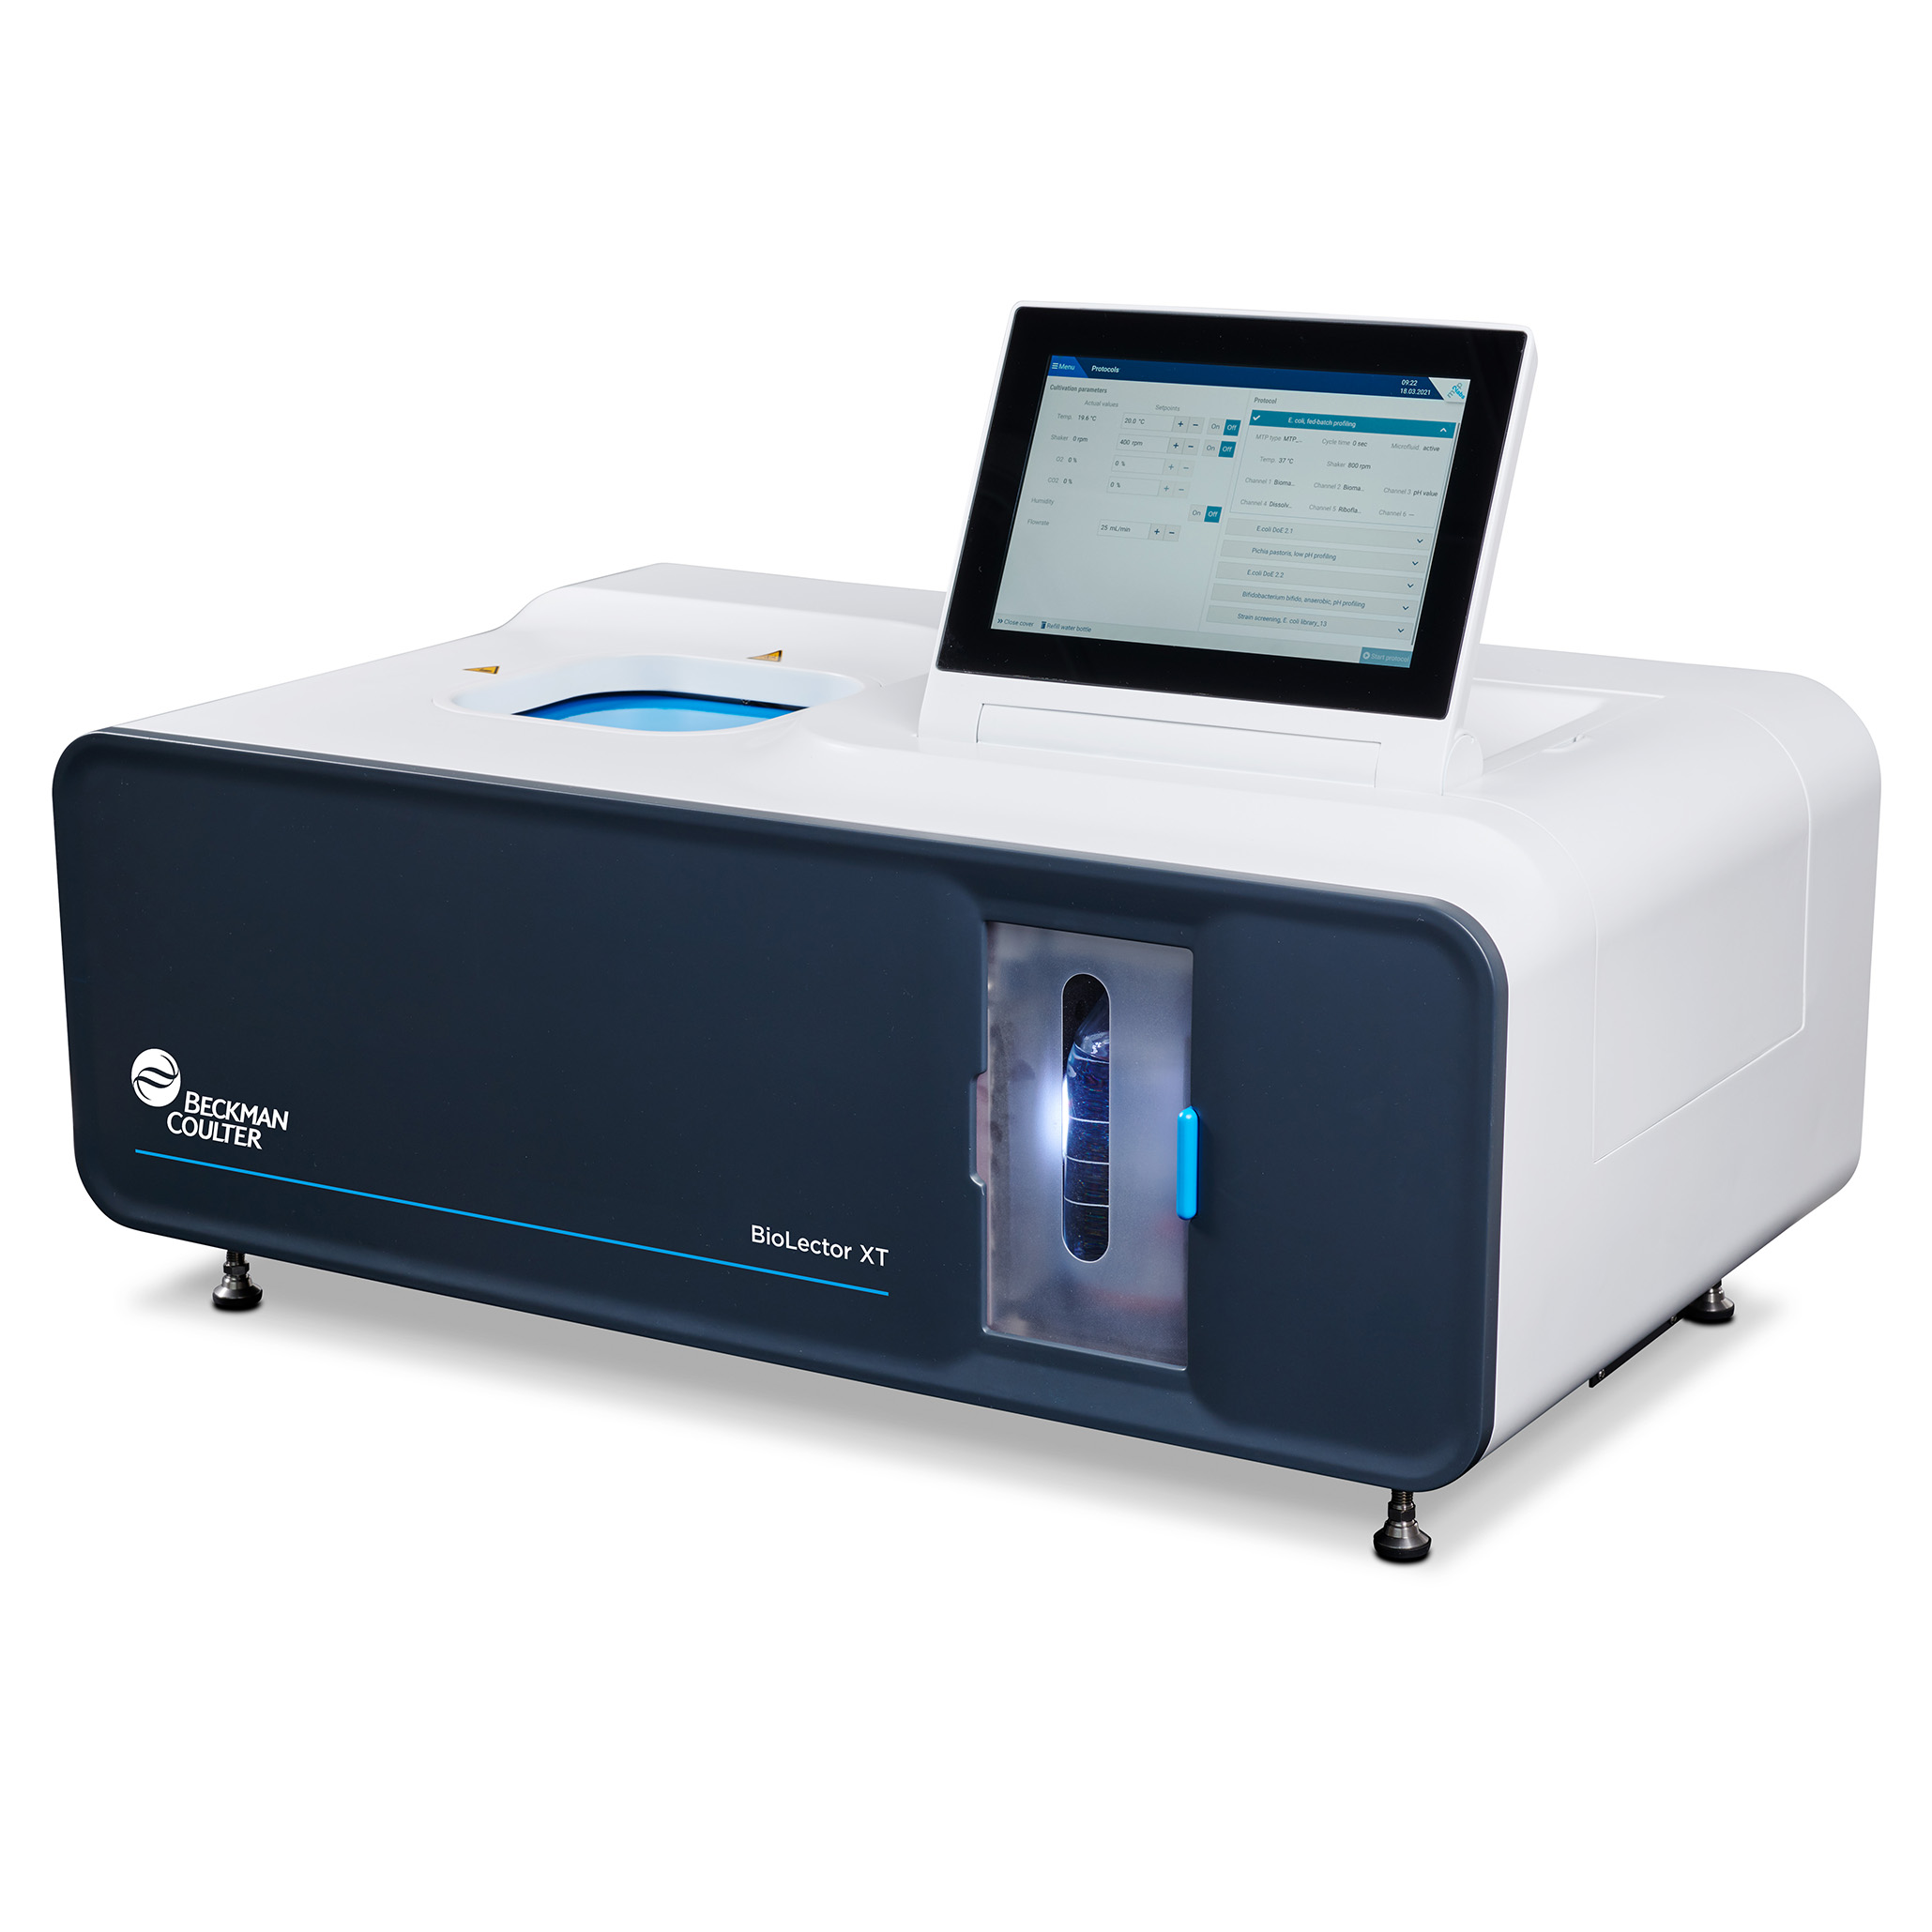
A leading pharmaceutical company aimed to enhance the mass production of a high-value plant-derived metabolite used in several of its therapeutic products. Traditional methods faced challenges in scalability, consistency, and yield. The company integrated the Beckman Coulter BioLector XT Microbioreactor and Multisizer 4e to optimise and scale up production.

The pharmaceutical company successfully enhanced the mass production of a key plant-derived metabolite. They demonstrated significant yield improvements, better consistency, and scalability, highlighting the potential of these technologies to revolutionise plant cell culture-based production in the pharmaceutical industry.

Instruments to support the analysis of plants

Applications to support the analysis of plants

Continue reading

Plant Cell Application Note

Biological
Applications
Plant Cells

Moniotoring Plant Cell Cultures with BioLector and Multisizer 4e Instruments

Cell cultures can be used to grow plant cells. Typically, this technique is performed in an aseptic and controlled environment with a variety of nutrient solutions.

Plant cell cultures have a wide range of applications from basic research (e.g., studies on plant growth and differentiation) to mass production of plant-derived metabolites (e.g. production of the anti-cancer agent paclitaxel). Therefore, they have become increasingly attractive and cost-effective alternatives to classical approaches for the mass production of plant-derived metabolites. However, it is crucial to monitor culture conditions to optimise the rate of cell prol
iferation and maximize productivity levels. Likewise, the cells must be characterised to
detect changes in the cell culture, such as the formation of cell aggregates or cellular lysis. This application note will demonstrate how the BioLector XT microbioreactor and the Multisizer 4e Coulter Counter can be used to optimise plant cell culture conditions and therefore cell growth.

Continue reading

Bacteria

Biological Applications
Bacteria

Solutions for characterising bacteria

Characterising bacteria is essential for understanding their roles in ecosystems, diagnosing infections, and developing treatments. It helps identify beneficial strains for probiotics and industrial applications, and informs antibiotic resistance strategies. Accurate bacterial characterisation also aids in tracking disease outbreaks and ensures food and water safety.

Dynamic Light Scattering (DLS)

Dynamic Light Scattering characterises bacteria by measuring their size distribution and aggregation. It’s a non-invasive, rapid method, crucial for understanding bacterial behavior in various environments and applications.

Coulter Principle

The Coulter principle characterises bacteria by measuring changes in electrical resistance as they pass through a small aperture. This method accurately determines bacterial size and concentration in a sample.

Case study

In the biotechnology industry, Escherichia coli (E. coli) is a widely used bacterial strain for the production of recombinant proteins, plasmid DNA, and other bioproducts. Ensuring optimal growth and maintaining the quality of E. coli cultures is crucial for production efficiency.

The Beckman Coulter Multisizer 4e proved to be an essential tool for analyzing E. coli cultures in a biotechnology company. Its capability to provide precise and detailed measurements of cell size distribution and concentration ensured optimal fermentation conditions, leading to high-quality production of recombinant proteins and other bioproducts. The use of the Multisizer 4e improved process control, enhanced product consistency, and supported regulatory compliance, thereby contributing significantly to the efficiency and success of biotechnological manufacturing operations.

Instruments to support characterisation of bacteria

Applications to support characterisation of bacteria

Continue reading

Probiotic Bacteria Application Note

Biological
Applications
Probiotic Bacteria

Anaerobic cultivation processes of probiotic bacteria in the BioLector XT microbioreactor

Probiotics are living bacteria that are said to have a health-promoting benefit and biofunctional effects on the human organism. They are commonly used to increase the number of desirable bacteria in the intestine and to regenerate the intestinal flora, for example after antibiotic treatments.

That is one reason why the market for probiotics or probiotic nutritional supplements has greatly increased in value. The research field of the human intestinal microbiome and its health-promoting benefits is particularly important for the nutrition industry. Therefore, scientific research on anaerobic or microaerophilic cultivation techniques, such as the cultivation of probiotics under microbiome-like conditions, is essential. Probiotics include a whole range of anaerobic bacteria such as Lactobacillus or Bifidobacterium. Among the various probiotic bacteria, Bifidobacterium spp. is one of the most widely used and studied probiotic bacterium species. They are classified as strict anaerobes due to the incapability of oxygen respiration and growth under aerobic cultivation conditions an they are a major member of the dominant human gut microbiota.

They play a significant role in controlling the pH through the release of lactic and acetic acids, which restrict the growth of many potential pathogenic bacteria. In the intestinal tract of breast-fed infants, Bifidobacterium is the predominant cell species. It accounts for more than 80% of microorganisms in the intestine. There are more than 200 known species of Lactobacillus, the largest and most diverse genus within the lactic acid bacteria that is generally recognized as safe (GRAS) by the US Food and Drug Administration (FDA). Lactobacillus spp. have been deployed and studied extensively as fermentation starter cultures for dairy products or probiotics due to their applied health potential.

In this application note we present anaerobic cultivation experiments using the BioLector XT microbioreactor in combination with the gassing lid.

Continue reading

BioLector XT

Beckman Coulter
BioLector XT

Microbioreactor

  • Multiple processe
  • Enhanced PIDS Technology
  • Real data down to 10nm

Download
brochure
   Request
quote

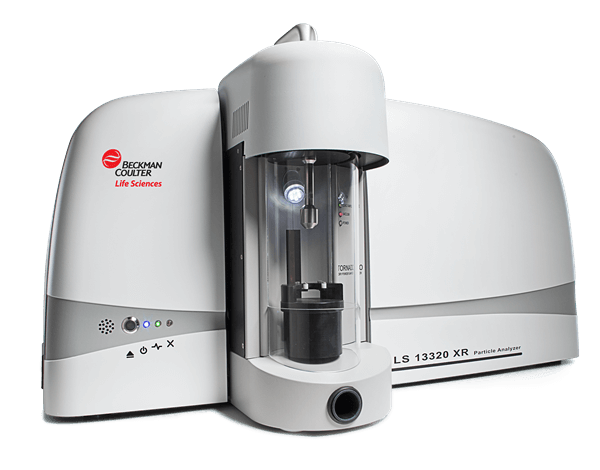
Beckman Coulter LS 13 320 XR Laser Diffraction Particle Size Analyser 21 CFR Part 11

BioLector XT microbioreactor accelerates your bioprocess development

High-throughput microbioreactor enables real-time evaluation of biomass, fluorescence, pH, dissolved oxygen in the liquid phase (DO), and other key cultivation parameters for aerobes and anaerobes.

Building on trusted BioLector Pro technology, the BioLector XT microbioreactor is based on a standard ANSI/SLAS (SBS) microtiter plate (MTP) format, and operates with online, pre-calibrated optical sensors. Disposable 48 well MTPs enable online measurement of cultivation parameters, while patented microfluidic technology supports simultaneous pH control and feeding. The optional microfluidic module eliminates manual liquid handling—no tubing or pipetting required, as everything is part of the beta-radiated ready-to-use plate.

Meritics are proud to partner with Beckman Coulter Life Sciences by hosting the UK demonstration unit of the BioLector XT microbioreactor at our premises. Extensive experience within the UK biologics sector and highly rated application and laboratory personnel makes Meritics the ideal partner to showcase the BioLector XT microbioreactor and its real-world applications.

© 2023 Beckman Coulter, Inc. All rights reserved. Beckman Coulter, the stylized logo and the Beckman Coulter product and service marks mentioned herein are trademarks or registered trademarks of Beckman Coulter, Inc. in the United States and other countries. All other trademarks are the property of their respective owners.

  • Key Features

    Innovative New Gassing Head
    • Enables fed-batch experiments under anaerobic conditions
    • Gassing with O2 within a range of 1% – 100% and with CO2 within 1% – 12 %
    • Reduces gas consumption to a few mL/minute
    • Optional humidification of gases reduces evaporation
    Optional Microfluidic Module
    • Unleashes full potential of the BioLector XT
    • Complements online monitoring function with well-specific pH regulation/feeding
    • Enables use of 2 reservoir wells per 4 cultivation wells
    • Microvalves allot liquids at nanoliter-scale
    “Plug-and-play” Plate Design
    • Real-time kinetics out of 48/32 parallel cultivations
    • Customisable feeding strategies (batch, fed-batch, bolus, continuous)*
    • Control of pH on-the-plate with pre-calibrated optical sensors*
    • Small working volume (800 – 2400 μL)

    *Functionality requires optional microfluidic module

    Intelligent BioLection Software
    • Intuitive user interface supports multi-user environments
    • Free programming of all control parameters
    • Open system enables live data downloads
    • Fast processor ensures rapid download of experiment data
  • Technical Specs

    Volume

    800 – 2400 µL

    pH Range

    pH 4 – 7.5 (depending on plate)

    Scattered Light Measurement

    Resolution > 50 NTU, at densities higher than 500 NTU: 10 % of measured value.

    Height

    522 mm(20.6 in)

    Width

    797 mm(31.4 in)

    Depth

    520 mm(20.5 in)

    Temperature range

    10 – 50 °C (minimum temperature 8 °C below ambient temperature)

    DO Range

    0 – 100% oxygen saturation (100% corresponding to the DO level reached while gassing with 100% O2 without O2 consumption)

    Wavelengths

    365 nm–800 nm

    Weight

    61 kg(134.5 lb)

  • Accessories

    Microfluidic Module

    The microfluidic (MF) module for the BioLector XT microbioreactor allows you to run up to 32 highly flexible, pH-controlled fed-batch cultivations in microscale during one cultivation experiment run.

    Anaerobic Clutivation

    The anaerobic module for the BioLector XT microbioreactor enables strict anaerobic fermentation processes combined with a controlled, low nitrogen gas flow rate.

    CO2 Up Regulation

    With the CO2 up-regulation module the microbioreactor continuously measures the CO2 level inside the chamber and automatically regulates the flow of CO2 into the chamber.

    LED Filter

    With the LED / filter module, the microbioreactor can measure additional fluorescences. An LED unit and two optical filter glasses are installed inside the BioLector microbioreactor.

    O2 Down Regulation

    With the O2 down-regulation module the microbioreactor continuously measures the oxygen level inside the chamber and automatically regulates the flow of nitrogen into the chamber.

    O2 Up Regulation

    With the O2 up-regulation module the microbioreactor continuously measures the oxygen level inside the chamber and automatically regulates the flow of oxygen into the chamber.

    There is more information on all the accessories on the Beckman Coulter website

  • Applications

    Yeast

    E. coli

    Probiotic Bacteria

    Plant Cells

Not sure if it’s the right instrument?

No worries, send us a sample and we will test it for you


Send a sample

Continue reading

E. coli Application Note

Biological
Applications
E. coli

Monitoring E. coli Cultures with the BioLector and Multisizer 4e Instruments

Escherichia coli (E. coli) is a facultative anaerobic bacterium that lives in the lower intestine of warmblooded animals, including humans

E. coli can be cultured easily and inexpensively in a laboratory setting and has become an important model organism in genetics, microbiology and biotechnology. E. coli is the most common organism used for the large-scale production of therapeutic proteins. Indeed, 30% of approved therapeutic proteins are currently being produced using E. coli. This application note will demonstrate how the BioLector microbioreactor and the Multisizer 4e Coulter Counter can be used to optimize E. coli culture conditions and characterise cell growth. It is important to have the right instruments to analyse E. coli.

Continue reading

Tissue Culture

Biological Applications
Tissue Culture

Why Tissue Culture analysis is important

Characterising tissue culture is crucial for ensuring the reproducibility and quality of biological research. It involves assessing cell morphology, growth rates, genetic stability, and contamination levels. Accurate characterisation ensures that cultured tissues maintain their intended properties, enabling reliable experimental outcomes and facilitating advancements in drug development, regenerative medicine, and biotechnology.

Coulter Counter method

The Coulter Counter method is a widely used technique for analysing tissue culture, providing precise and automated cell counting. It operates on the principle of electrical impedance, where cells suspended in an electrolyte pass through a small aperture, causing measurable changes in electrical resistance. This method allows for accurate determination of cell concentration, size distribution, and viability. It is particularly beneficial for monitoring cell growth and assessing culture health over time. The Coulter Counter method is efficient, reducing manual errors and increasing throughput, making it indispensable for large-scale tissue culture experiments and quality control in biomedical research and industrial applications.

Case study

A research laboratory based in the UK sought to optimise the culture conditions for yeast cells (Saccharomyces cerevisiae) to enhance growth rates and maximise yield for applications in biotechnology and fermentation processes. Precise characterisation of cell growth was crucial for achieving reproducible and high-quality results.

The UK-based research laboratory successfully utilised the Beckman Coulter Multisizer 4e to optimise yeast cell culture conditions and accurately characterise cell growth. This demonstrated significant improvements in biomass yield and culture reproducibility, highlighting the importance of precise cell analysis in biotechnological research and industrial applications. The insights gained from this study pave the way for more efficient and scalable yeast fermentation processes.

Instruments to analyse tissue culture

Applications for analysing tissue culture

Continue reading

Protein Application Note

Particle Size and Count
Proteins

Optimised procedures for running protein samples

Beckman Coulter’s Multisizer 4 provides analysts with an easy-to-use, technologically-advanced system that can solve most particle sizing and counting challenges. Implementing the Coulter Principle with Smart Technology, the Multisizer 4 ensures the repeatability and uniformity of sample analysis conditions and therefore produces reliable results.

Although the following procedures were developed to address common issues encountered when analysing subvisible particles in protein formulations, the general guidelines can also be used for applications requiring small aperture tubes. Specifically, the cleaning procedures are valuable when characterising very small particles at low concentrations.

Continue reading

Beer Application Note

Particle Size and Count
Beer

Beer, evaluation of final product and filtration efficiency

The concentration and size distribution of particles in beer may be
measured using the Coulter Principle also known as the Electrical
Sensing Zone (ESZ) method. A suitable electrolyte solution is required
to perform the analysis.The sample is prepared by dissolving a certain
volume of beer in the electrolyte and then analysed using a Beckman
Coulter Multisizer 3 to determine the size distribution and concentration
for the particles present in the beer. The results are reported as
number of particles per milliliter for the desired size range.

The use of the Multisizer 3 provides a fast, easy, accurate and
automatic method to determine the particle content in beer. The use
of this instrument also provides reliable results not dependent on the
operator’s judgment making it possible to compare data from different
work shifts and/or breweries.

Significance

The determination of particle concentration in beers is
important for evaluating and/or correcting several steps
during the brewing process and finishing of the product.

■ Evaluation of the Final Product. Each kind of beer
has its own characteristics and distinctive flavor; these
properties will be influenced to some extent by the
content and size distribution of particles present in
the final product.The stability and therefore the shelf
life of beer are also affected by its particle content.

■ Evaluation of Chill Haze Effect. This is the most
common, and in some sense, the most important type
of beer hazesince it is relevant to many beer types.
As the name suggests, this haze appears when the
beer is suitably chilled; the haze disappears upon
warming. The temperatures at which the haze appears
and disappears depend on the physical stability of the
beer.The more stable the beer, the closer to 0 °C
before chill haze occurs.The haze involves complexes
of highmolecularweight proteins and polyphenols (tannins).
These compounds form weak, temperature sensitive
hydrogen bonds that are broken as the beer’s temperature
increases, allowing the resulting compounds
to form a complex with water molecules and go
into solution.

■ Filtration Efficiency. Brewers have been using
some type of filtration for centuries. If properly used,
it can serve as an effective nonadditive tool in beer
clarification. Filtration is used in conjunction with fining
agents to render beer brilliantly clear and stable
with respect to temperature changes.
In this paper we will refer to the evaluation of the
final product and filtration efficiency.

Continue reading

Food and Beverage

Industrial Information
Food and beverage

Why particle characterisation is important in the food and beverage industry

Particle characterisation techniques aid food and beverage manufacturers in ensuring product quality and consistency. By assessing parameters like particle size, shape, and distribution, these techniques optimise formulations, enhance texture, and improve stability, contributing to better sensory attributes and prolonged shelf life of food and beverage products.

Using particle size analysis in food and beverage industries

Particle size analysis in food and beverage industries ensures product consistency and quality, optimising formulations for texture, stability, and sensory attributes, crucial for meeting consumer preferences and regulatory standards.

Shake things up with powder flow analysis

Powder flow analysers assist powdered shake manufacturers in optimising blending and packaging processes, ensuring uniform powder flow properties crucial for consistent product quality and manufacturing efficiency.

Particle shape analysers for beverage manufacturers

Flow imaging microscopy aids whiskey production by analysing suspended particles, ensuring clarity, quality, and consistency in the final product, essential for maintaining brand reputation and consumer satisfaction.

Texture analysers for food manufacturers

Texture analysers are employed in food production to assess product consistency, firmness, and chewiness, ensuring desired sensory attributes and quality across various food products for consumer satisfaction.

Case study

A customer came to us with two samples of the same children’s chocolate milk product taken on two separate days. Their quality control had identified that the two samples differed in colour and one did not taste as smooth on the tongue, it seemed almost gritty in texture.

We ran the samples on the LS13320XR with the ULM module to show the particle distributions. The quality department were able to use this data to understand the differences between the two samples and where in one case the product was perfect, the size distribution showed a smooth curve, just like you can imagine the product tasting. The other sample produced a similar distribution, with a small amount coarse particle size present as an additional peak.

We worked with the customers R&D group to optimise their homogenisation process and hence improve product control; this was then passed no to QC to help with their pass/fail criteria.

The customer was so impressed with the ease of which they were able to obtain this data they purchased an instrument and are now using it as a quality control checks, on a daily basis and by R&D when required, to ensure their product is conforming to their standards every day.

Instruments to support the food and beverage industry

Applications to support the food and beverage industry

Continue reading

Yeast Application Note

Particle Size and Count
Yeast

Monitoring Yeast Cultures with the BioLector and Multisizer 4e instruments

Yeasts are unicellular fungi that share cellular structures and processes that are highly conserved amongst eukaryotes (e.g., membrane-bound organelles, a cytoskeleton, nuclear DNA, secretory proteins and transcription mechanisms). In addition, they are relatively easy and cheap to culture under laboratory conditions, display rapid growth, can be easily genetically manipulated and are able to achieve most of the post-translational modifications required for a biologically active recombinant protein. These characteristics make yeast cultures a popular choice for basic research (e.g., studying the function of specific genes or proteins) and protein production for various applications (e.g., chemicals, fuels, food and pharmaceuticals). This application note will demonstrate how the BioLector XT microbioreactor and the Multisizer 4e Coulter Counter can be used to optimize yeast cell culture conditions and characterize cell growth.

Continue reading

Nanocellulose Application Note

Particle Size Distribution
Nanocellulose

Grading of nanocellulose using a Centrifuge

Nanocellulose is a nanomaterial that is garnering attention recently, and it is obtained from cellulose or a cellulose derivative through wet-type high-pressure dispersion and pulverisation or wet-type grinding and pulverisation. We will introduce the results of particle size measurements made using a Laser diffraction / scattering method particle size distribution measurement apparatus LS 13 320 XR to measure nanocellulose that was obtained by performing wet-type high-pressure dispersion and pulverization on low-substituted hydroxy propylcellulose, which is one type of cellulose derivative, as well as the results for separation of only the component to be measured in the nanosize region through centrifugation.

A Shin-Etsu Chemical Co., Ltd. L-HPC (low-substituted hydroxy propylcellulose) LODICEL LDC-H 2 wt% dispersion was passed through a Sugino Machine Ltd. Starburst test apparatus 10 times at a pressure of 150 MPa for use as the dispersion in the experiment.

The results obtained by measuring the nanoized dispersion using LS 13 320 XR are shown.

At the same time as the detection of the nanosize particles generated as a result of the nanoization processing, we also detected microsize particles that remained without undergoing nanoization.
These results indicate that, even after nanoization processing, many particles remaining at the microsize will be present.

By using LS 13 320 XR, it will be possible to perform a quantitative comparative study by simultaneously measuring micro and nanosize particles.

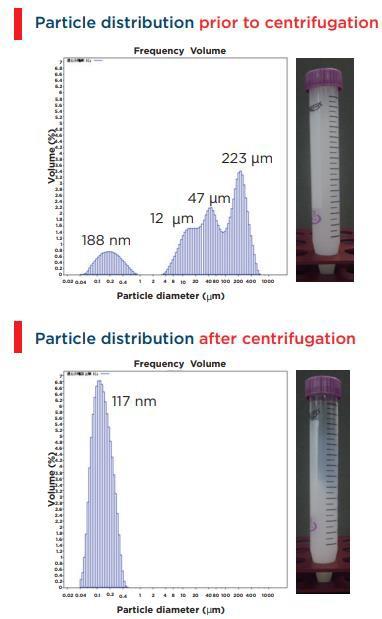
After using a high-speed refrigerated centrifuge (Avanti JXN-26) and a fixed angle rotor (JA-14.50) to centrifuge the material at 14,000 rpm (35,000 xg) for 1 hour, the supernatant was collected and the particle diameter was measured. As a result of
the centrifugation processing, it was possible to isolate and recover only the component consisting of the nanosize particles. The particles measured to be 188 nm prior to centrifugation were measured as 117 nm after centrifugation. This could be because, when there is polydispersion, the smaller particle diameter values will tend to approach the larger particle diameter values.

Continue reading

Using PIDS Technology

Particle Size Analysis
Capabilities

The LS 13 320 XR particle size analyser uses advanced laser diffraction and PIDS technology for the sizing of non-spherical, sub-micron particles.

Beckman Coulter LS 13 320 XR Laser Diffraction Particle Size Analyser 21 CFR Part 11

Extending Laser Diffraction with PIDS Technology

From Fraunhofer to Mie Theory

Laser diffraction originally relied on Fraunhofer diffraction theory for particle sizing. The technique offered several important advantages. Modern laser diffraction analysers now extend beyond simple diffraction effects. Most systems use Mie theory instead. They also measure scattering intensity across a wide angular range. This wider measurement range improves particle size analysis, especially for smaller particles.

The Challenge of Measuring Nanoparticles

Manufacturers typically use two methods to improve small particle sizing. They increase the scattering angle and use shorter light wavelengths. These methods improve performance for many applications. However, they cannot accurately measure particles only tens of nanometres in diameter.

Increasing the scattering angle further provides little additional benefit. Small particles produce very slow changes in scattering intensity at high angles. Figure 2 illustrates this behaviour with a three-dimensional display. Even with wide-angle detection and short wavelengths, particles below 200 nm remain difficult to size accurately.

Two Different Approaches

Instrument manufacturers developed two different solutions. Some extend measurements below the instrument’s practical detection limit. They estimate particle sizes beyond the theoretical sizing limit, sometimes down to 10 nm. This approach introduces uncertainty. In some cases, it produces incorrect results.

Other manufacturers measure the polarization properties of scattered light. Beckman Coulter pioneered this method through Polarization Intensity Differential Scattering, or PIDS. This patented technique uses polarization to extract additional particle size information.

How Polarization Improves Particle Sizing

Vertically polarized light and horizontally polarized light create different scattering patterns for small particles. These patterns contain subtle structural differences.

Horizontally polarized scattering intensity, Ih, reaches a minimum near 90 degrees. Larger particles shift this minimum toward higher scattering angles. Vertical scattering intensity, Iv, changes only slightly for very small particles. However, the difference between Iv and Ih reveals clearer structural features.

This additional information makes small particle sizing possible. The technique combines polarization effects with wavelength dependence at large scattering angles. Together, these methods extend the practical sizing limit to approximately 10 nm. This performance approaches the theoretical limit of laser diffraction.

Understanding the PIDS Signal

Very small particles behave differently from larger particles when light strikes them. The light’s oscillating electric field induces an oscillating dipole within each particle. Electrons move back and forth while the particle remains stationary.

The electron motion follows the electric field direction. This direction stays perpendicular to the light’s propagation. The oscillating dipole then radiates light in almost every direction. It does not radiate along the oscillation direction. A detector positioned along that direction receives no scattered light from a single dipole.

Changing the light polarization changes the scattering intensity. Vertically polarized light produces Iv. Horizontally polarized light produces Ih. The difference between these values, Iv minus Ih, forms the PIDS signal.

How Particle Size Changes the Signal

Larger particles no longer behave like simple dipoles. Internal interference changes their scattering behaviour. Their scattering patterns become increasingly complex.

Small particles produce a PIDS signal that resembles a quadratic curve centred near 90 degrees. Larger particles shift this pattern toward smaller angles. They also create additional peaks through scattering effects.

Particle size and light wavelength both influence the PIDS signal. Measuring several wavelengths therefore provides additional particle size information. This extra information improves particle size distribution calculations.

Multiple Wavelengths Improve Accuracy

Figure 4 shows how particle size changes the PIDS response. The figure highlights both peak movement and contrast changes. It includes particles measuring 100 nm and 50 nm. Their angular scattering patterns remain distinguishable. Their symmetry axes also shift with particle size.

Longer wavelengths produce flatter PIDS signals. Measuring several wavelengths therefore captures additional scattering information. This information refines the particle size retrieval process.

Theoretical simulations and experimental studies support these observations. Conventional scattering intensity measurements struggle below approximately 200 nm. Adding polarization makes accurate sizing practical. Combining wide angular measurements, multiple wavelengths, and polarization greatly improves submicron particle characterization.

Practical Results

Figure 5 shows a trimodal particle size distribution measured with the PIDS technique. The experiment used wavelengths of 475, 613, 750, and 900 nm. It also measured scattering angles up to 144 degrees.

The solid line represents results that include polarization effects. The dashed line excludes polarization effects. The dotted lines show the nominal latex particle diameters supplied by the PSL manufacturer.

The measurement without PIDS misses the smallest particle population. This limitation remains despite using short wavelengths and large scattering angles. Figure 6 confirms the result with an SEM image. The image clearly shows three distinct particle sizes.

Summary

Accurate measurement of particles down to approximately 10 nm requires three complementary approaches. The instrument must measure over a wide angular range. It must also use multiple wavelengths and polarization effects.

PIDS does not combine unrelated measurement techniques. Every signal originates from the same light scattering process. The software processes all signals together within a single retrieval algorithm. The system therefore performs one integrated laser diffraction measurement instead of combining separate technologies.

Continue reading

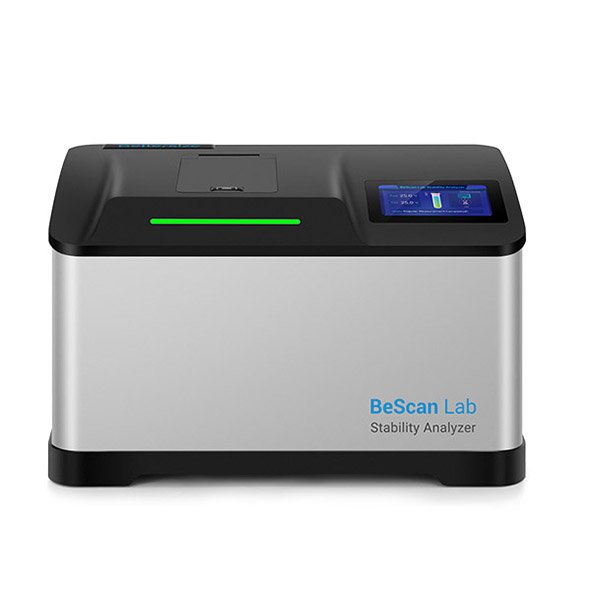
BeScan Lab

BeScan Lab Stability Analyser

Bettersize BeScan Lab

Stability Analyser

  • Particle  range 0.01 to 1,000 μm
  • Non-destructive stability analysis
  • Quantification of destabilisations and study of kinetics

Download
brochure
   Request
quote

BeScan Lab Stability Analyser

BeScan Lab, the versatile, sensitive, and reliable stability analyser based on Static Multiple Light Scattering (SMLS) technology, is widely used in the formulation development and product quality control. It accommodates a wide range of sample concentrations up to 95% v/v and types such as emulsions, suspensions, and foams, with temperature scanning capabilities reaching up to 80 °C. BeScan Lab provides both qualitative analysis and quantification of destabilisation, helping you monitor long-term product stability and achieve optimal shelf life.

Features and Benefits

● Real stability analysis for dispersions with volume fraction up to 95%

● Particle size measurement range from 0.01 to 1,000 μm

● Non-destructive stability analysis: Non-contact, non-dilution, non-shearing

● 20 µm resolution data acquisition enables quicker sample stability observation than the naked eye

● Temperature control up to 80 °C to accelerate destabilisation

● Identification of various unstable phenomena: creaming, sedimentation, flocculation, coalescence, and phase separation

● Quantification of destabilisations and study of kinetics

  • Key Features

    What BeScan Lab Provides? 

    • lnstability index (lus)
    • Mean particle size
    • Hydrodynamic analysis
    • Radar chart for regional lus
    • Temperature trend testing
    • Particle migration rate

    Why You Need It? 

    From Raw Materials to Finish

    BeScan Lab plays a crucial role throughout the product lifecycle, supporting formulation, production, and pre-use stages. It enables formulation optimization, quality control during manufacturing, investigation into optimal transportation and storage conditions, and research on redispersibility

    1. Research and development

    Ensure excellent dispersibility and uniformity through raw material selection.

    2. Production and quality control

    Optimize production processes, including method, time, and temperature, to enhance efficiency.

    3. Storage and transportation

    Evaluate formulation stability under varying environmental conditions, observing destabilization, and predict shelf life.

    4. Pre-use treatment

    Study the reversibility of destabilization and compliance with usage standards.

    Features & Benefits

    Non-destructive stability analysis for various dispersions

    • Non-contact, non-dilution, non-shearing 
    • Sample volume fraction up to 95%
    • Particle size measurement range from 0.01 to 1,000 μm

    Fast and direct stability measurement

    • The high-performance LED and ultra-sensitive detectors, with a 20-micron scan step, allow real-time monitoring and capture of subtle variations 200 times faster than the naked eye
    • Temperature control up to 80 °C to accelerate destabilization

    Qualitative and quantitative stability results

    • Identification of various unstable phenomena, such as creaming, sedimentation, flocculation, coalescence, and phase separation
    • Quantification of destabilizations and study of kinetics


    Advanced Measurement Principle 

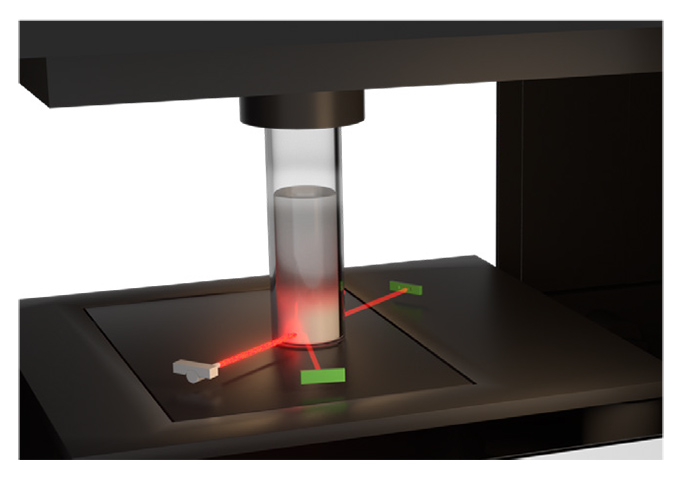
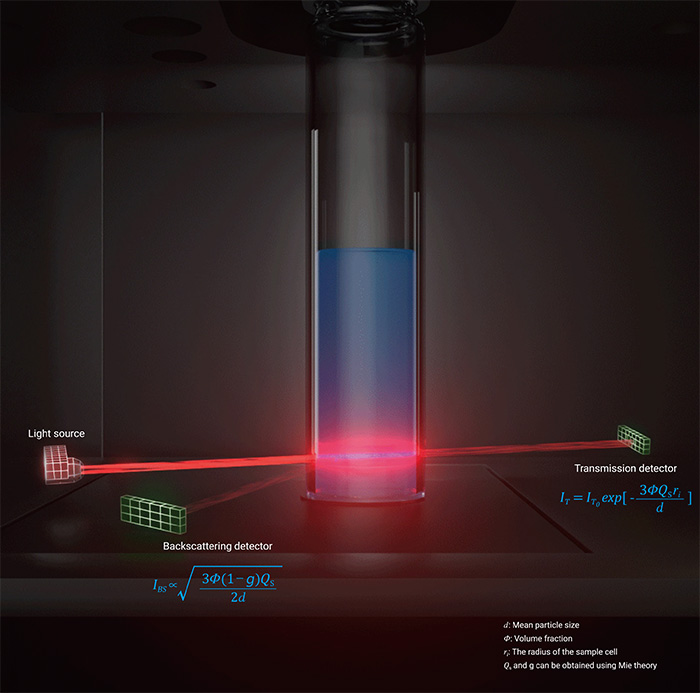
    Static Multiple Light Scattering (SMLS) is employed to characterize the stability of dispersions. Within BeScan Lab, a setup comprising two detectors and an LED light source ascends along the sample cell to conduct sample scanning. In the case of concentrated samples, the backward detector is employed to detect backscattered signals, while for diluted samples, the forward detector is utilized to detect transmitted signals.

    how-BeScan-Lab-woks

    Versatile Applications 

    • Agrochemicals

    Evaluate the stability of pesticide formulations to predict shelf life and ensure the consistent performance of suspension systems.

    • Battery and Energy

    Test the stability of electrode materials and electrolytes, crucial for enhancing battery performance and lifespan.

    • Ceramics

    Analyze the stability of ceramic slurries and monitor the stability of glazes and pigments, ensuring reliable production processes.

    • Home and Personal Care

    Ensure product stability in cosmetics, lotions, creams, and other formulations for reliable performance.

    • Food and Beverage

    Test the stability of food products, from milk to sauces, and assess the dispersibility of food powders to maintain product quality.

    • Petrochemicals

    Monitor and ensure the stability of oil products, providing critical insights into the long-term performance of lubricants and the behavior of polymers in oil.

    • Pharmaceuticals

    Conduct stability testing for medicinal formulations, assess long-term drug stability, and analyze biomacromolecule aggregation to ensure product efficacy.

    • Paints, Coatings and Inks

    Measure the stability of coatings and inks, and evaluate the dispersion of pigments and dyes for uniform product quality.

  • Technology

    Static Multiple Light Scattering  

    Static Multiple Light Scattering (SMLS) is an optical technique used to directly characterize native concentrated liquid dispersions. This technique emits light into the sample, where it is scattered multiple times by particles or droplets before being detected.

    BeScan Lab applies SMLS using an 850 nm LED as light source, with detectors set at 0° for capturing transmitted light and at 135° for backscattered light. This setup scans the sample vertically, analyzing the transmitted light for transparent systems, while the backscattered light is ideal for opaque systems.

    The signals are collected at 20 μm intervals, which enables precise observation of changes in size (d) and concentration (Φ) of suspended materials.

    Signal display

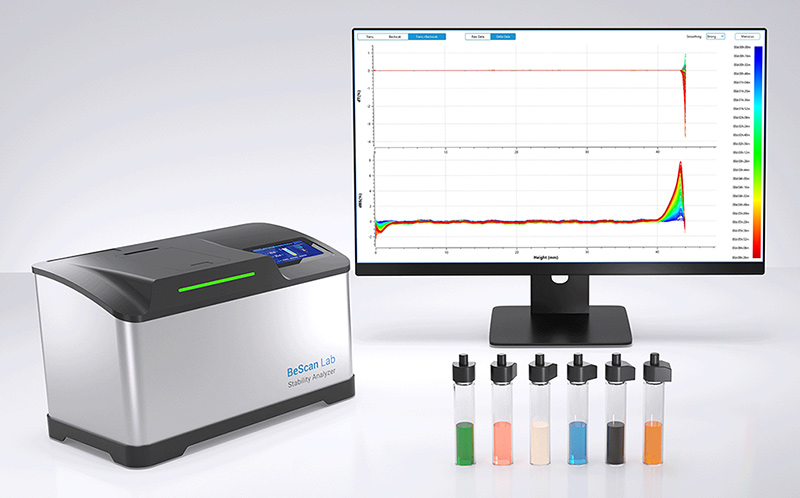
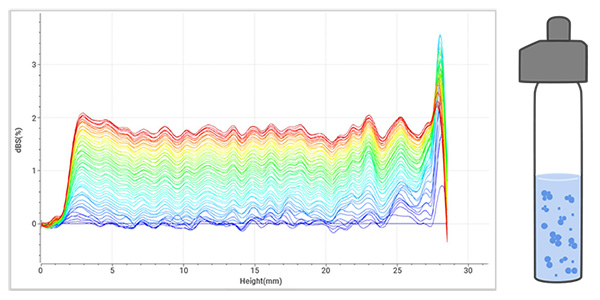
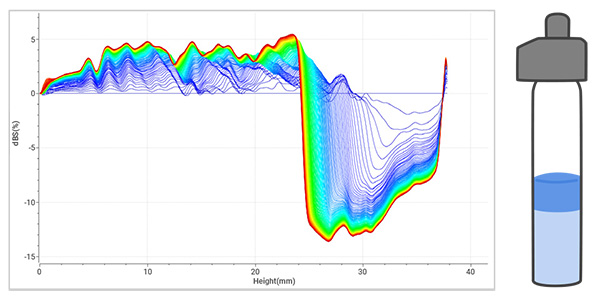
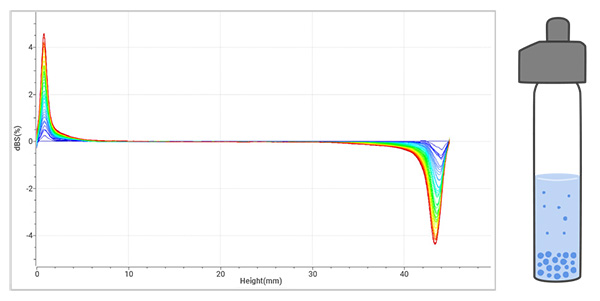
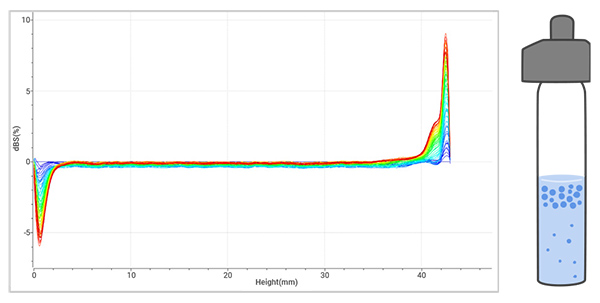
    Customized scanning procedures allow presentation of scans with different colors corresponding to different scanning times. The overlap of scans demonstrates how signals diverge from the reference as they vary with height and time. Intuitively, the scans capture local changes that characterize unstable phenomena.

    BeScan-Lab-Signal-display


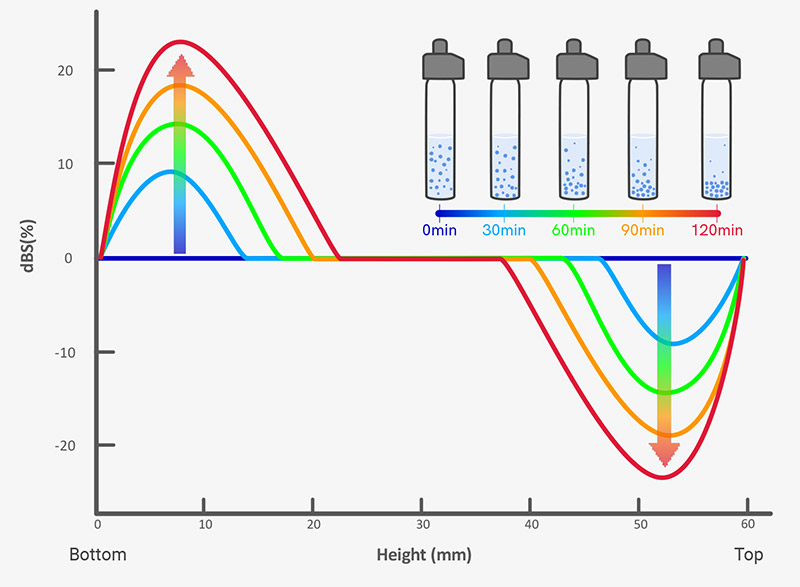
    The example illustrates that during sedimentation, the backscattered signals (dBS) undergo a distinctive pattern of change: a decrease at the top and an increase at the bottom, which is attributed to the migration of particles.

    Features

    • Versatile measurement

    No limitations on color or viscosity, and suitable for a wide range of samples from low to high concentrations (up to 95% v/v).

    • Non-destructive and in situ 

    Measures without preparation, thus preserving the sample’s original characteristics.

    • Wide particle size range

    Capable of measuring particles from 0.01 to 1,000 μm.

    • Applicable to various systems

    Suitable for emulsions, suspensions, foams, and other dispersions, providing robust and high-resolution measurements.

    BeScan-Lab-Measurement-Principle

  • Software

    Dedicated Software 

    for Superior Qualitative and Quantitative Stability Outcomes

    Qualitative Analysis – Identification of Destabilisation

    BeScan Lab utilises near-infrared light and a precise 20-micrometer spatial resolution to detect early-stage destabilisation phenomena like phase separation, sedimentation, creaming and aggregation (flocculation, coalescence, and coagulation) well before they are visually observable.

    1. Flocculation often results in uniform changes in transmitted or backscattered signals across the entire sample height.

    • Common in wastewater treatment, electrode slurries, and drilling fluids.

    Data-results-of-Flocculation-analyzed-by-BeScan-Lab

    2. Phase separation typically involves evolving interfaces between phases over time.

    • Common in paints and coatings, cosmetics.

    Data-results-of-Phase-separation-analyzed-by-BeScan-Lab

    3. Sedimentation causes a decrease in backscattered signals at the top and an increase at the bottom in opaque samples.

    • Common in slurries, pigments, pesticides, vaccines, and body lotions.

    Data-results-of-Sedimentation-analyzed-by-BeScan-Lab

    4. Creaming in opaque samples enhances backscattered signals while lowering bottom signals.

    • Common in milk-based beverages, lipid emulsions, and pesticides.

    Data-results-of-Creaming-analyzed-by-BeScan-Lab

    Quantitative Analysis – Instability Index for Rating Guide

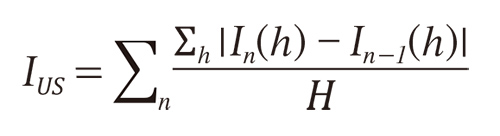
    BeScan Lab provides the instability index (IUS), which quantifies the stability of dispersions. The calculation involves summing all signal variations across the entire sample height and over time, capturing all subtle variations within the sample. This facilitates sample comparison, as a greater instability index (IUS) indicates lower stability. An instability index is automatically calculated after every scan using the following formula:

    instability-index-formula

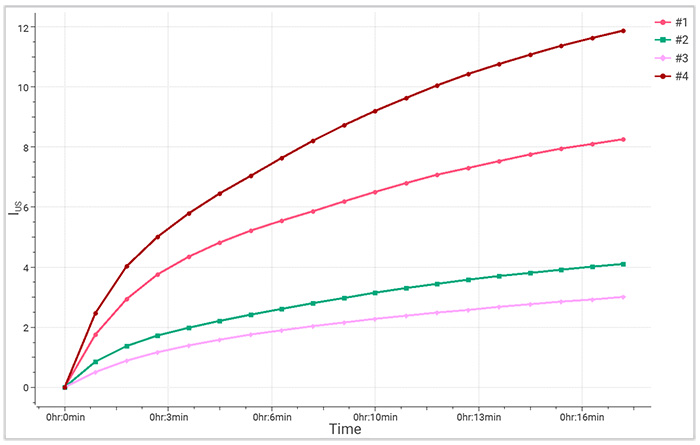
    BeScan Lab offers instability indices over time to compare the stability of different samples. A slower increase in the instability index indicates higher dispersion stability, resulting in a flatter curve. Analysing the trend allows for predicting long-term stability.

    Time-dependent-instability-index

    Time-dependent instability index

    1. Phase separation dynamics and mean particle size

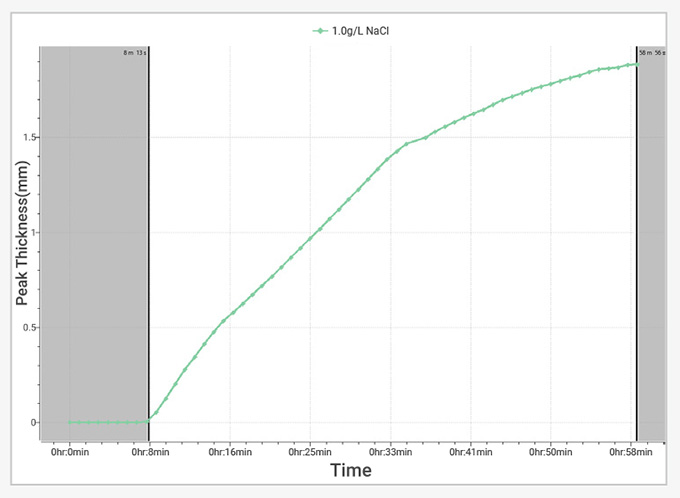
    Hydrodynamic analysis reveals layer thickness and particle migration rate over time, thereby determining the hydrodynamic mean diameter.

    Phase-separation-dynamics-and-mean-particle-size

    2. Optical analysis and mean particle size variation

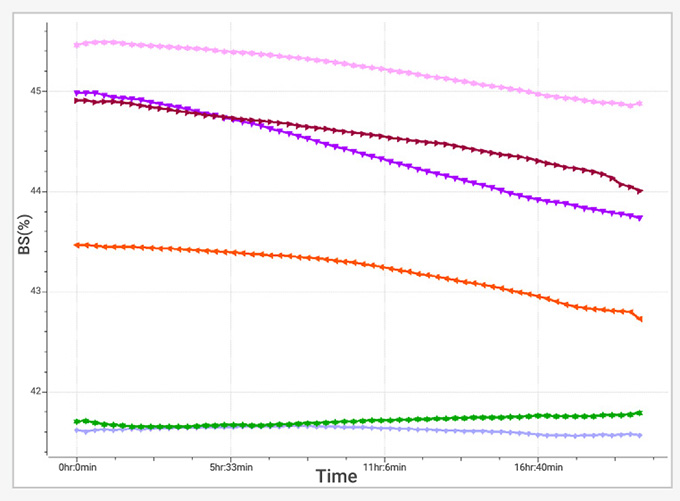
    Particle size variation analysis is achievable with BeScan Lab, correlating transmitted and backscattered light signals.

    Optical analysis and mean particle size variation Particle size variation analysis is achievable with BeScan Lab, correlating transmitted and backscattered light signals.

    3. Temperature trend measurement

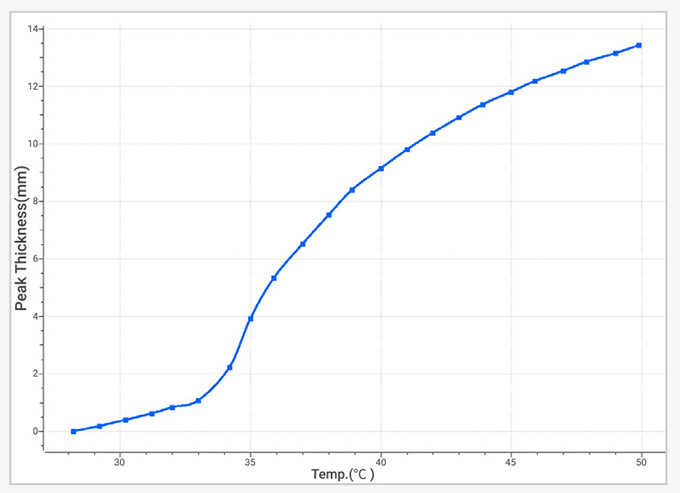
    Programmable temperature trend measurement up to 80°C, which explores stability under extreme conditions and accelerates destabilisation.

    Temperature-trend-measurement

    4. Radar chart

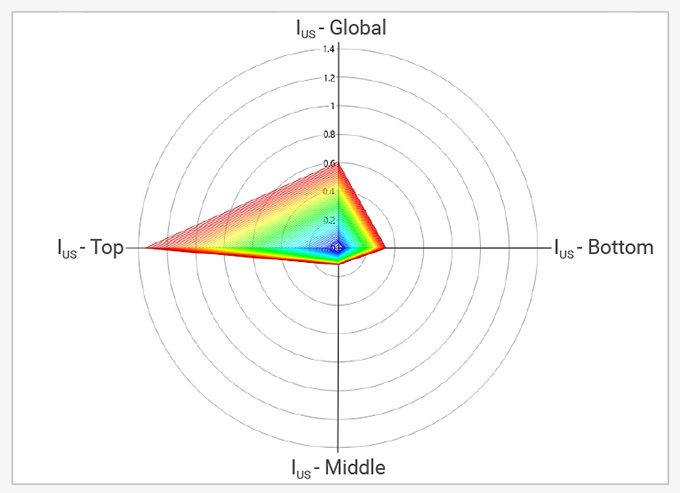
    Global and regional instability indices for each scanning are illustrated in form of a radar chart, intuitively providing a way to investigate regional stability (top, middle, and bottom).

    Radar-chart

  • Specification

    Parameters Values
    Measurement principle SMLS (Static Multiple Light Scattering)
    Detection angle 0° transmission and 135° backscattering
    Light source 850 nm LED
    Scan step 20 μm
    Scan height 0 – 60 mm
    Number of samples 1
    Maximum volume fraction* 95%
    Measurement range of particle size 0.01 – 1000 μm
    Temperature range RT – 80 ℃ (±0.5 ℃ )
    Sample volume 4 – 25 mL
    Measurement mode Regular/Fixed point/Temp. trend
    Dimension 460(L) x 260(W) x 280(H) mm
    Weight 13.5 kg
    Power AC100 – 240 V, 50 – 60 Hz, 3.8 A
    ISO compliance

    ISO/TR 18811:2018, ISO/TR 13097:2013

    ISO/TR 21357:2022, ISO/TS 22107:2021

     * Sample and sample preparation dependent

  • Applications

    3D Printing Slurry

    Detergent

    Dispersant

    Electrode Slurry

    Ibuprofen

    Pestiside

    Beer Foam

Not sure if it’s the right instrument?

No worries, send us a sample and we will test it for you


Send a sample

Continue reading

BeVision D3 Series

BeVision D3 Series Particle Size and Shape Analyzer

Bettersize Instruments
BeVision D3

Particle Size and Shape Analyser 

  • Expanded measurement range 0.5 μm – 26 mm
  • 37+ different particle size and shape parameters
  • Dry powder image analysis

Download
brochure
   Request
quote

BeVision D3 Series Particle Size and Shape Analyzer

For big improvements that help you spot small differences.

The BeVision D3 Series Particle Size and Shape Analyser is an advanced, fully automated analyser based on Dynamic Image Analysis (DIA) technology. It delivers highly accurate particle size and shape characterisation, making it an ideal solution for both research and quality control applications.

  • Key Features

    • Wide measuring range: 0.5 μm – 26 mm
    • 37+ different particle size and shape parameters
    • High efficiency with a typical test time of ~3 minutes
    • Ultra-high resolution for narrow particle size distributions
    • Compliance with ISO 13322-2 and ISO 9276
      Fully automated operation
    • Powerful software provides a comprehensive evaluation
    • Results fully comparable with sieve analysis
  • Technology

    Dynamic Image Analysis (DIA) Technology

    The BeVision D3 Series employs advanced Dynamic Image Analysis (DIA) technology to deliver fast, accurate, and reproducible particle size and shape measurements.

    During analysis, dispersed particles pass through a precisely defined detection zone. Uniform background illumination across the entire field of view creates high-contrast particle projections, which are captured in real time by a dual high-speed camera system. One camera focuses on coarse particles, while the other simultaneously captures fine particles, enabling complete size and shape distribution analysis across a wide measurement range in a single run. 

    Why DIA Method?

    Dynamic Image Analysis (DIA) combines the strengths of traditional and modern particle characterization techniques while eliminating their limitations. By analyzing individual particles in motion, DIA delivers accurate, representative, and reproducible results for both particle size and shape—across a wide measurement range.

    Dynamic Image Analysis vs Traditional Methods
    Features Dynamic Image Analysis  Sieve Analysis Static Image Analysis
    Wide measurement range ●●● ●● ●●
    Repeatability & Reproducibility ●●● ●● ●●
    High-resolution for narrow distributions ●●● ● ●●●
    Accuracy for broad distribution ●●● ● ●
    Representative results ●●● ●●● ●
    Particle morphology analysis ●●● ● ●●●
    Comparable with other technologies ●● ● ●
    Oversize particle detection ●● ●●● ●
    Individual particle analysis ●● ● ●●●
    Ease and speed of measurement ●●● ● ●

    Dual-CMOS Camera System

    The dual-camera design allows simultaneous measurement of coarse and fine particles. This unique configuration provides comprehensive distribution information for wide-range samples with a single measurement, significantly improving efficiency and data integrity.

    5-Megapixel CMOS Camera

    Each camera is equipped with a global shutter, enabling sharp, blur-free imaging of fast-moving particles. High pixel resolution ensures precise contour detection and accurate size and shapeanalysis. 

    Green Parallel Planar Light Source

    A uniform green planar light source ensures stable illumination across the entire field of view and consistent gray values in particle images. This simplifies image binarization and enhances measurement accuracy and repeatability.

    Blue Light Source for Fine Particles

    A dedicated blue light source delivers higherresolution imaging for fine particles, enhancing edge definition and ensuring clear capture of fine particle characteristics.

    BV-F10 Free Fall Dispersion Unit

    The BV-F10 Free Fall Dispersion Unit features patented dispersion technology designed for uniform and gentle dispersion of freeflowing powders and granules. By leveraging gravity-driven free fall, it ensures highly representative particle presentation without mechanical stress or particle damage. 

    Modular & Plug-and-Play Design

    The BV-F10 features a modular, plug-and-play architecture with full software integration. All dispersion parameters are automatically controlled through the system software, enabling fast setup, consistent results, and excellent repeatability.

     
    Samples are loaded into the funnel, where particles are metered and conveyed by a vibrating chute. The particles then pass through adjustable guide slots and fall freely through the detection zone under gravity. After measurement, all particles are collected in the recovery tray, ensuring complete sample recovery

    Features & Benefits

    • Fully software-controlled adjustments
      Funnel height, chute feeding rate and guide slot spacing are adjustable automatically via software.
    • Optimized particle dispersion
      The beveled chute end redirects particles for uniform dispersion across the detection zone.
    • Controlled particle flow thickness
      Adjustable guide slots control particle flow thickness, minimizing out-of-focus and particle overlap. 
    • Intelligent feeding rate control
      The software dynamically regulates the feeding rate during measurement to ensure optimal dispersion, efficiency and repeatability.
    • 100% sample recovery
      All particles are collected after measurement, making the system ideal for valuable or limited samples.
    BV-F10

    Accessories of the BV-F10

    Low-friction chute
    Designed for non-spherical and irregular powders
    High-friction chute
    Optimized for spherical granules such as glass beads
    150 ml funnel 450 ml funnel
    Expansion cylinder

    Specialized Calibration Unit

    The Specialized Calibration Unit is designed for accurate calibration and verification of the DIA imaging system, ensuring long-term measurement reliability and compliance.

    Features & Benefits

    • 2-in-1 functionality
      Used for both system calibration and performance verification.
    • Metrology-certified accuracy
      Certified by the National Institute of Metrology, ensuring traceable and reliable results.
    • High precision
      Measurement accuracy up to 1μm.
    • Simple and user-friendly operation
      Quick setup and intuitive use for routine verification.
    • Automatic report generation
      Software-generated calibration and verification reports support convenient annual verification and audit readiness.
  • Applications

    Typical Applications

    BeVision D2 Applications


    Application Cases

    Based on its wide measuring range, direct measurement principle, and broad compatibility with diverse sample types, the BeVision D3 Series can be widely used in many industries ranging from research to quality control, providing in-depth insights into particle analysis.

    1. Excellent Repeatability

    Example: Glass beads
    Glass bead particles are characterized in terms of length, diameter, and curvature. The measurement results closely align with intuitive visual assessments, confirming the accuracy and relevance of DIA-based morphology analysis.
      D10 D50 D90
    Mean /μm 994.74 1056.32 1112.13
    Std. Dev /μm 0.39 0.43 0.76
    Repeatability 0.04% 0.04% 0.07%
           
     
    Example: Cracked Soybeans
    Even for cracked soybean particles with wide size distributions and highly irregular shapes, the repeatability of D50 remains better than 0.5%, confirming reliable performance for real-world samples.
      D10 D50 D90
    Mean /μm 994.74 1056.32 1112.13
    Std. Dev /μm 0.39 0.43 0.76
    Repeatability 0.04% 0.04% 0.07%


    2. Comprehensive Particle Size & Shape Analysis

    The BeVision DIA Software provides 37+ particle size and shape parameters, enabling thorough characterization and objective evaluation of diverse particle morphologies.

    Example: Petroleum catalyst
    Rod-like catalyst particles are characterized in terms of length, diameter, and curvature. The measurement results closely align with intuitive visual assessments, confirming the accuracy and relevance of DIA-based morphology analysis.

    3. Accurate Determination of Low-Content Oversize Particles

    By leveraging advanced digital imaging technology and highspeed image capture, BeVision D3 Series achieves ultra-high detection efficiency. Even oversize particles present at extremely low concentrations can be accurately identified and quantified.

    Example: Colorants
    Over 1 million colorant particles were analyzed within 6 minutes. The resulting size distribution revealed a small fraction of oversize particles, and captured images confirmed that each oversize particle was an agglomerate composed of multiple smaller colorant particles.
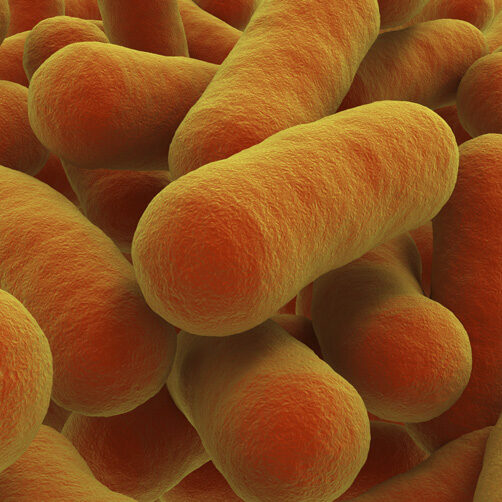
    4. Ultra-High Resolution for Narrow Distributions

    The BeVision D3 Series analyzes every individual particle captured during measurement and performs statistical analysis across the full particle population, achieving single-particle resolution.

    Example: Abrasives
    In abrasive materials, both oversize and undersize particles can negatively affect grinding performance. The BeVision D3 Series precisely quantifies the content of oversize and undersize particles, while also providing particle shape analysis to evaluate abrasive sharpness.

    5. Mixture Analysis

    The BeVision DIA Software is a powerful data analysis platform that enables separation and analysis of mixed particle systems. Particle mixtures can be classified and filtered based on size, shape, or multiple parameters, allowing each fraction to be analyzed independently within a single dataset.

    Example: Beans
    Direct measurement of mixed beans produces a bimodal particle size distribution (PSD). The smaller peak corresponds to mung beans, while the larger peak represents red beans. By applying size-based filtration, the software separates red beans and mung beans from the mixed dataset, enabling independent analysis of each component without additional measurements.

    6. Fully Comparable with Sieving Results

    The BeVision D3 Series uses a sieve-equivalent diameter aligned with the fundamental principles of sieving, delivering particle size distributions (PSD) that are highly consistent with traditional sieve analysis. Its dedicated sieve correlation function automatically compensates for systematic differences related to measurement principles, particle shape and statistical effects, and directly outputs sieving-correlated PSD results.

    Example: Fertilizer
    PSDs measured by the BeVision D3 show excellent agreement with sieve analysis results. Users can switch seamlessly from mechanical sieving to the BeVision D3 system, significantly improving testing efficiency while reducing labor costs.

    7. Thickness Measurement of Flaky Particles

    The BeVision D3 Series is capable of capturing crosssectional images of flaky particles during measurement, enabling automatic and direct thickness measurement.

    Example: Soybean meal
    The thickness of the flaky soybean meal residue after pressing directly reflects the residual oil content. Conventional thickness measurement relies on manual caliper measurements of individual particles, resulting in extremely low efficiency and poor representativeness.
    The BeVision D3 system automatically measures and outputs the thickness distribution and mean thickness, significantly improving measurement efficiency, repeatability, and statistical reliability
  • Application Notes

    Application

    Application

    Application

    Application

    Application

    Application

    Application

    Application

    Application

    Application

  • Specifications

    Parameter BeVision D3  BeVision D3 Macro BeVision D3 Pro
    Measurement Principle DIA DIA DIA
    Optical System Single-lens system Single-lens system Dual-lens system
    Measurement Range 11.5 μm — 16 mm 20 μm — 26 mm 0.5 μm — 16 mm
    CMOS Camera 5 megapixels 5 megapixels  5 megapixels per camera
    Light Source Green parallel planar light  Green parallel planar light  Basic system: green parallel
    planar light
    Zoom system: blue light
    Repeatability (D50 of standards) ≤ 0.5 % ≤ 0.5 % ≤ 0.5 %
    Result Output Format
    Charts: Excel / TXT / JPG / BMP  Reports: PDF / Excel
    Recommended Sample Amount
    < 20 mg – 200 g (sample type dependent)
    Typical Test Time
    3 minutes (sample dependent)
    Dimensions (L × W × H)
    686 mm × 300 mm × 325 mm
    Weight
    24 kg
    Power Supply
    100-240 VAC, 50/60 Hz
    Conformity
    ISO 13322-2, ISO 9276
    Computer Configuration
    Intel ® Core™ i9 (14th gen), 32 GB RAM, 64-bit Windows 11, 1 TB SSD 
    Accessories of the BV-F10
    Funnels
    150 ml stainless steel funnel, 450 ml stainless steel funnel expansion cylinder
    Chutes
    High-friction stainless steel chute, low-friction stainless steel chute

Not sure if it’s the right instrument?

No worries, send us a sample and we will test it for you


Send a sample

Continue reading

Performing Zeta Potential Measurements

BeNano 180 Zeta Pro Nanoparticle Size and Zeta Potential Analyser Meritics Ltd Bettersize

Performing Zeta Potential Measurements

The electro-kinetic potential of colloids is known as its zeta potential. This is the difference in charge repulsion/attraction between mobile particles in a dispersion fluid, and the stationary layers of ions which have attached to the surfaces of insoluble nanoparticles dispersed throughout the medium.

Zeta potential measurement is performed by dispersing nanoparticles in a liquid medium of varying pH levels, and applying an electrical field throughout the colloid. Using dynamic light scattering (DLS) equipment, it is possible to observe the nanoparticle’s motion (velocity) and interaction with ions in the dispersive medium. Charged dispersion particles will form a series of layers on the surface of the nanoparticle, collectively known as the electrical double layer, which comprises an initial skin of charged ions and a secondary diffuse outer layer. As the nanoparticle moves through the dispersion, the particles attached in these layers exhibit different electrostatic properties to those particles forming the bulk of the dispersion fluid.

This electro-kinetic activity is significant in the characterization of product stability, providing insights into the formulations of emulsions and aiding product optimization through rapid and accurate assessments of additive success.

Applications for Zeta Potential Measurement

Zeta potential measurement is a significant particle analysis method in particle aggregation studies and the establishment and optimization of emulsion short and long-term physical stability.

Zeta potential measurement has shown that dispersions with a charge close to zero – whether exhibiting a positive or negative charge – tend to yield shorter shelf-lives, with an inclination towards coagulation or flocculation of emulsions. Conversely, emulsions with a surface activity greater than ~ +/- 30mV are inclined towards improved system stability and low aggregation.

Zeta potential measurement is therefore an important consideration for the accurate establishment and forecasting of product shelf lives, particularly as a screening method for the control of repeated batch consistency.

Particle analysis such as zeta potential measurement is increasingly important in the food and beverage sector, where mass-production and packaging of food and beverages for worldwide sales must meet stringent mandatory compliance criteria and performance standards. End products must consistently deliver on taste and texture, they must be reproduceable on large scales, and they must advertise accurate shelf lives for safe human consumption. Zeta potential measurement can not only provide accurate data towards shelf-life forecasting, it can aid in research of potential additives to improve zeta potential, thereby increasing product stability.

Zeta Potential Management Products from Meritics

Meritics are particle size and zeta potential measurement experts, providing services and instruments to academic and commercial sectors alike, where precise and consistent measurements are fundamental to achieving repeatable results for studies or for the manufacture of consumer products.

Meritics provide zeta potential measurement systems suitable for all levels of research, development, and manufacturing, allowing for rapid analysis of particle properties and characteristics. The Bettersize BeNano 180 Zeta Pro is a zeta potential and particle size analyser capable of simultaneous assessment of particle size and zeta potential in as little as one second, with instant results cross-checking. This accurate rapidity is crucial to the optimisation of high-quality, fast-moving consumer goods.

It is very important in measuring zeta potential that the time and level of current passing into the sample are minimised to avoid any possible damage to the sample, particularly biological materials. In the Bettersize BeNano 180 Zeta Pro from Meritics, both particle size and zeta potential are measured simultaneously, and in just a couple of seconds minimising any potential sample damage and also allowing measurements of aggregation to be made over short periods of time. To minimise the appearance of gas bubbles which can interfere with the zeta potential measurement.

If you would like any more information about our Zeta Potential measurement instruments, or any of our other products, please do not hesitate to get in touch.

Continue reading

Have questions or need support?

1. Get in Touch

Tell us about your application and particle characterisation needs.

2. Have a conversation

We're happy to set up a call to discuss your application and answer your questions.

3. Discuss next steps

Expand your knowledge with a seminar, demonstration, sample analysis, or obtain a quote.

We are here in the UK to help and
answer any questions you might have.
Call us directly on +44 1582 704807

© 2024 Meritics.com