BeVision D3 Series
Bettersize Instruments
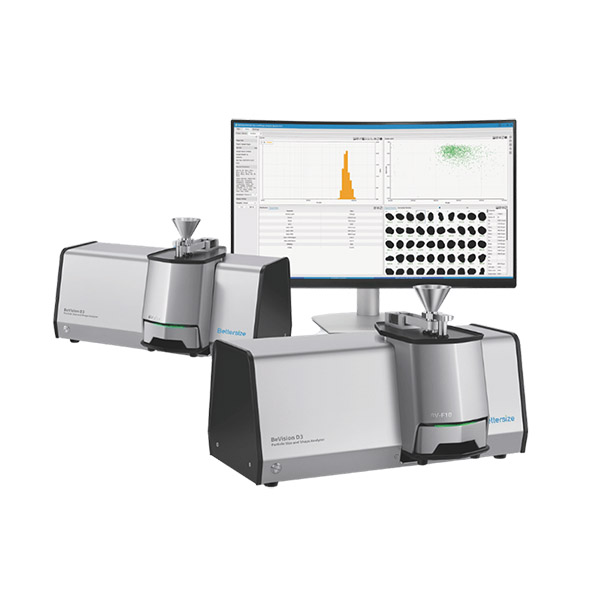
BeVision D3
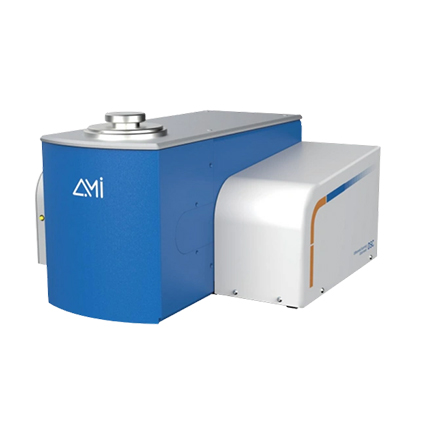
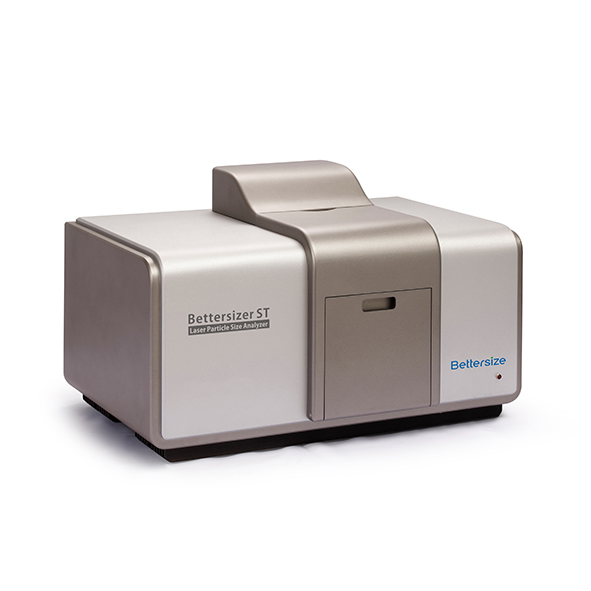
Particle Size and Shape Analyser
- Expanded measurement range 0.5 μm – 26 mm
- 37+ different particle size and shape parameters
- Dry powder image analysis

For big improvements that help you spot small differences.
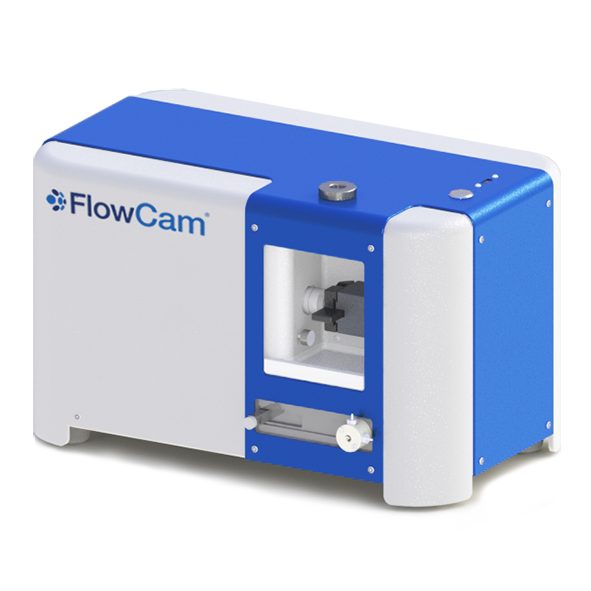
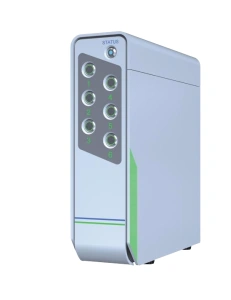
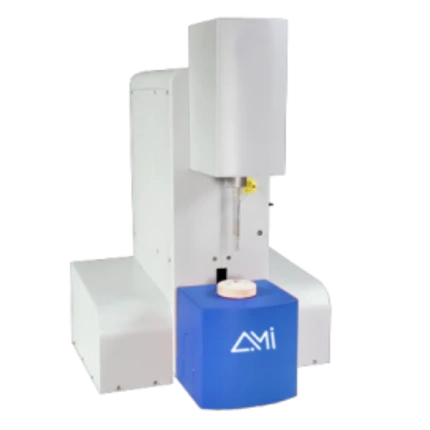
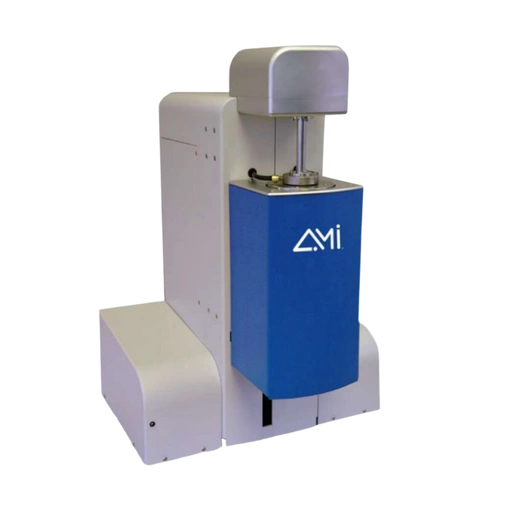
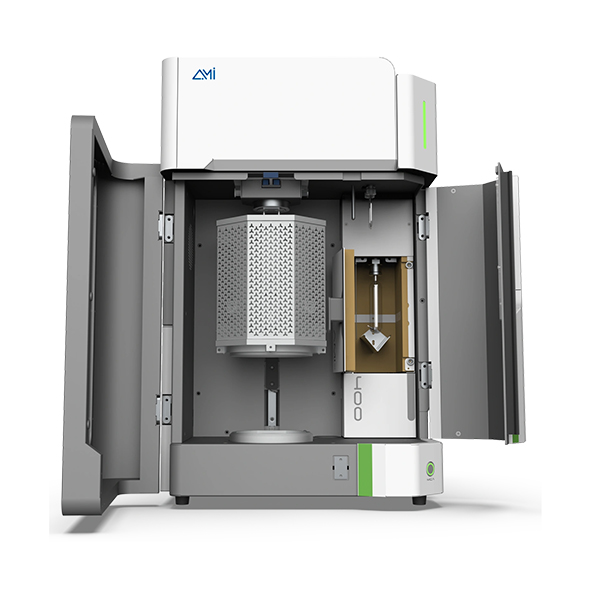
The BeVision D3 Series Particle Size and Shape Analyser is an advanced, fully automated analyser based on Dynamic Image Analysis (DIA) technology. It delivers highly accurate particle size and shape characterisation, making it an ideal solution for both research and quality control applications.
-
Key Features
- Wide measuring range: 0.5 μm – 26 mm
- 37+ different particle size and shape parameters
- High efficiency with a typical test time of ~3 minutes
- Ultra-high resolution for narrow particle size distributions
-
Compliance with ISO 13322-2 and ISO 9276
Fully automated operation - Powerful software provides a comprehensive evaluation
- Results fully comparable with sieve analysis
-
Technology
Dynamic Image Analysis (DIA) Technology
The BeVision D3 Series employs advanced Dynamic Image Analysis (DIA) technology to deliver fast, accurate, and reproducible particle size and shape measurements.
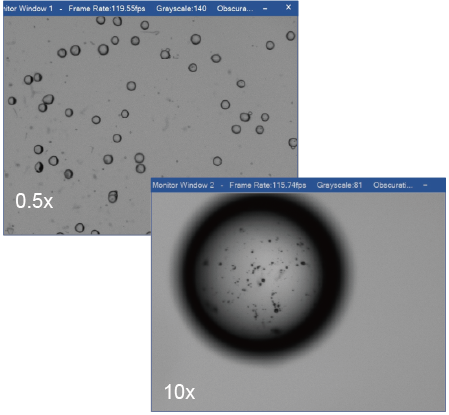
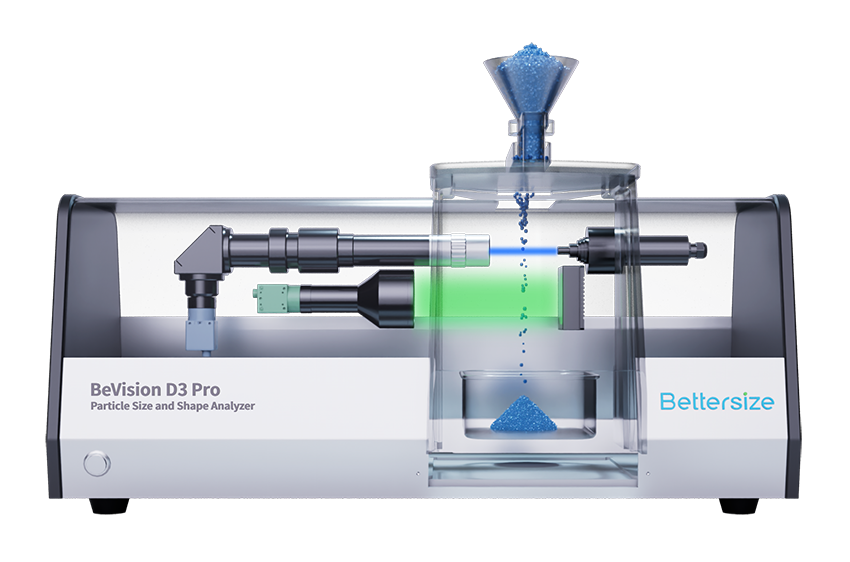
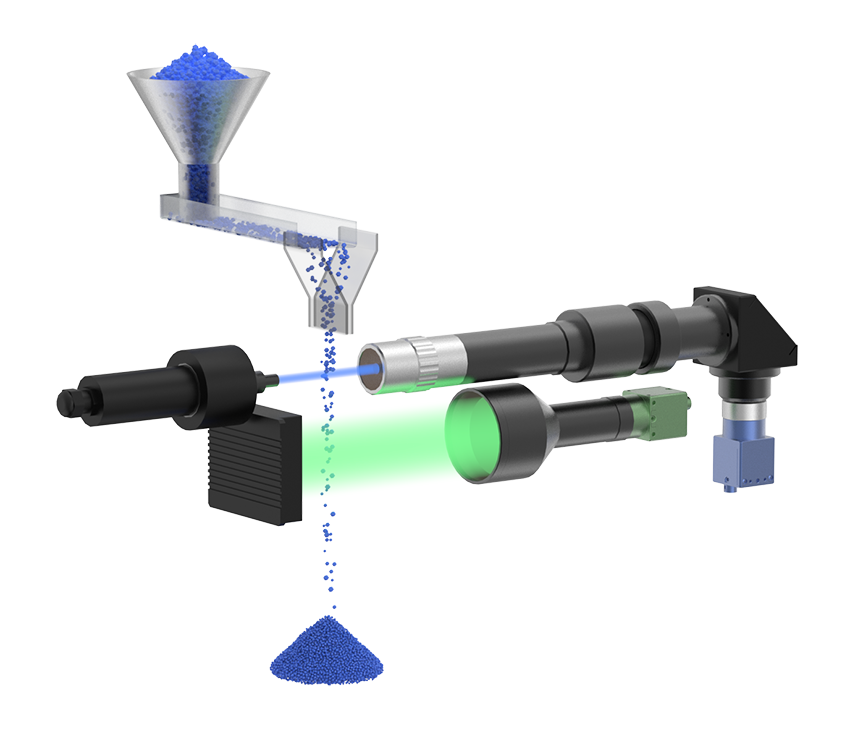
During analysis, dispersed particles pass through a precisely defined detection zone. Uniform background illumination across the entire field of view creates high-contrast particle projections, which are captured in real time by a dual high-speed camera system. One camera focuses on coarse particles, while the other simultaneously captures fine particles, enabling complete size and shape distribution analysis across a wide measurement range in a single run.

Why DIA Method?
Dynamic Image Analysis (DIA) combines the strengths of traditional and modern particle characterization techniques while eliminating their limitations. By analyzing individual particles in motion, DIA delivers accurate, representative, and reproducible results for both particle size and shape—across a wide measurement range.
Dynamic Image Analysis vs Traditional Methods Features Dynamic Image Analysis Sieve Analysis Static Image Analysis Wide measurement range ●●● ●● ●● Repeatability & Reproducibility ●●● ●● ●● High-resolution for narrow distributions ●●● ● ●●● Accuracy for broad distribution ●●● ● ● Representative results ●●● ●●● ● Particle morphology analysis ●●● ● ●●● Comparable with other technologies ●● ● ● Oversize particle detection ●● ●●● ● Individual particle analysis ●● ● ●●● Ease and speed of measurement ●●● ● ● Dual-CMOS Camera System
The dual-camera design allows simultaneous measurement of coarse and fine particles. This unique configuration provides comprehensive distribution information for wide-range samples with a single measurement, significantly improving efficiency and data integrity.
5-Megapixel CMOS Camera
Each camera is equipped with a global shutter, enabling sharp, blur-free imaging of fast-moving particles. High pixel resolution ensures precise contour detection and accurate size and shapeanalysis.
Green Parallel Planar Light Source
A uniform green planar light source ensures stable illumination across the entire field of view and consistent gray values in particle images. This simplifies image binarization and enhances measurement accuracy and repeatability.
Blue Light Source for Fine Particles
A dedicated blue light source delivers higherresolution imaging for fine particles, enhancing edge definition and ensuring clear capture of fine particle characteristics.
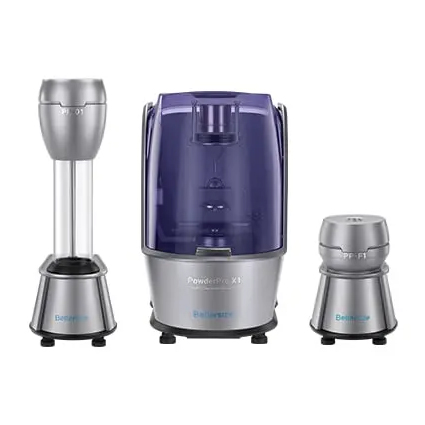
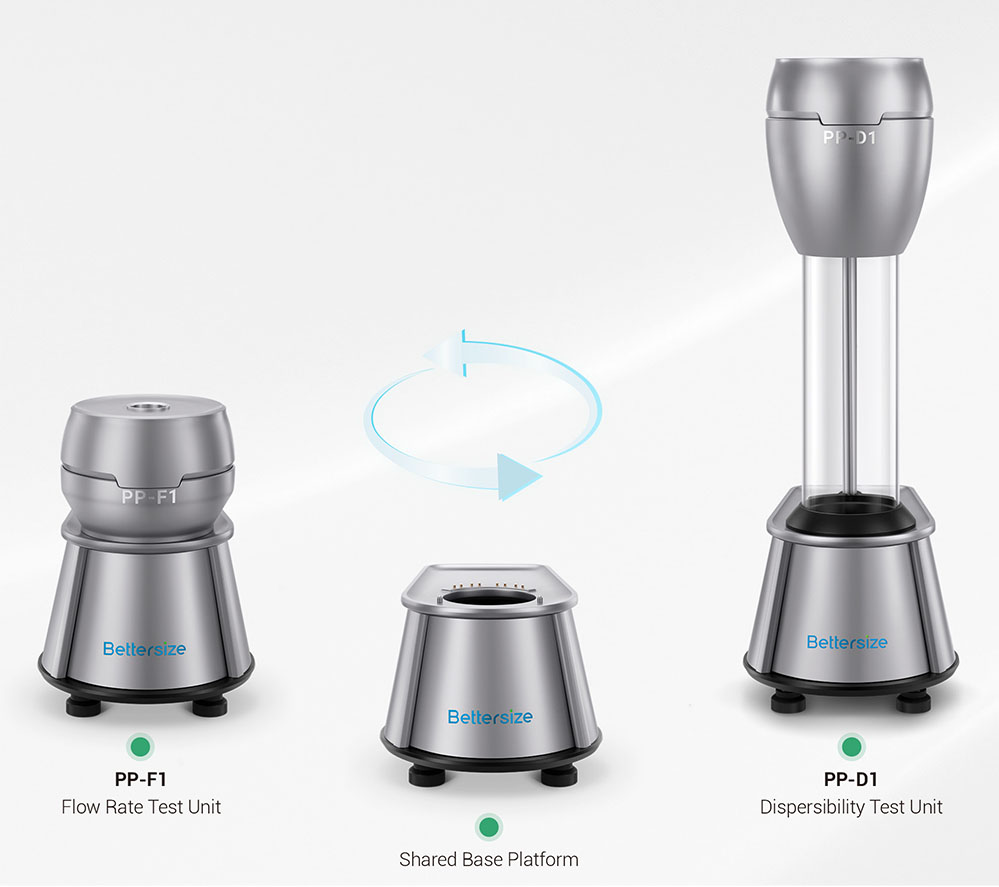
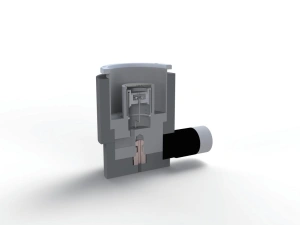
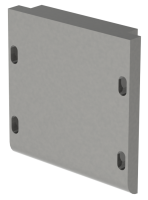
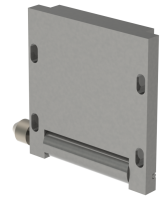
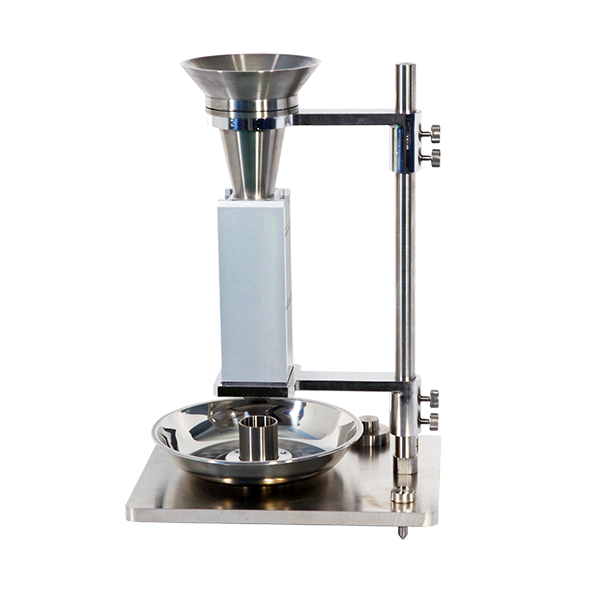
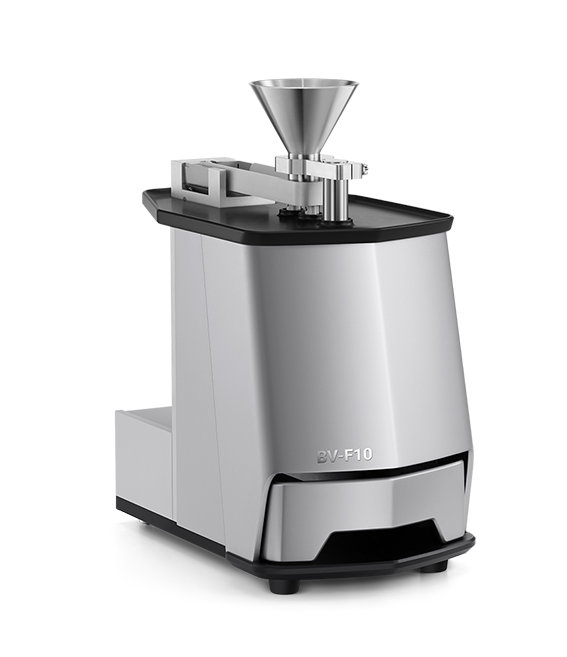
BV-F10 Free Fall Dispersion Unit
The BV-F10 Free Fall Dispersion Unit features patented dispersion technology designed for uniform and gentle dispersion of freeflowing powders and granules. By leveraging gravity-driven free fall, it ensures highly representative particle presentation without mechanical stress or particle damage.

Modular & Plug-and-Play Design
The BV-F10 features a modular, plug-and-play architecture with full software integration. All dispersion parameters are automatically controlled through the system software, enabling fast setup, consistent results, and excellent repeatability.
Samples are loaded into the funnel, where particles are metered and conveyed by a vibrating chute. The particles then pass through adjustable guide slots and fall freely through the detection zone under gravity. After measurement, all particles are collected in the recovery tray, ensuring complete sample recovery Features & Benefits
- Fully software-controlled adjustments
Funnel height, chute feeding rate and guide slot spacing are adjustable automatically via software. - Optimized particle dispersion
The beveled chute end redirects particles for uniform dispersion across the detection zone. - Controlled particle flow thickness
Adjustable guide slots control particle flow thickness, minimizing out-of-focus and particle overlap. - Intelligent feeding rate control
The software dynamically regulates the feeding rate during measurement to ensure optimal dispersion, efficiency and repeatability. - 100% sample recovery
All particles are collected after measurement, making the system ideal for valuable or limited samples.
BV-F10Accessories of the BV-F10


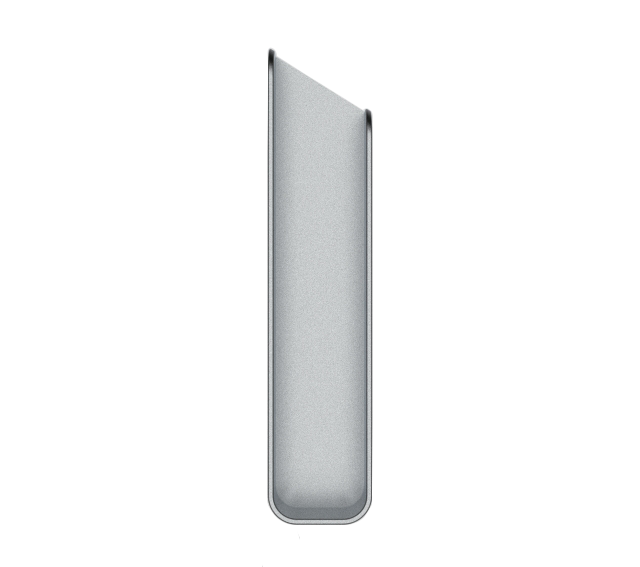
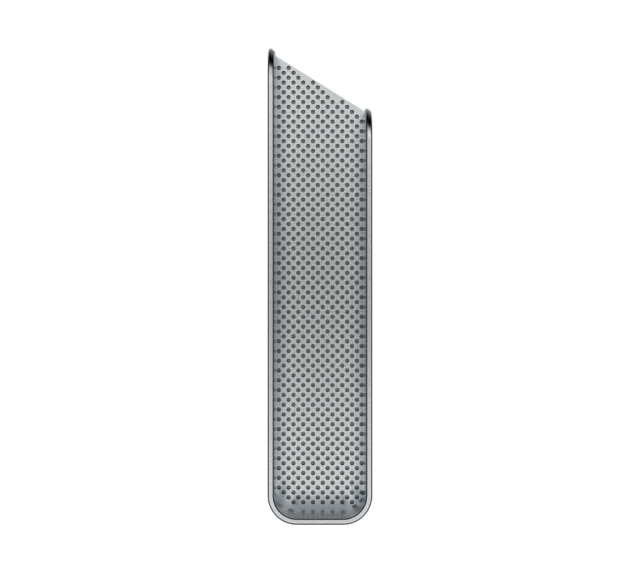
Low-friction chute
Designed for non-spherical and irregular powdersHigh-friction chute
Optimized for spherical granules such as glass beads

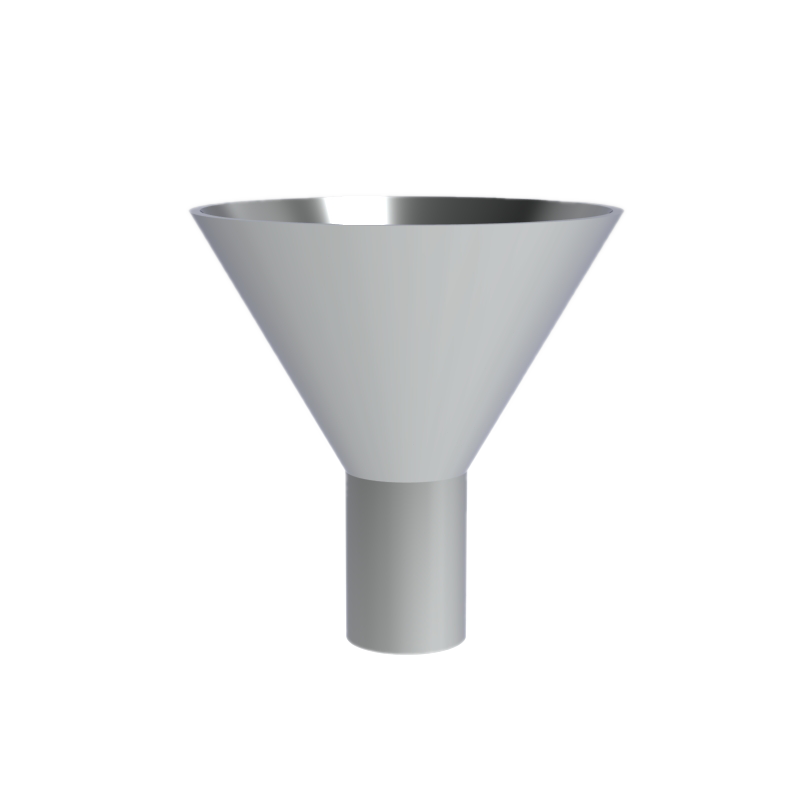
150 ml funnel 450 ml funnel
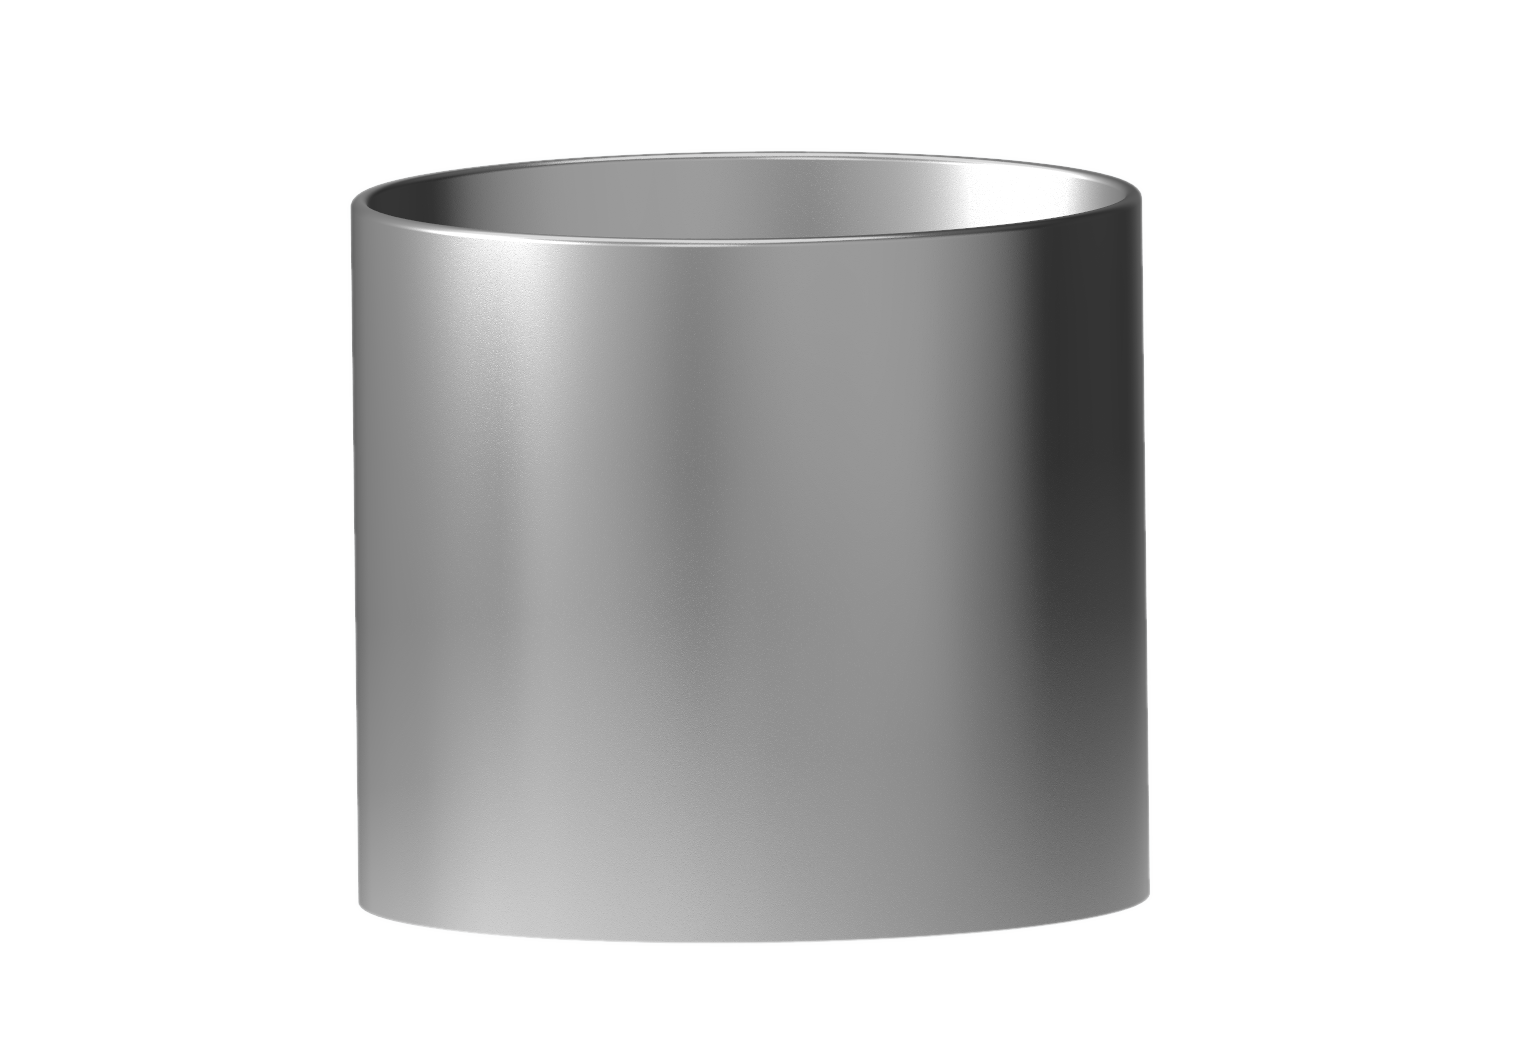
Expansion cylinderSpecialized Calibration Unit
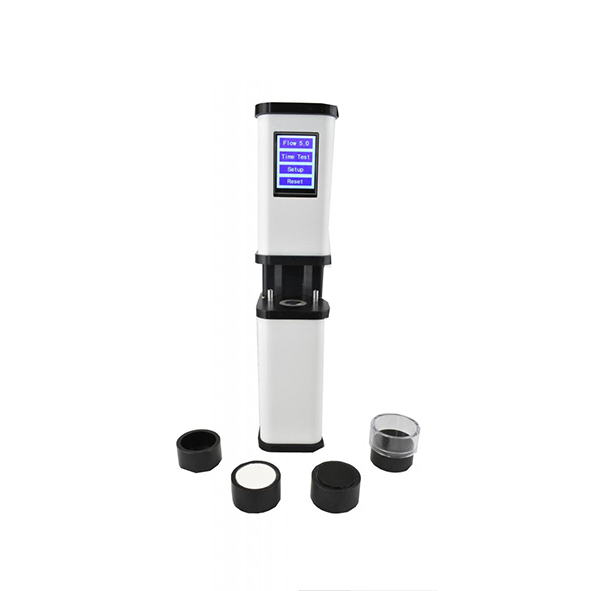
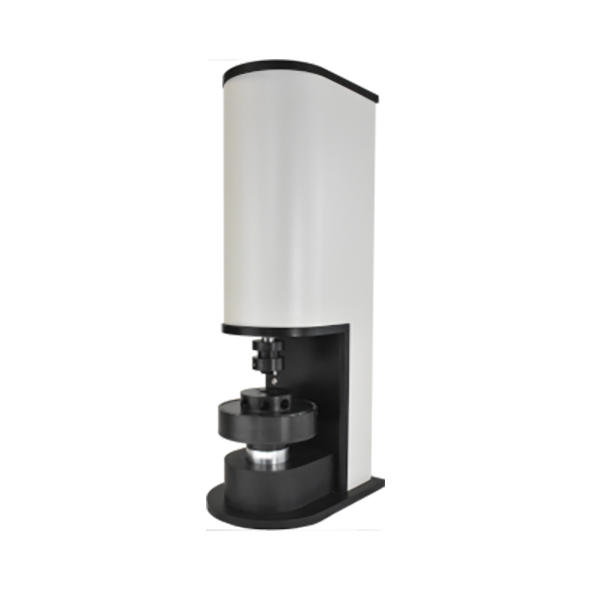
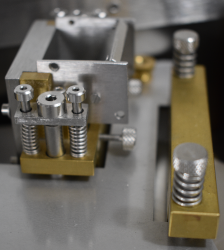
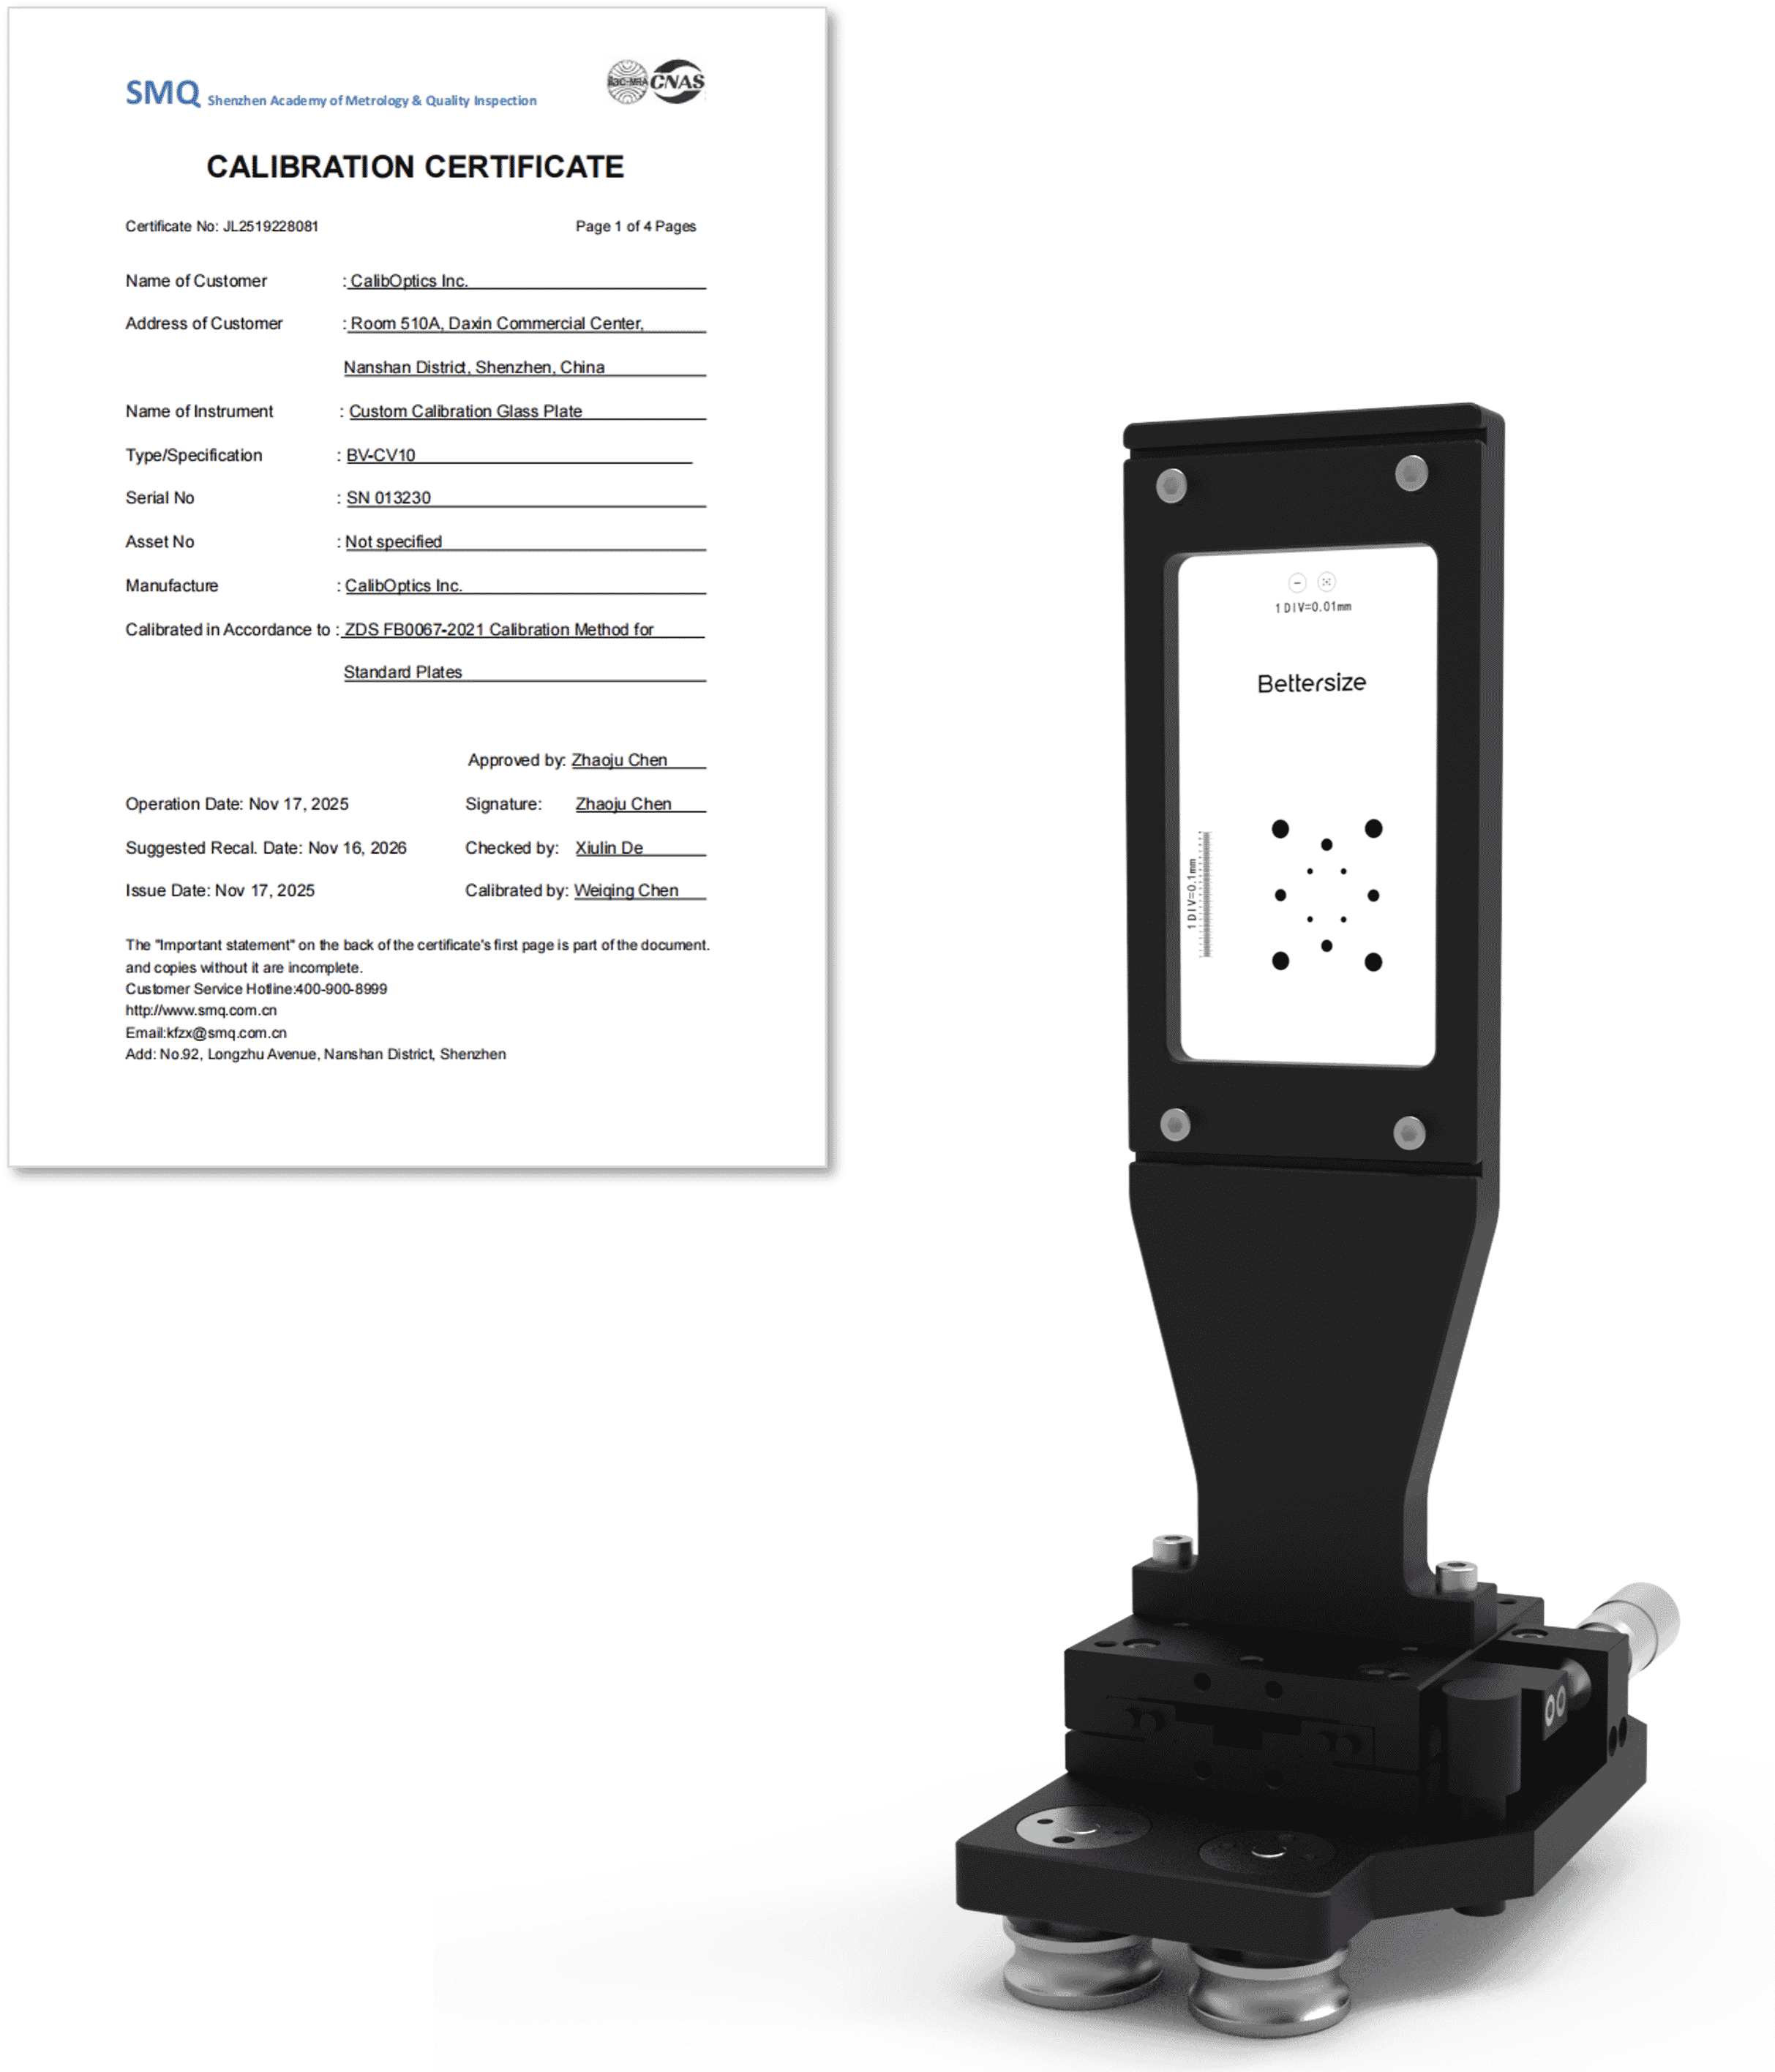
The Specialized Calibration Unit is designed for accurate calibration and verification of the DIA imaging system, ensuring long-term measurement reliability and compliance.

Features & Benefits
- 2-in-1 functionality
Used for both system calibration and performance verification. - Metrology-certified accuracy
Certified by the National Institute of Metrology, ensuring traceable and reliable results. - High precision
Measurement accuracy up to 1μm. - Simple and user-friendly operation
Quick setup and intuitive use for routine verification. - Automatic report generation
Software-generated calibration and verification reports support convenient annual verification and audit readiness.
- Fully software-controlled adjustments
-
Applications
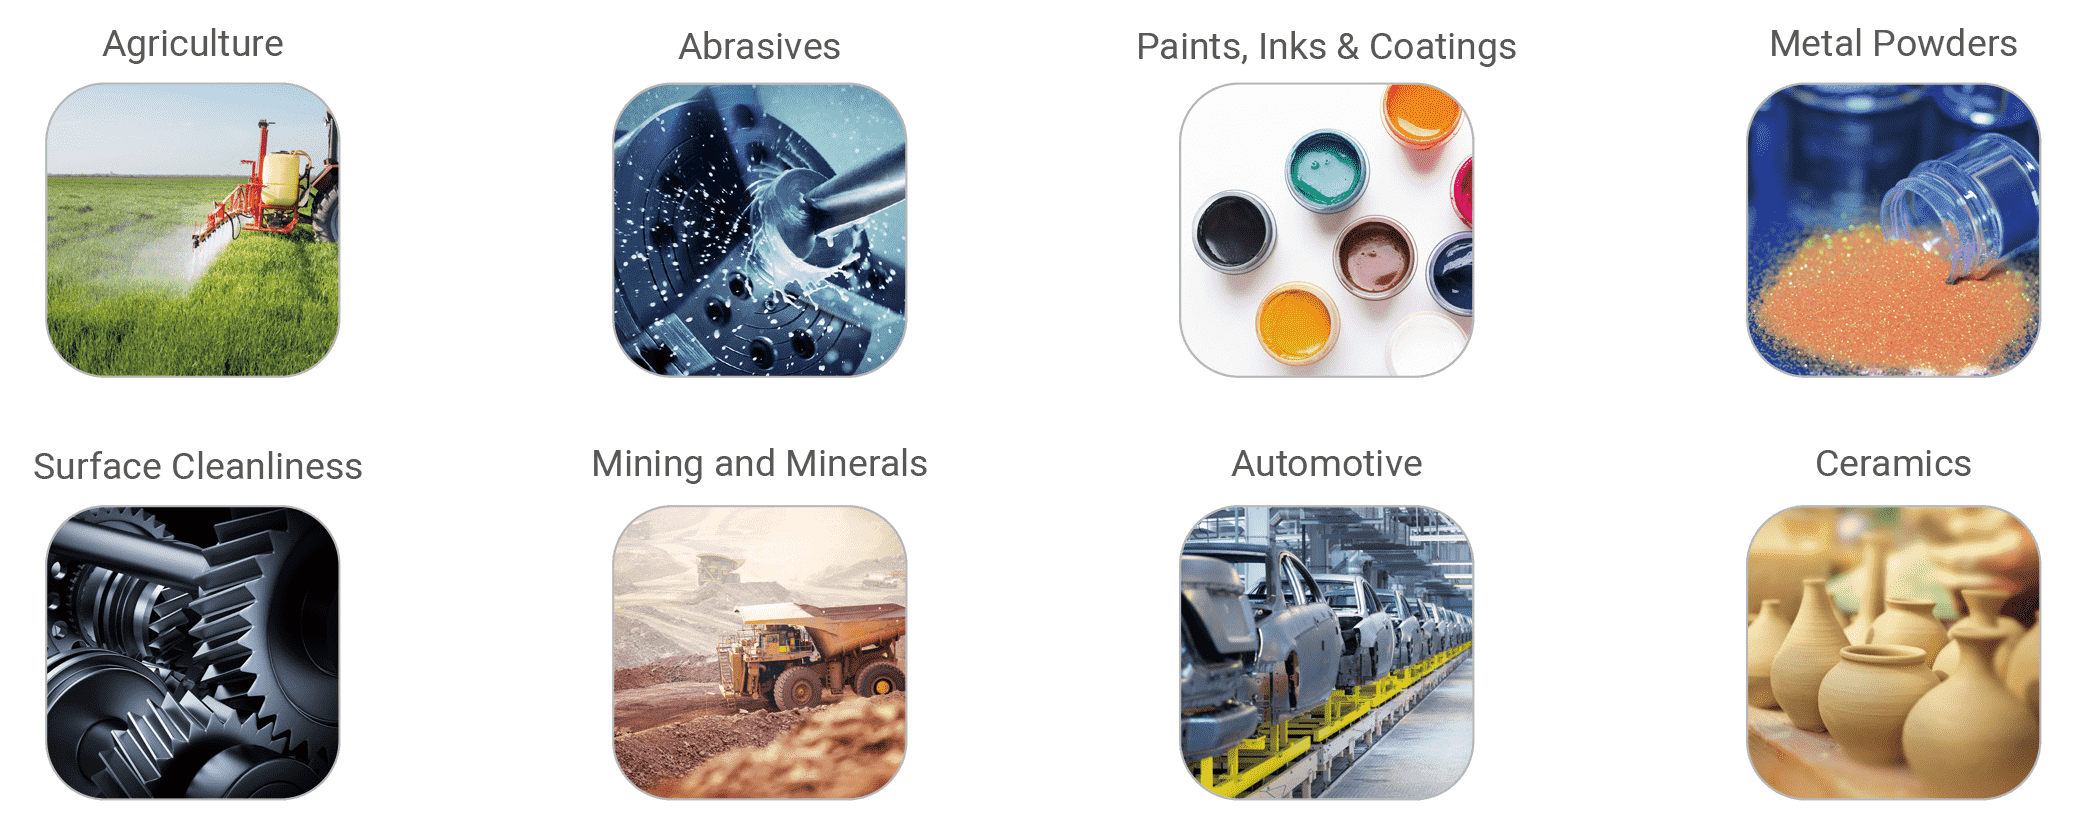
Typical Applications

Application Cases
Based on its wide measuring range, direct measurement principle, and broad compatibility with diverse sample types, the BeVision D3 Series can be widely used in many industries ranging from research to quality control, providing in-depth insights into particle analysis.
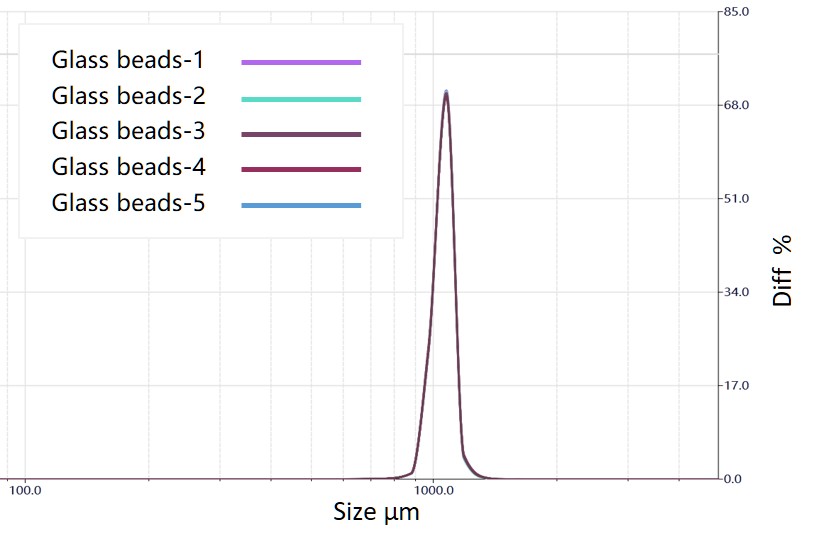
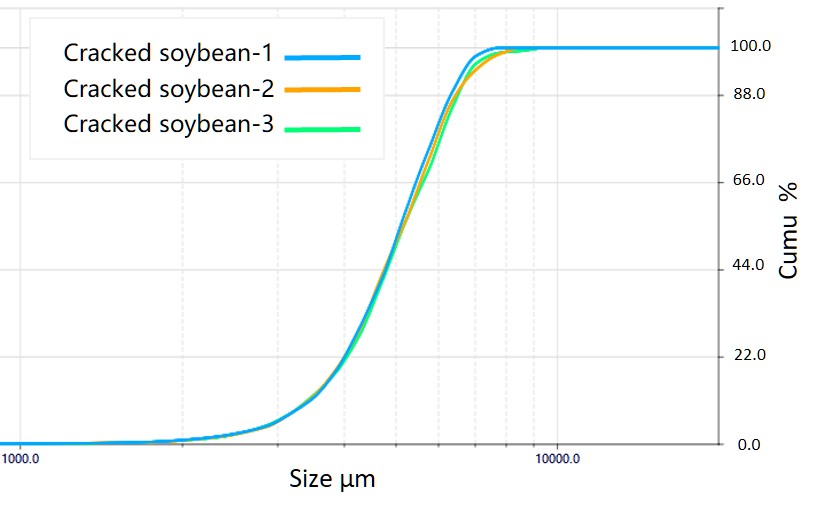
1. Excellent Repeatability
Example: Glass beads Glass bead particles are characterized in terms of length, diameter, and curvature. The measurement results closely align with intuitive visual assessments, confirming the accuracy and relevance of DIA-based morphology analysis. D10 D50 D90 
Mean /μm 994.74 1056.32 1112.13 Std. Dev /μm 0.39 0.43 0.76 Repeatability 0.04% 0.04% 0.07% Example: Cracked Soybeans Even for cracked soybean particles with wide size distributions and highly irregular shapes, the repeatability of D50 remains better than 0.5%, confirming reliable performance for real-world samples. D10 D50 D90 
Mean /μm 994.74 1056.32 1112.13 Std. Dev /μm 0.39 0.43 0.76 Repeatability 0.04% 0.04% 0.07% 2. Comprehensive Particle Size & Shape Analysis
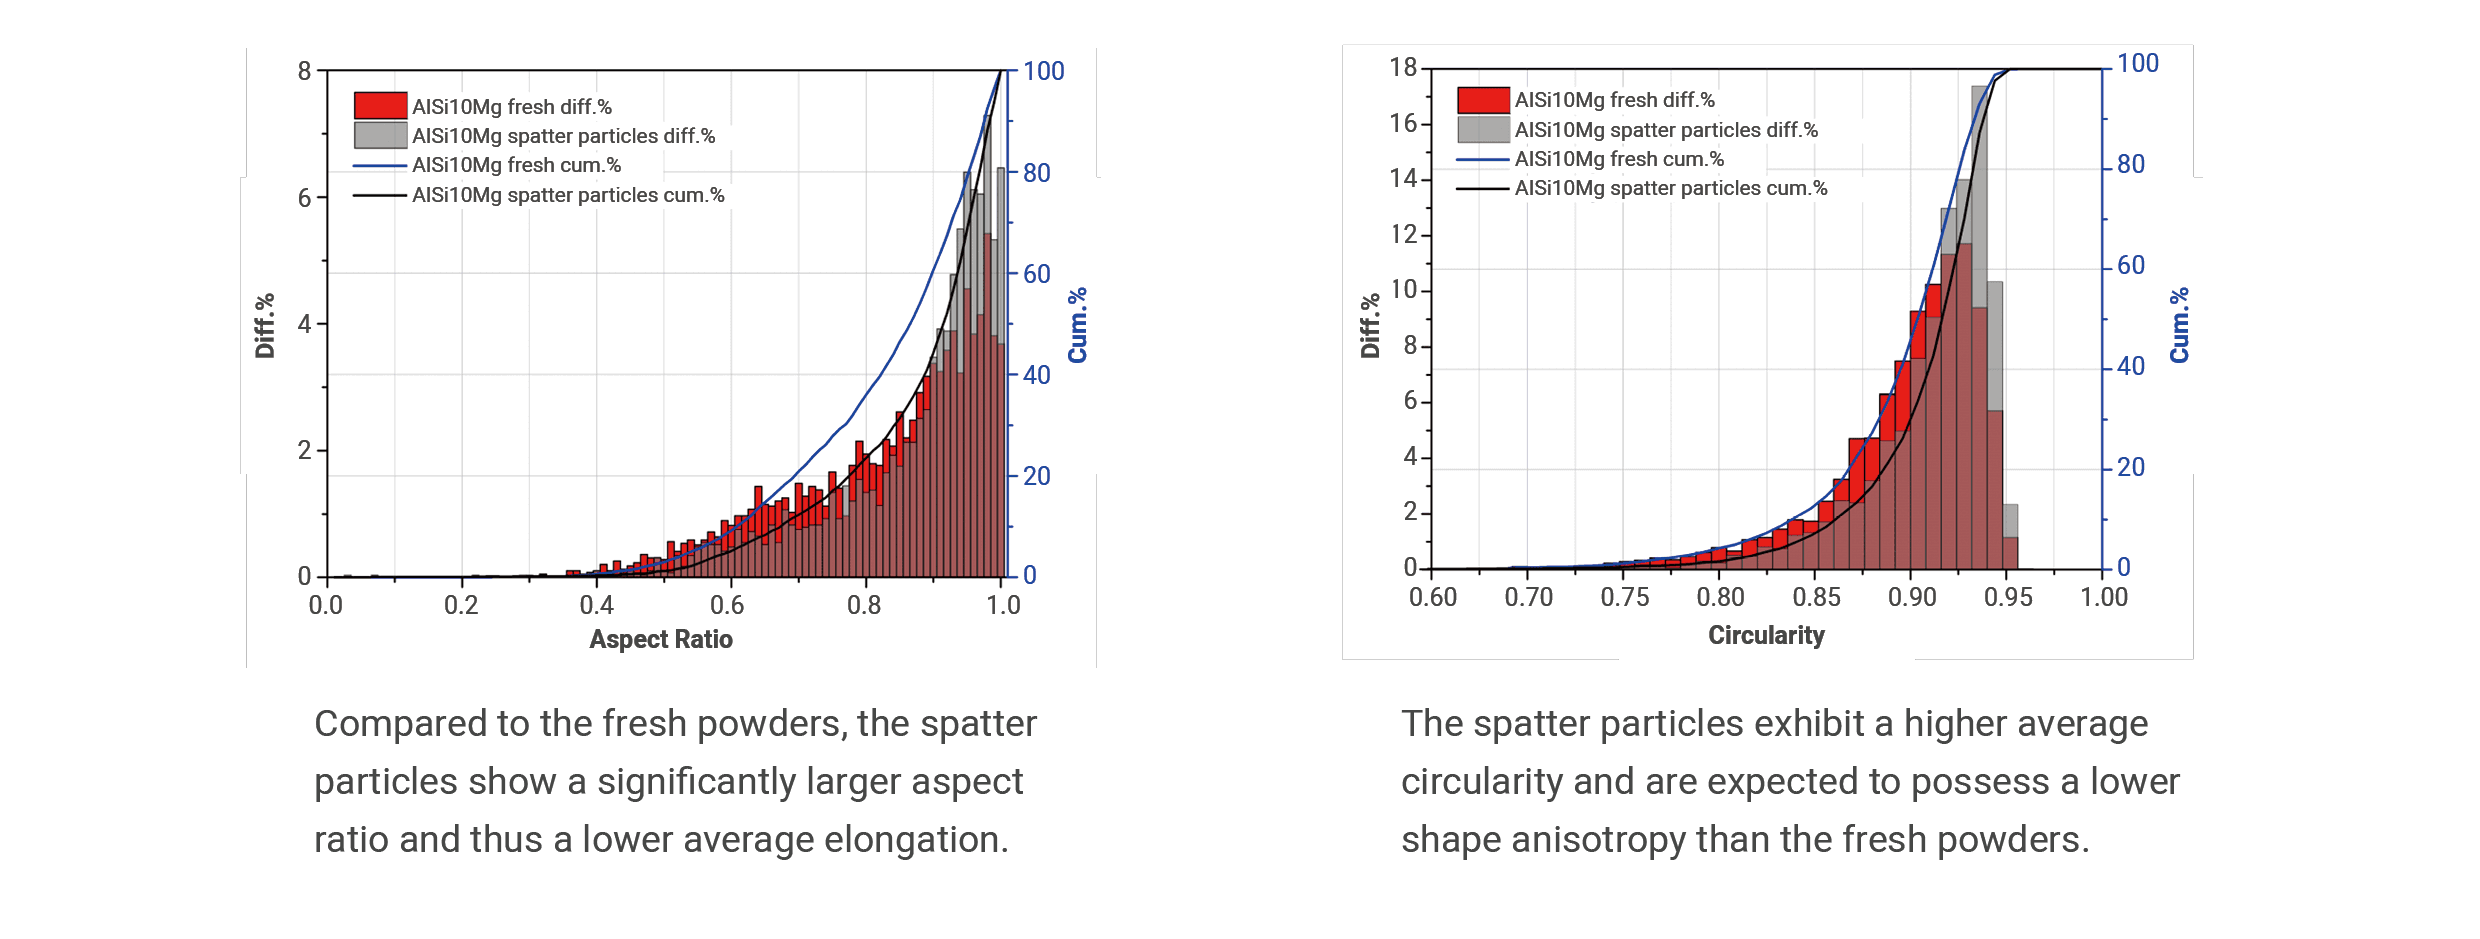
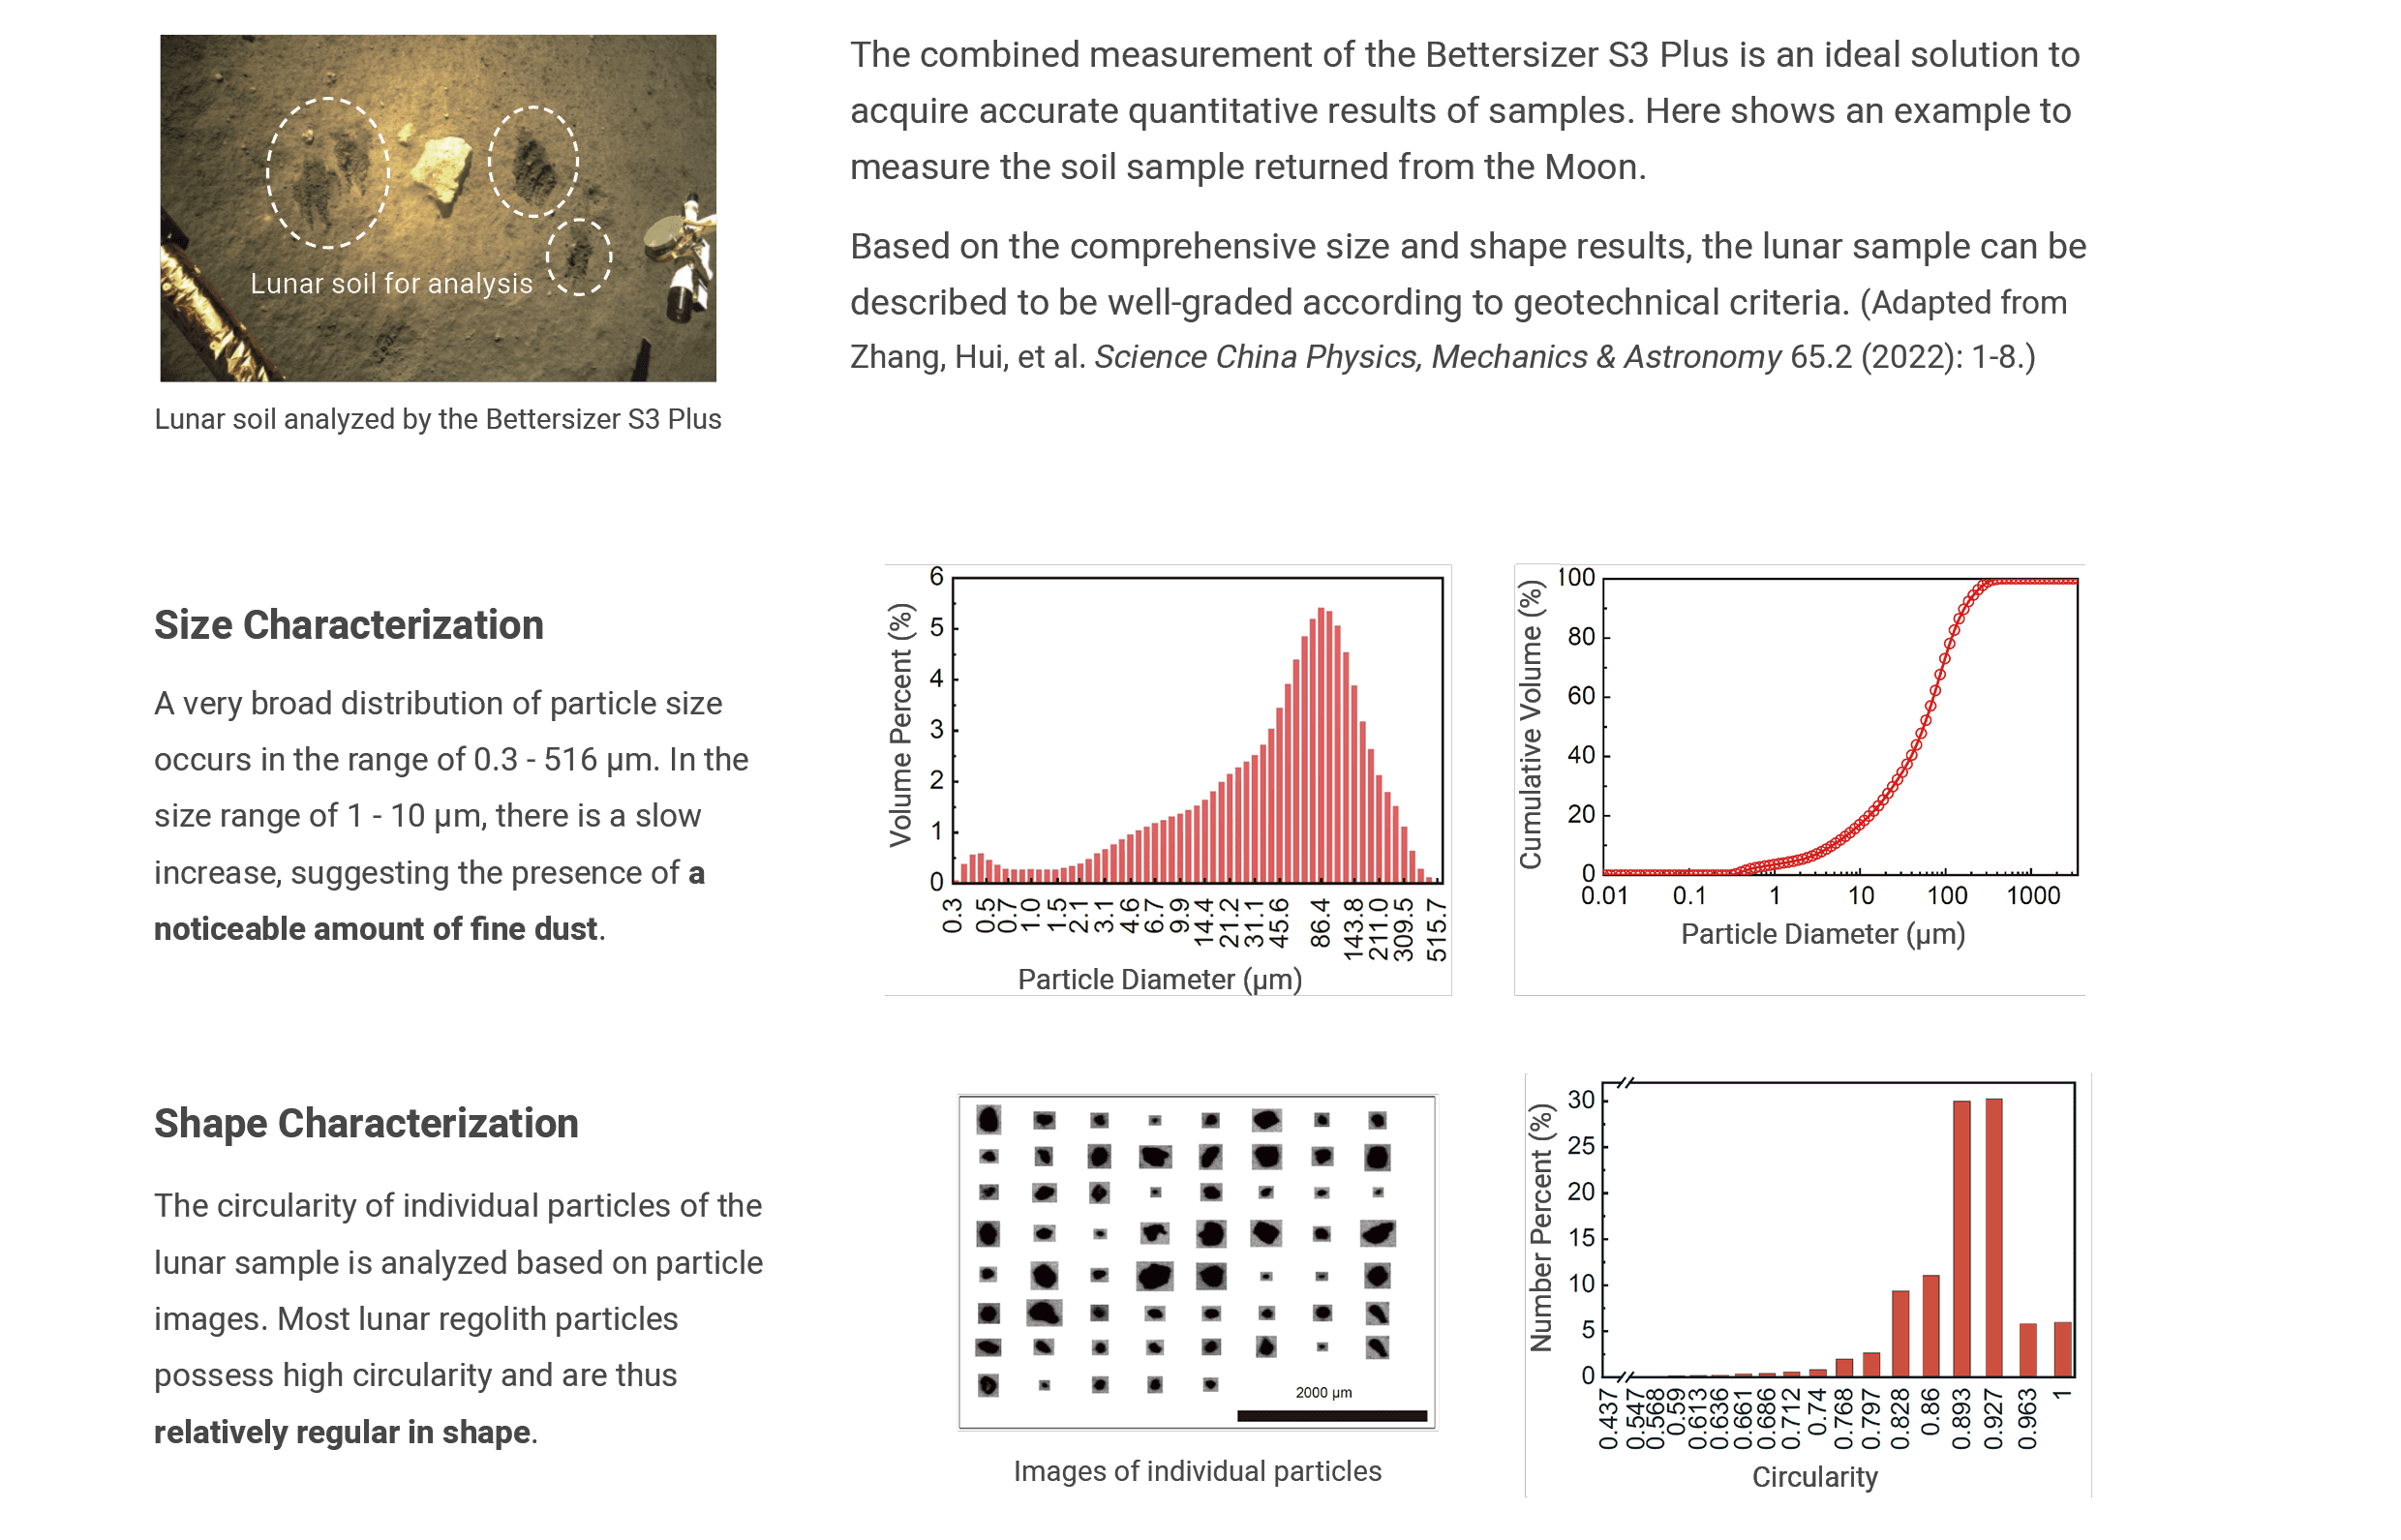
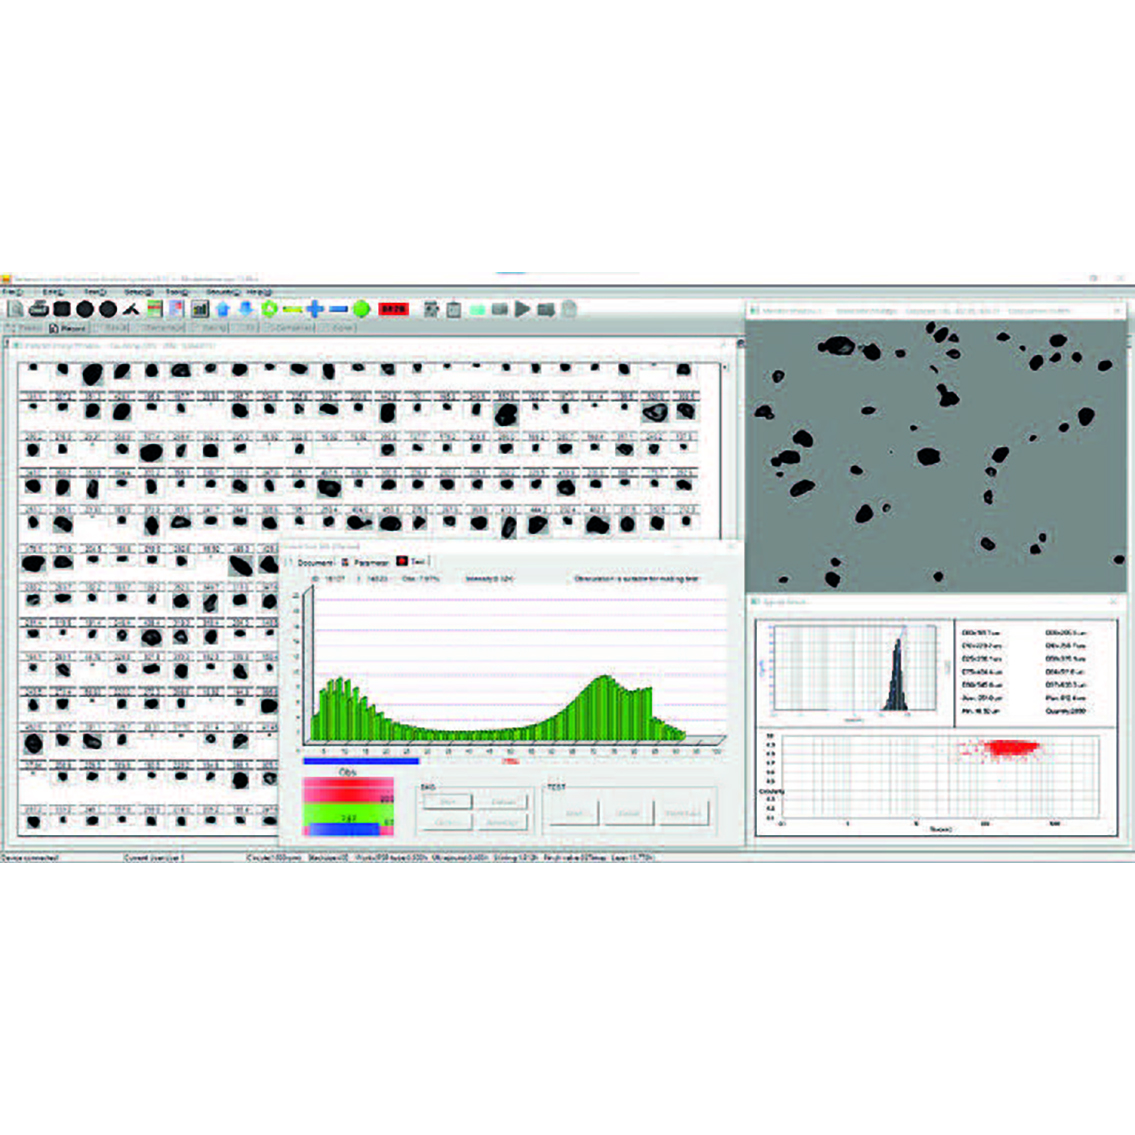
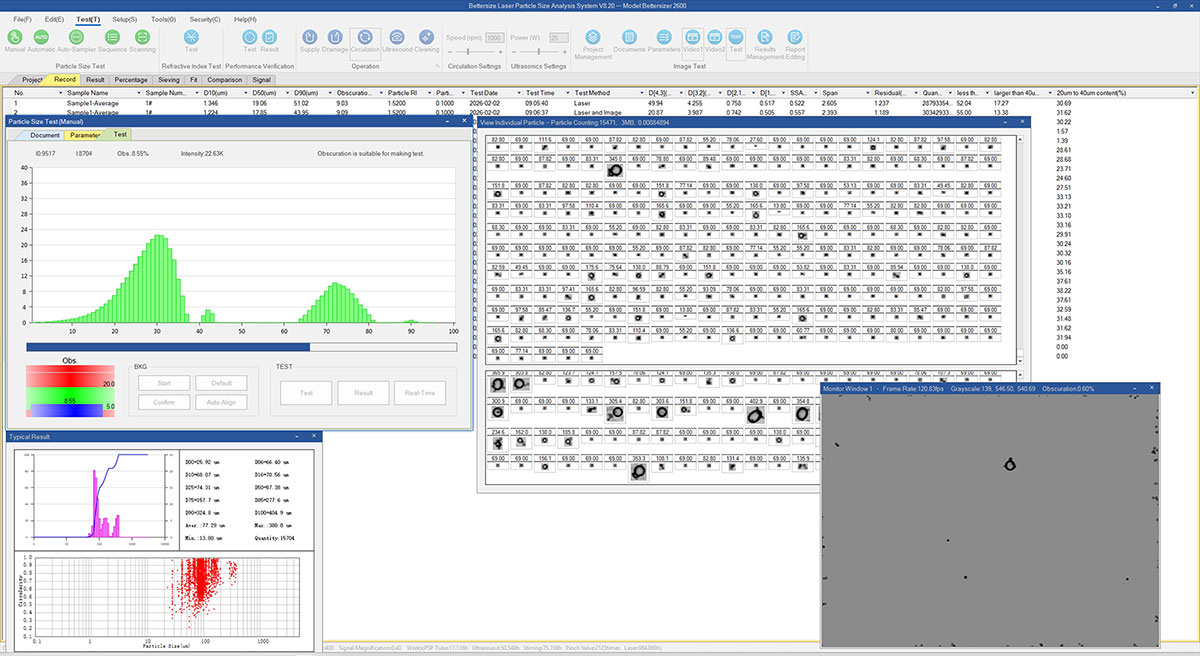
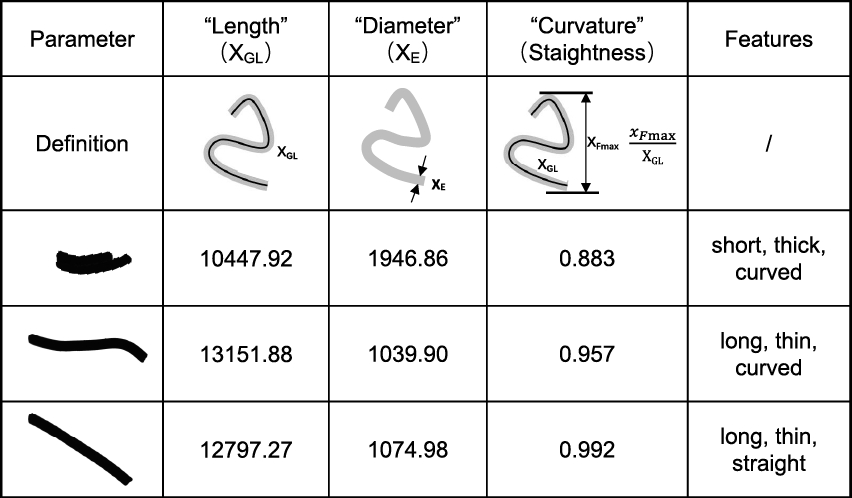
The BeVision DIA Software provides 37+ particle size and shape parameters, enabling thorough characterization and objective evaluation of diverse particle morphologies.
Example: Petroleum catalyst Rod-like catalyst particles are characterized in terms of length, diameter, and curvature. The measurement results closely align with intuitive visual assessments, confirming the accuracy and relevance of DIA-based morphology analysis. 

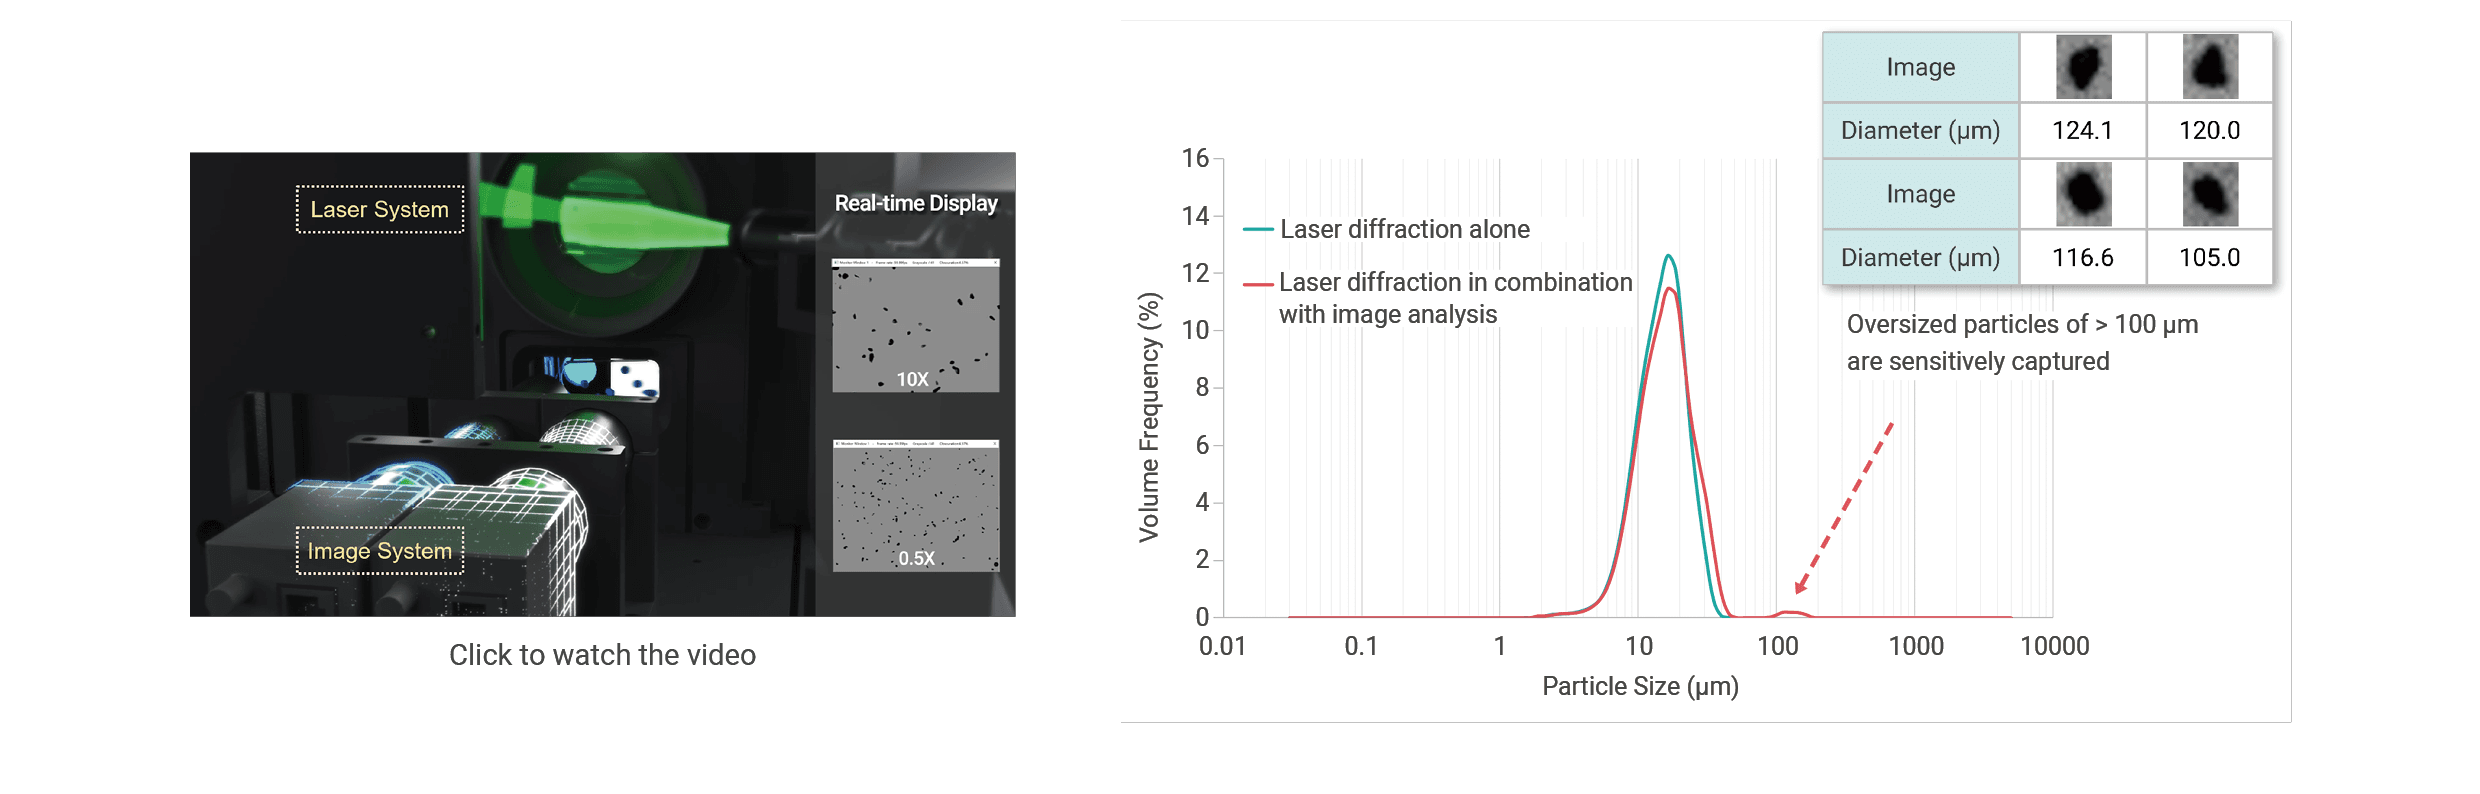
3. Accurate Determination of Low-Content Oversize Particles
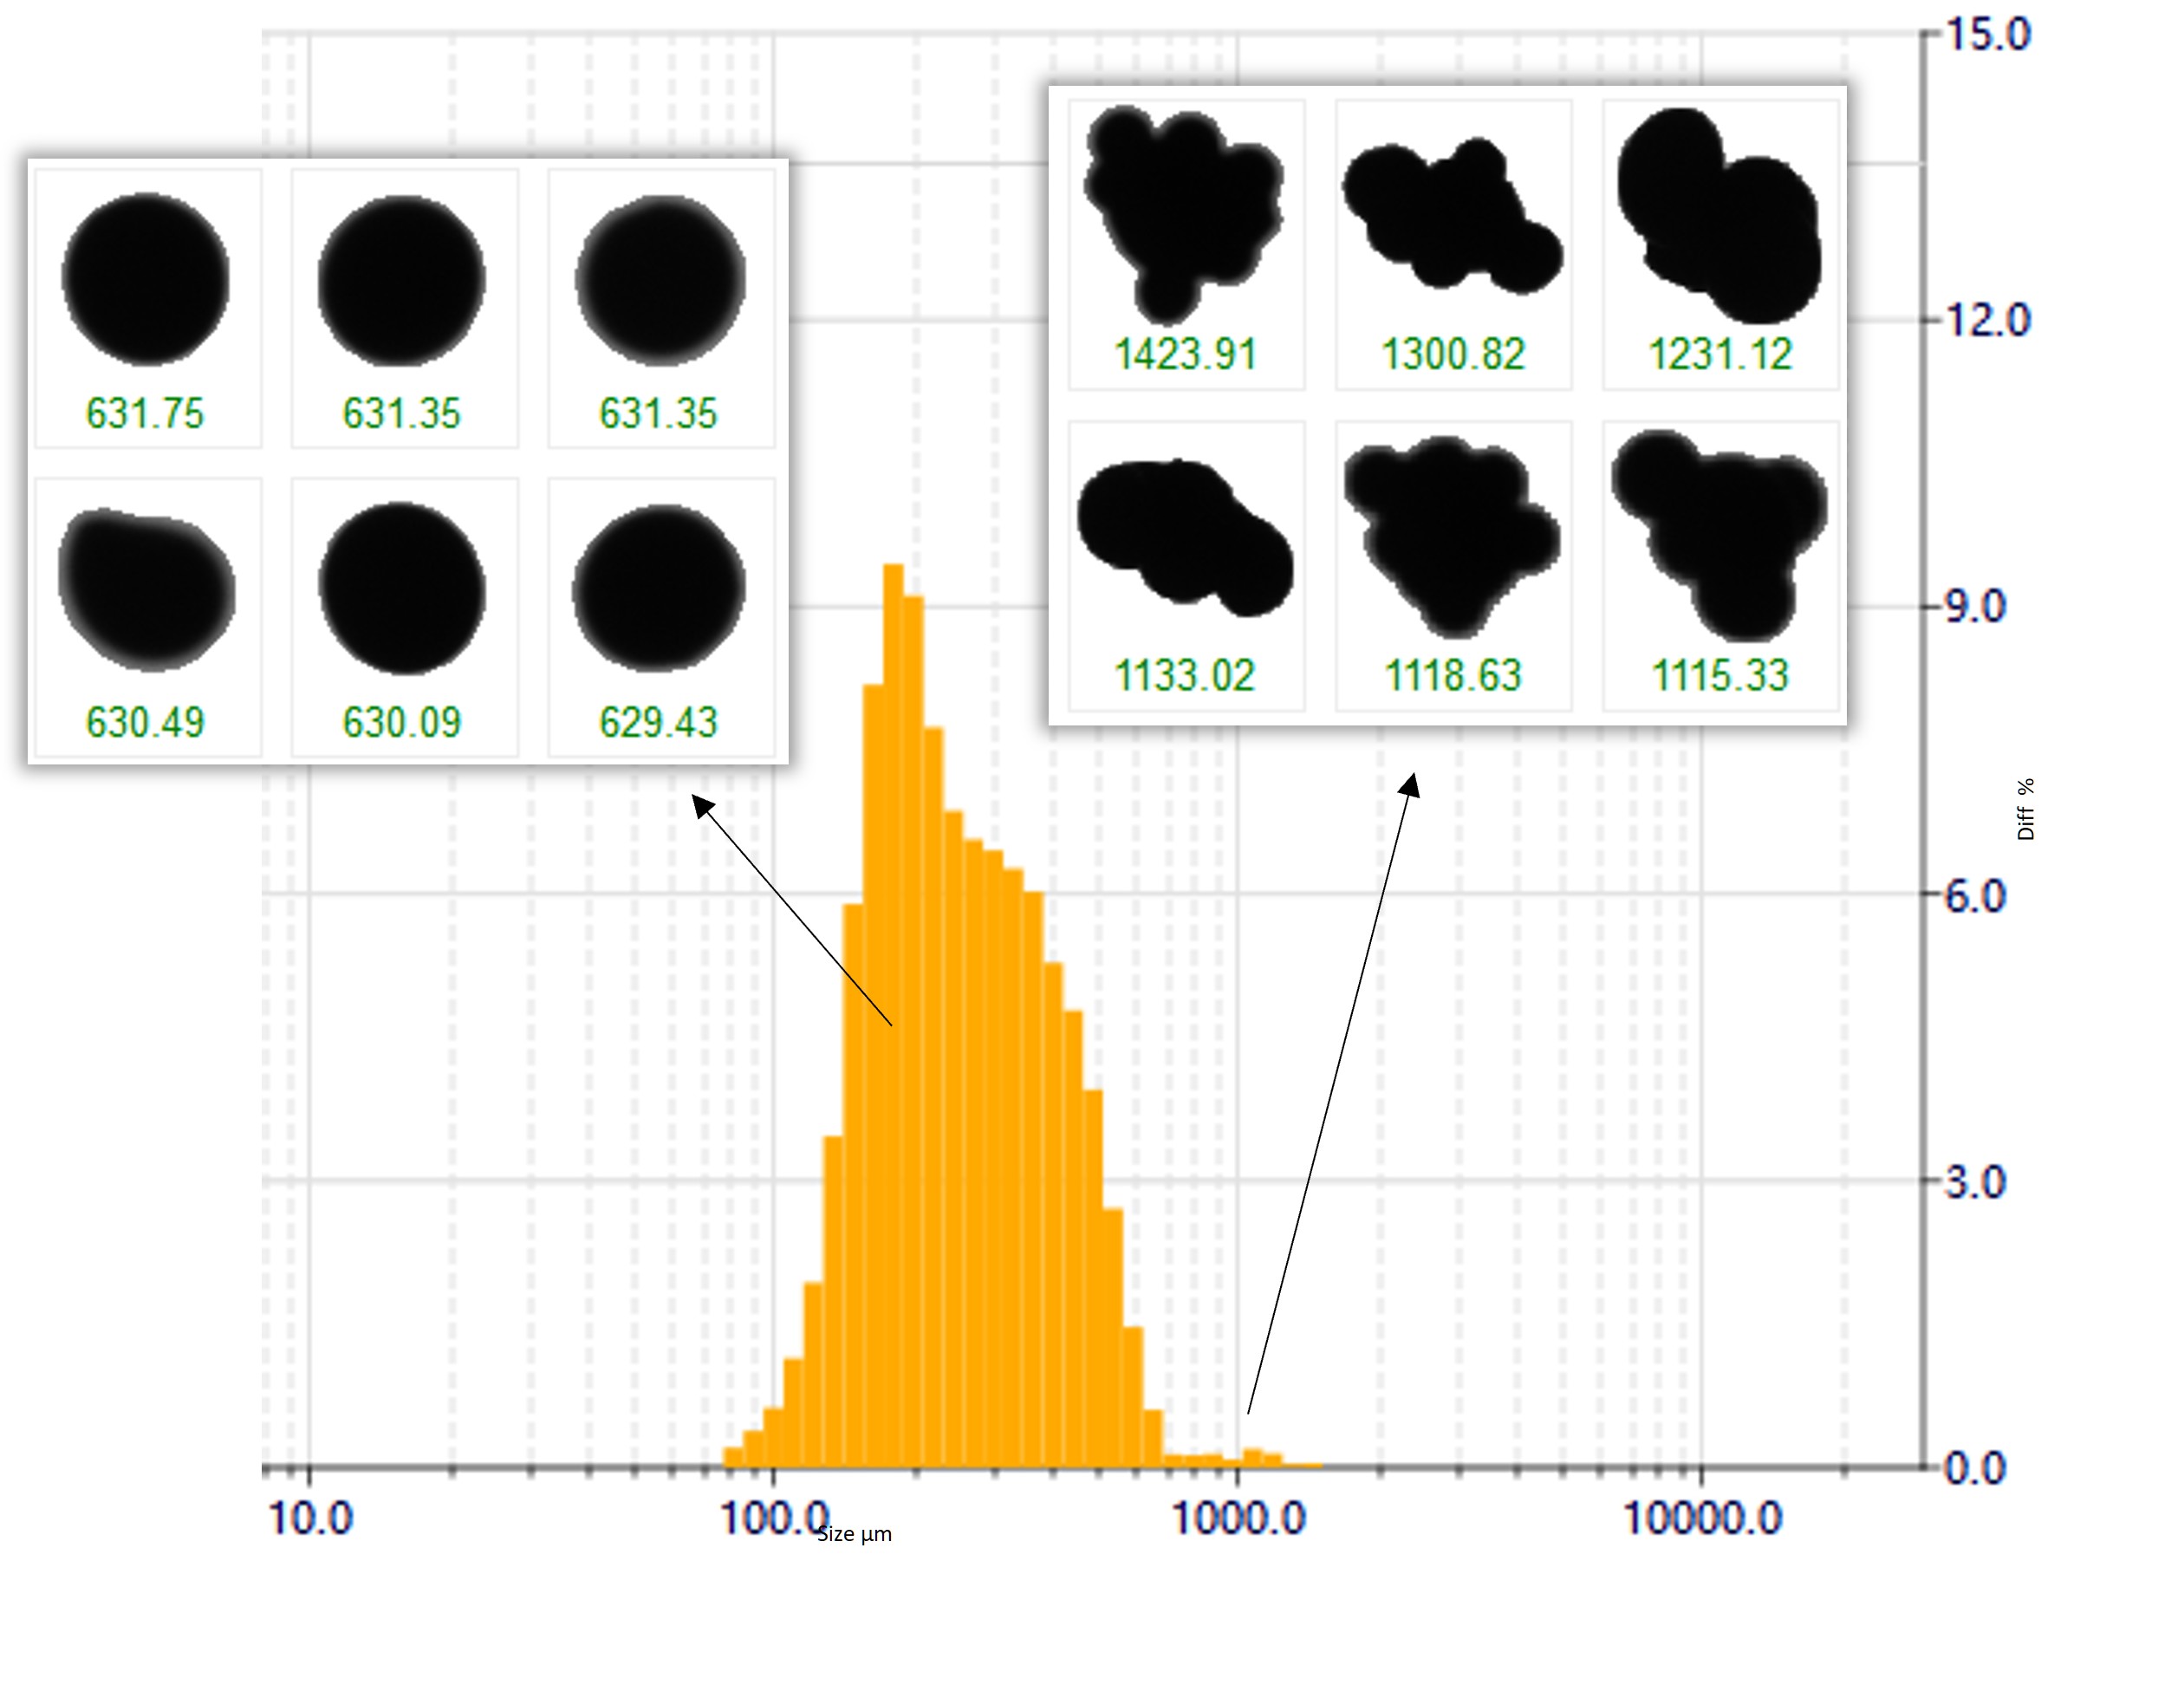
By leveraging advanced digital imaging technology and highspeed image capture, BeVision D3 Series achieves ultra-high detection efficiency. Even oversize particles present at extremely low concentrations can be accurately identified and quantified.
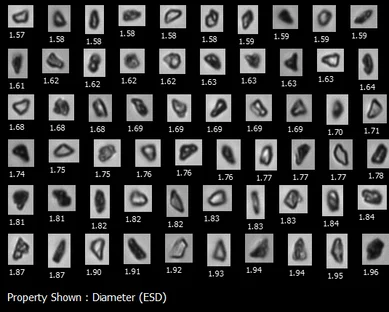
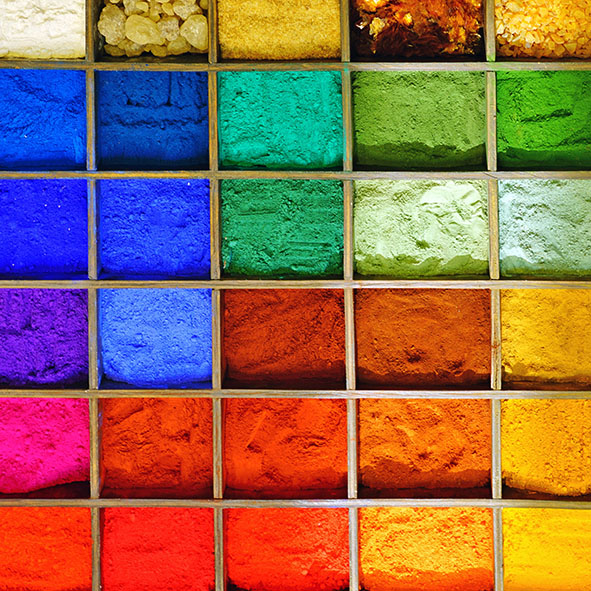
Example: Colorants Over 1 million colorant particles were analyzed within 6 minutes. The resulting size distribution revealed a small fraction of oversize particles, and captured images confirmed that each oversize particle was an agglomerate composed of multiple smaller colorant particles. 
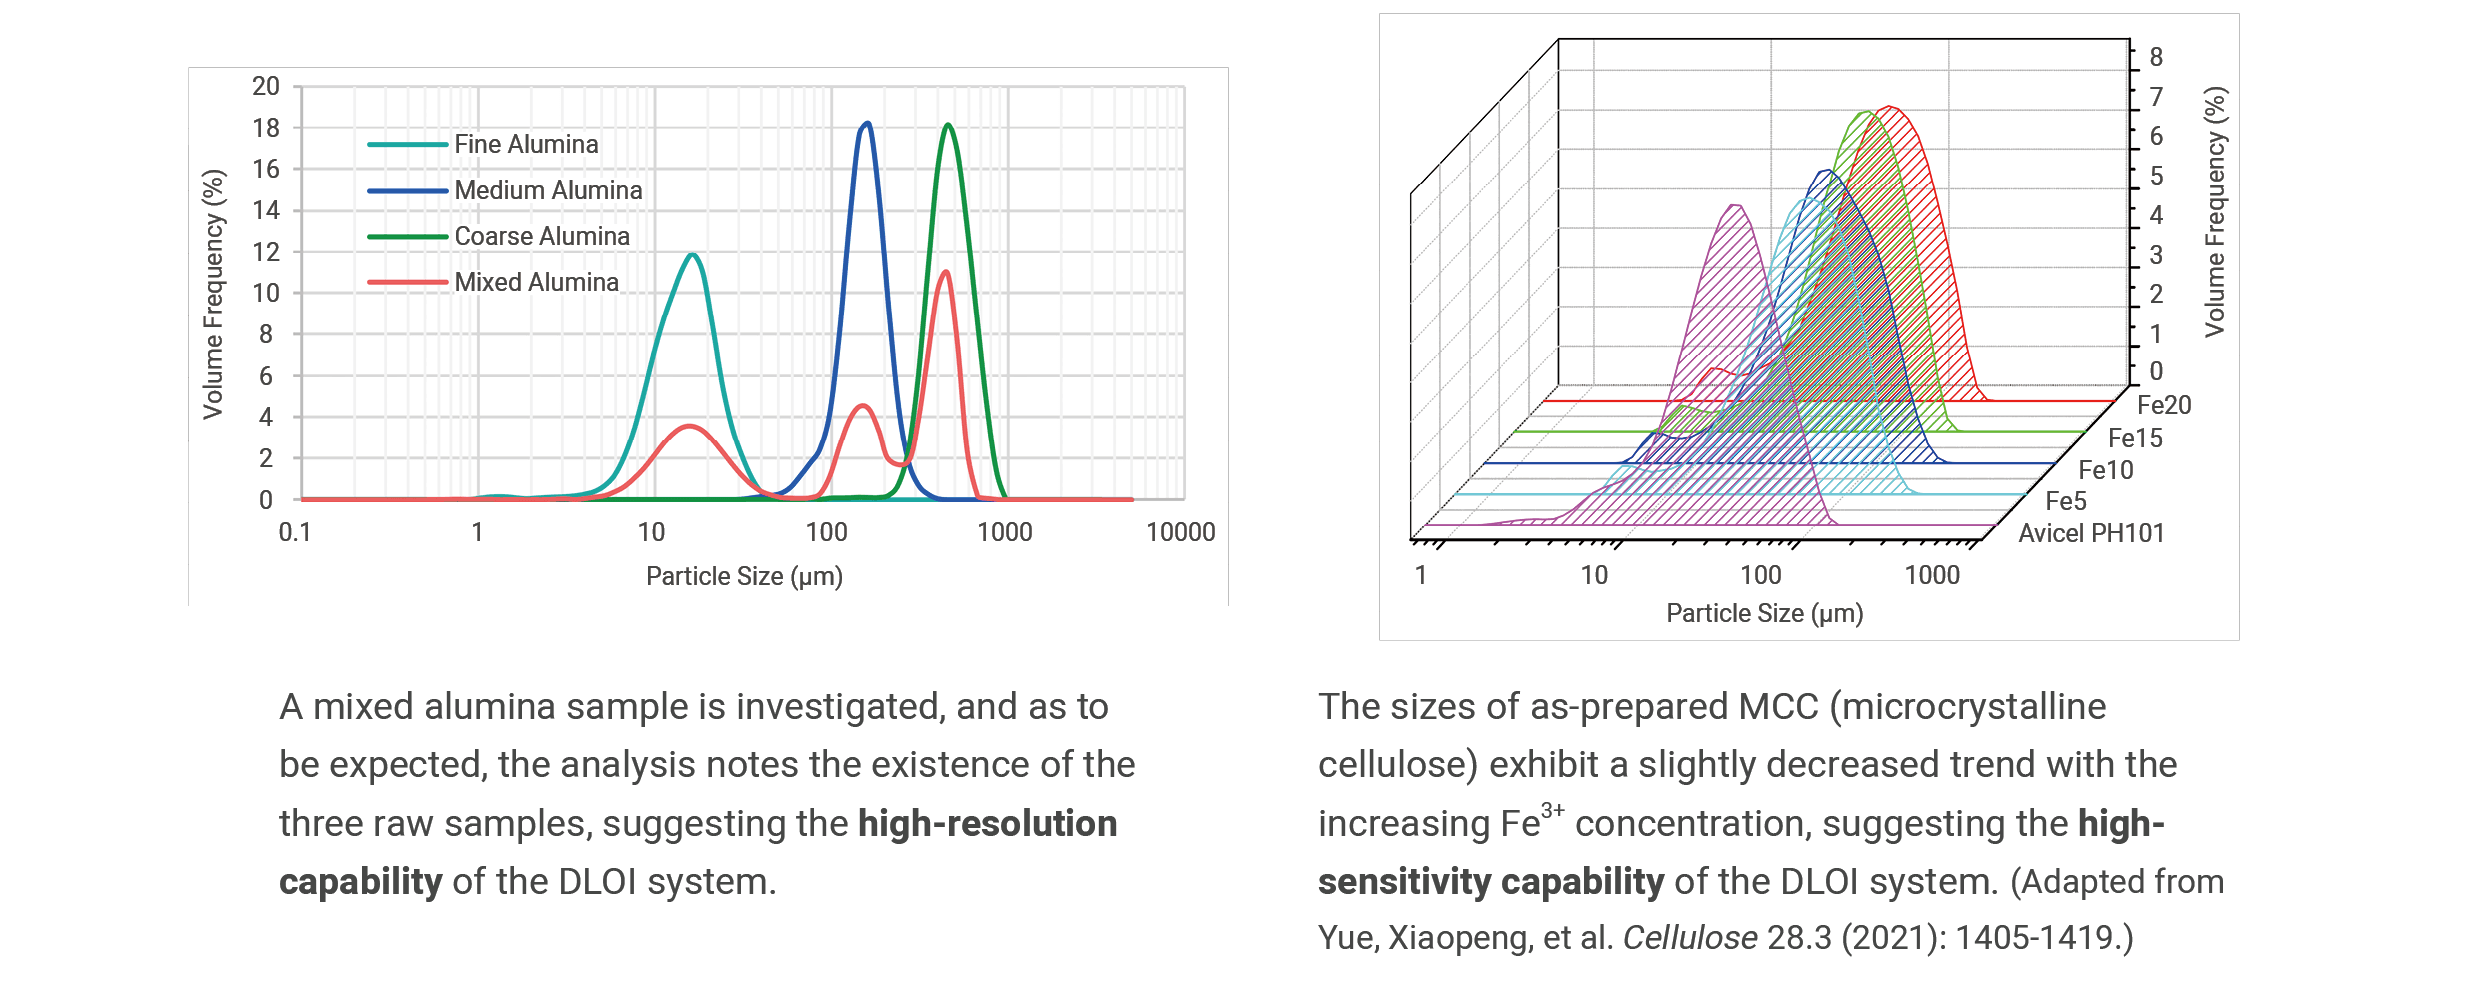
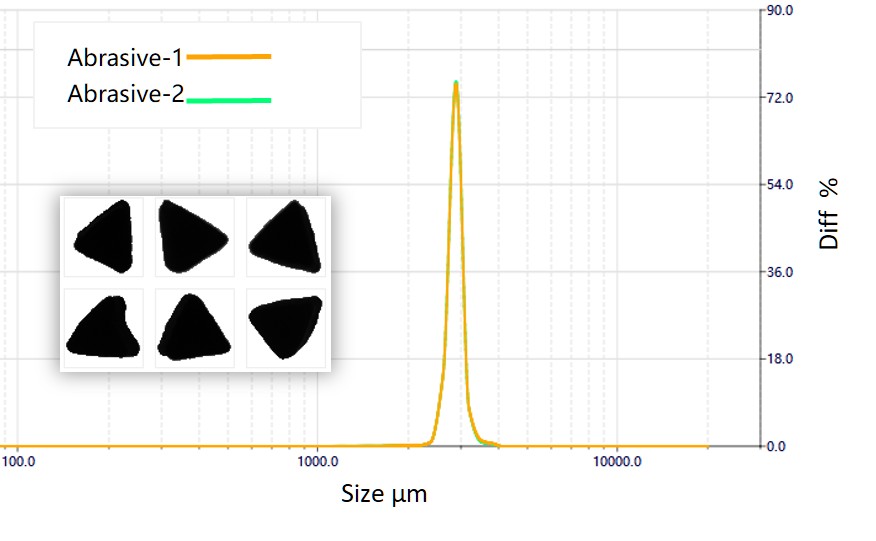
4. Ultra-High Resolution for Narrow Distributions
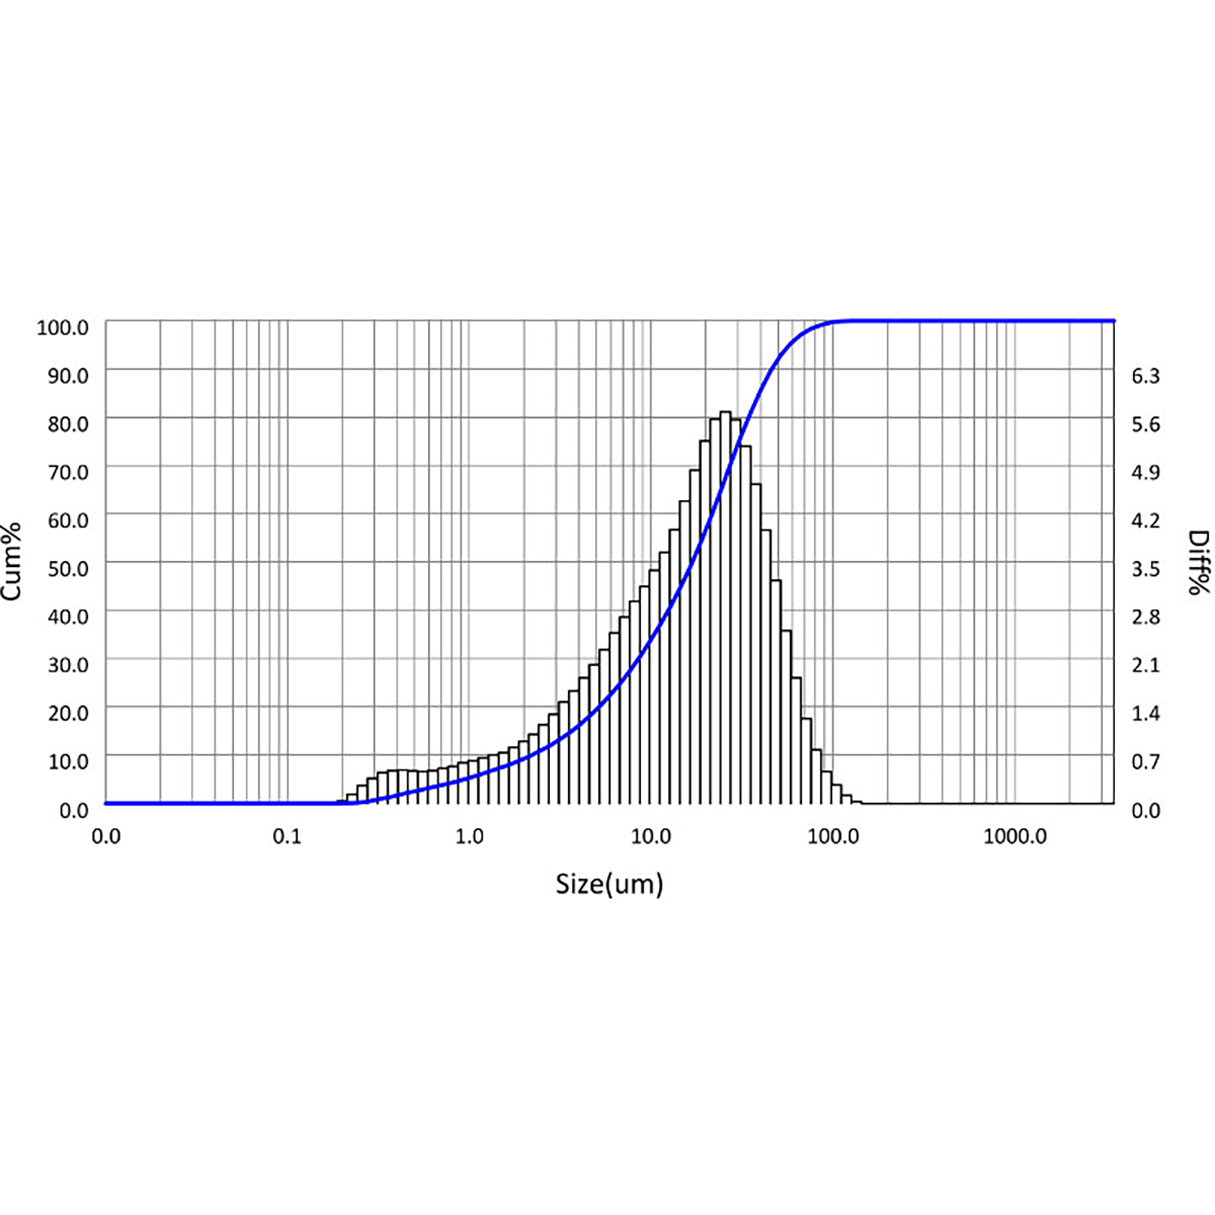
The BeVision D3 Series analyzes every individual particle captured during measurement and performs statistical analysis across the full particle population, achieving single-particle resolution.
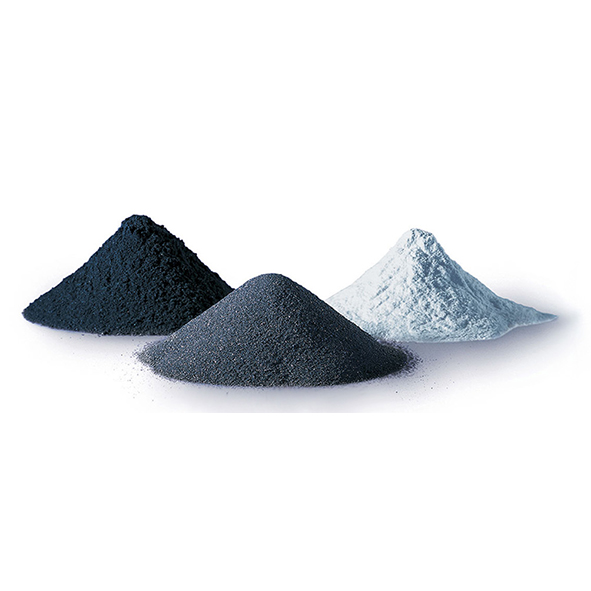
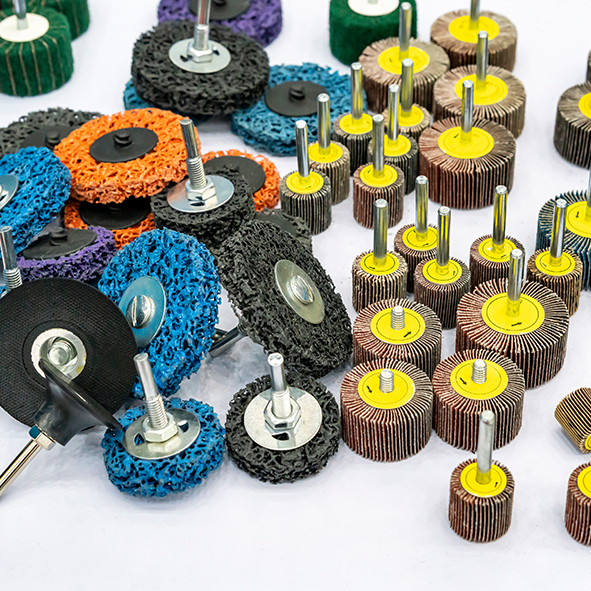
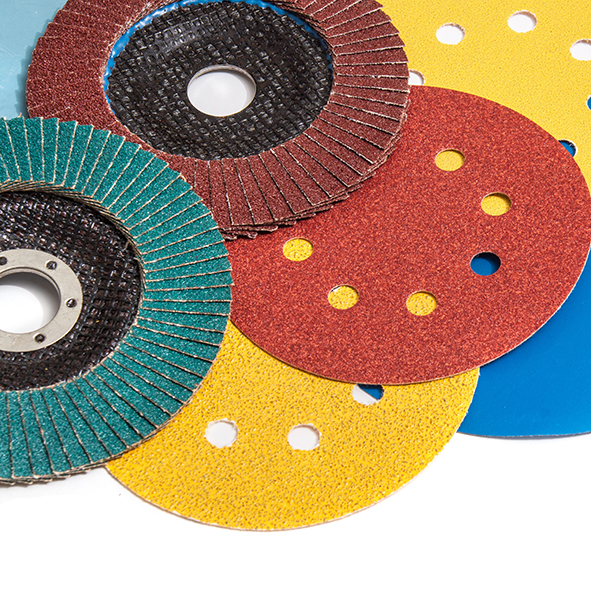
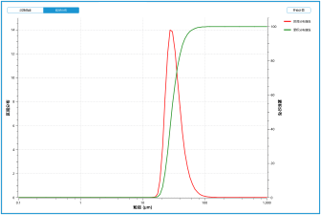
Example: Abrasives In abrasive materials, both oversize and undersize particles can negatively affect grinding performance. The BeVision D3 Series precisely quantifies the content of oversize and undersize particles, while also providing particle shape analysis to evaluate abrasive sharpness. 
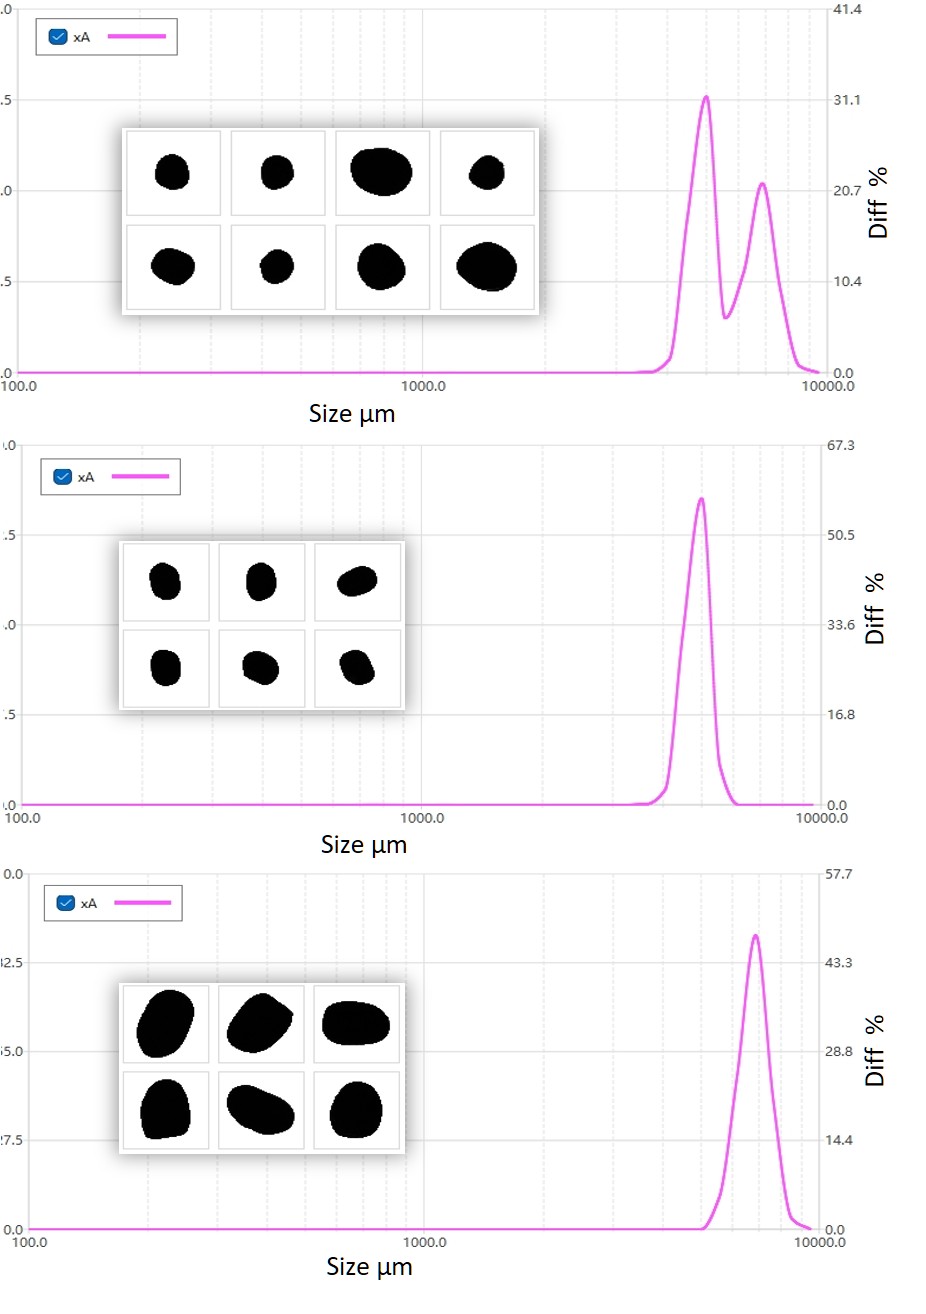
5. Mixture Analysis
The BeVision DIA Software is a powerful data analysis platform that enables separation and analysis of mixed particle systems. Particle mixtures can be classified and filtered based on size, shape, or multiple parameters, allowing each fraction to be analyzed independently within a single dataset.
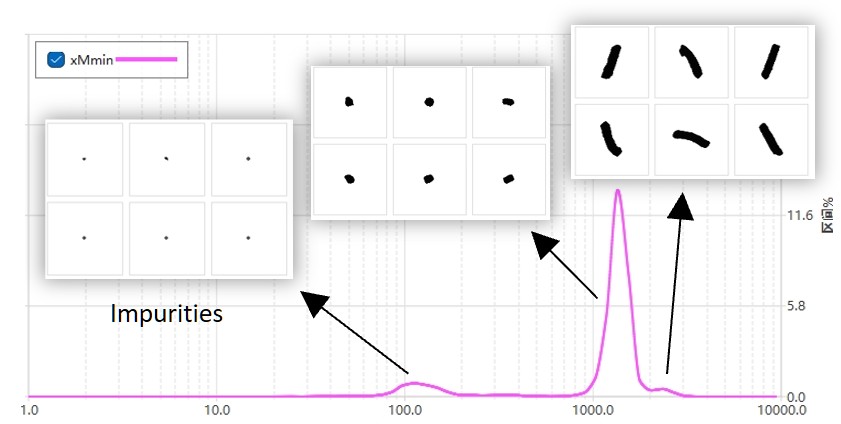
Example: Beans 
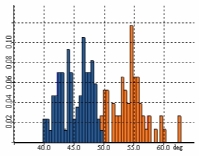
Direct measurement of mixed beans produces a bimodal particle size distribution (PSD). The smaller peak corresponds to mung beans, while the larger peak represents red beans. By applying size-based filtration, the software separates red beans and mung beans from the mixed dataset, enabling independent analysis of each component without additional measurements. 6. Fully Comparable with Sieving Results
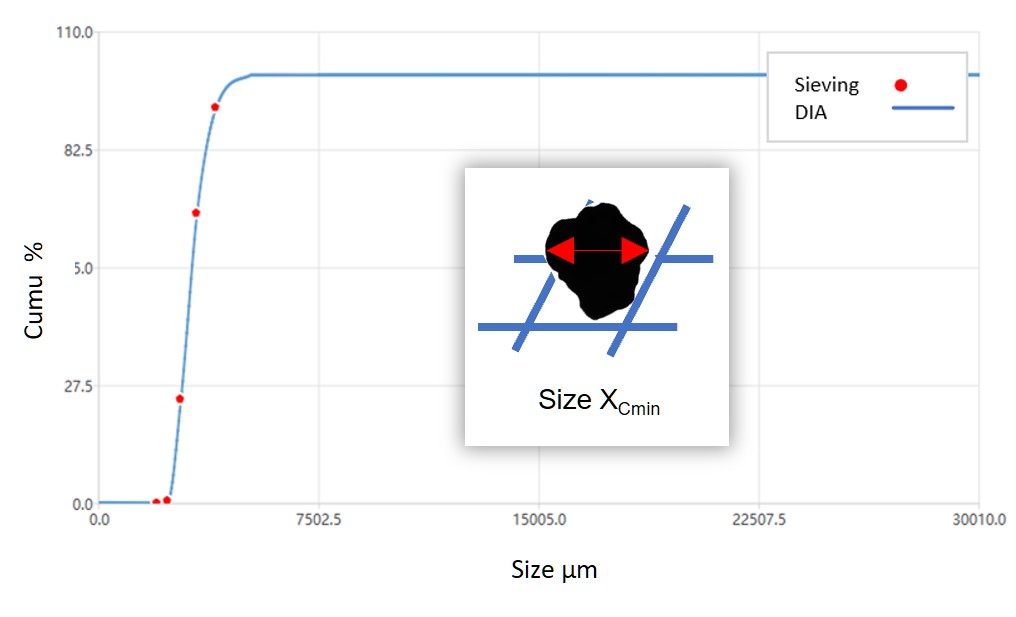
The BeVision D3 Series uses a sieve-equivalent diameter aligned with the fundamental principles of sieving, delivering particle size distributions (PSD) that are highly consistent with traditional sieve analysis. Its dedicated sieve correlation function automatically compensates for systematic differences related to measurement principles, particle shape and statistical effects, and directly outputs sieving-correlated PSD results.
Example: Fertilizer PSDs measured by the BeVision D3 show excellent agreement with sieve analysis results. Users can switch seamlessly from mechanical sieving to the BeVision D3 system, significantly improving testing efficiency while reducing labor costs. 
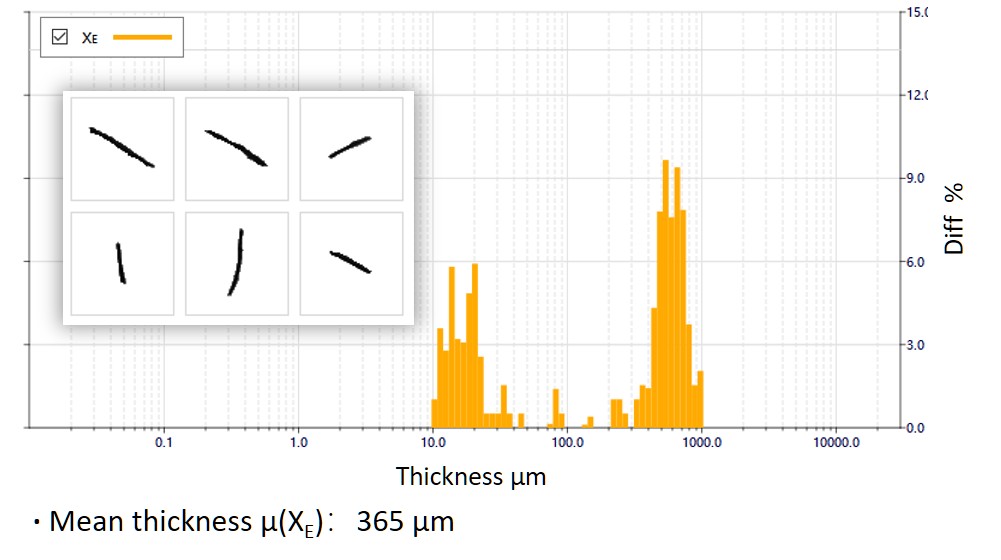
7. Thickness Measurement of Flaky Particles
The BeVision D3 Series is capable of capturing crosssectional images of flaky particles during measurement, enabling automatic and direct thickness measurement.
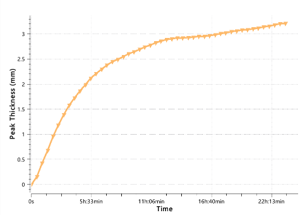
Example: Soybean meal The thickness of the flaky soybean meal residue after pressing directly reflects the residual oil content. Conventional thickness measurement relies on manual caliper measurements of individual particles, resulting in extremely low efficiency and poor representativeness.
The BeVision D3 system automatically measures and outputs the thickness distribution and mean thickness, significantly improving measurement efficiency, repeatability, and statistical reliability
-
Application Notes
-
Specifications
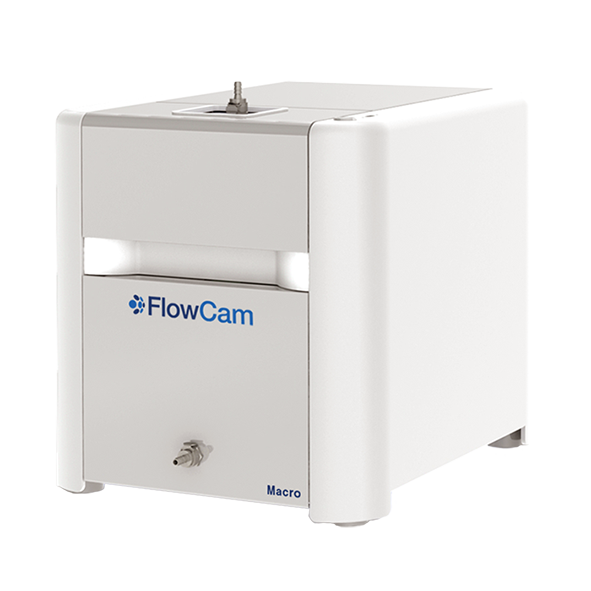
Parameter BeVision D3 BeVision D3 Macro BeVision D3 Pro Measurement Principle DIA DIA DIA Optical System Single-lens system Single-lens system Dual-lens system Measurement Range 11.5 μm — 16 mm 20 μm — 26 mm 0.5 μm — 16 mm CMOS Camera 5 megapixels 5 megapixels 5 megapixels per camera Light Source Green parallel planar light Green parallel planar light Basic system: green parallel
planar light
Zoom system: blue lightRepeatability (D50 of standards) ≤ 0.5 % ≤ 0.5 % ≤ 0.5 % Result Output FormatCharts: Excel / TXT / JPG / BMP Reports: PDF / Excel Recommended Sample Amount< 20 mg – 200 g (sample type dependent) Typical Test Time3 minutes (sample dependent) Dimensions (L × W × H)686 mm × 300 mm × 325 mm Weight24 kg Power Supply100-240 VAC, 50/60 Hz ConformityISO 13322-2, ISO 9276 Computer ConfigurationIntel ® Core™ i9 (14th gen), 32 GB RAM, 64-bit Windows 11, 1 TB SSD Accessories of the BV-F10Funnels150 ml stainless steel funnel, 450 ml stainless steel funnel expansion cylinder ChutesHigh-friction stainless steel chute, low-friction stainless steel chute
Not sure if it’s the right instrument?
No worries, send us a sample and we will test it for you
-
Name of customer
Morbi ornare magna nec tortor rutrum interdum. Donec interdum facilisis elit, et iaculis nunc facilisis vitae. Sed quis semper dolor, id efficitur ex. -
Name of customer
Morbi ornare magna nec tortor rutrum interdum. Donec interdum facilisis elit, et iaculis nunc facilisis vitae. Sed quis semper dolor, id efficitur ex. -
Name of customer
Morbi ornare magna nec tortor rutrum interdum. Donec interdum facilisis elit, et iaculis nunc facilisis vitae. Sed quis semper dolor, id efficitur ex. -
Name of customer
Morbi ornare magna nec tortor rutrum interdum. Donec interdum facilisis elit, et iaculis nunc facilisis vitae. Sed quis semper dolor, id efficitur ex. -
Name of customer
Morbi ornare magna nec tortor rutrum interdum. Donec interdum facilisis elit, et iaculis nunc facilisis vitae. Sed quis semper dolor, id efficitur ex. -
Name of customer
Morbi ornare magna nec tortor rutrum interdum. Donec interdum facilisis elit, et iaculis nunc facilisis vitae. Sed quis semper dolor, id efficitur ex. -
Name of customer
Morbi ornare magna nec tortor rutrum interdum. Donec interdum facilisis elit, et iaculis nunc facilisis vitae. Sed quis semper dolor, id efficitur ex.