Service of lab equipment

Excellent service. Friendly and professional service was provided in a timely manner to the expected standard.
NathanM-270
Excellent service. Friendly and professional service was provided in a timely manner to the expected standard.
NathanM-270
Excellent communication. Updates given well in advance. Very polite staff and engineers.
NathanM-270
2 people helped with the install of a Multisizer 4e. They were both very professional and friendly, answering any questions that I had. The installation was quick and the attention to good documentation practice was exceptional.
Chloel-9
Always a pleasure to welcome the Meritics service engineer, who is knowledgeable, personable and extremely competent.
NeilT-394
Friendly and collaborative staff, provided a very good service.
SamK-403
We had issues with one of the aperture tubes provided by Meritics on a Friday afternoon, while very pressed for a review deadline. Meritics handled our inquiries very fast and professionally and helped us out by shipping us their spare tube to use in the mean time free of charge, while we waited for our new tube to arrive. Communication was very pleasant.
VeerleB

Determining the particle characteristics of various products and biological materials is increasingly reliant on the measurement of particle concentration, alongside particle size. It is a crucial metric in a range of industries and academic studies, where products are manufactured to microscopic parameters or where quality assurance – or research – must be maintained and carried out at a molecular level.
The process of measuring particle concentration is important to researchers and engineers in biopharmaceuticals, protein aggregation studies, nanomaterial characterization, and more..
This article will explore in more detail the various industries and schools of research which measure particle concentration:.
Nanomaterials are commonly referred to as a material with particles of nanoscale dimensions of between 1 – 1000 nanometers (nm). In 2011, the European Commission clarified that definition to include specific requirements of particle concentration for a material to be categorically defined as nanomaterial. It describes a nanomaterial as: “A natural, incidental or manufactured material containing particles, in an unbound state or as an aggregate or as an agglomerate and where, for 50 % or more of the particles in the number size distribution, one or more external dimensions is in the size range 1 nm – 100 nm.”.
Precise measurement of particle concentration is required to ensure that any new materials are correctly identified and regulated accordingly. This is a crucial metric for materials scientists in a range of fields to consider..
Studying the particle concentration of cell biology allows scientists and researchers to accurately assess drug delivery and optimize biological responses to drug administering by measuring the particle concentration of the delivery vector. It can also help industry leaders to understand drug stability under a range of environmental factors such as temperature and humidity, influencing best practice on how to manufacture and administer a wide range of pharmaceuticals..
Laboratory tests that measure the particle concentration and size of antibodies, white and red blood cells, and platelets in a blood sample are commonly performed in the development and manufacture of vaccines, particularly in the assessment of vaccine dosages and their subsequent performances. It is a crucial factor in the evaluation of immunization success and the analysis of perceived biological resistances.
Despite innovations in emergent materials for use in a range of commercial and emergency service sectors, natural sediments and soils are still a primary material for the implementation of flood protection, foundation-laying for construction, and of course, agriculture. Measuring the particle concentration of soil helps to characterize the applications of various soil samples, for example in the distinction of soil types ideal for drainage and aeration from those that are highly compatible with various crops.
Specialists in the water treatment sector are required to perform consistent and precise assessments of the cleanliness of drinking water for human consumption. Dedicated metric hardware that analyses the particle concentration of drinking water can quickly determine that samples are free of contaminants, including solids and bacteria, ensuring that water treatment is carried out to stringent industry standards.
Meritics is the UK’s leading supplier of particle characterization instruments and laboratory services, with a range of accurate and reliable equipment that is applicable to many disparate fields. These include:
If you would like any more information on the applications of the particle concentration analyzers we supply, please do not hesitate to get in touch.

Rheology refers to the analysis of a fluid’s flow or plastic deformation properties relative to shear forces such as rotational torque. It measures the material transportation properties of liquids, solutions, and slurries under distinct mechanical conditions, and enables analysts to accurately plot flow curves and yield points for a range of fluidic materials. This information provides mechanical insights into the coating and flowing properties of numerous commercial and industrial products, from agrochemicals to personal cosmetics.
To assess the rheological properties of a sample, Meritics provides the RM200 PLUS rheometer. This easily-programmable rotational stress rheometer can intuitively measure flow curves of samples with a built-in thermocouple capable of assessing temperatures between -50°C – 300°C.

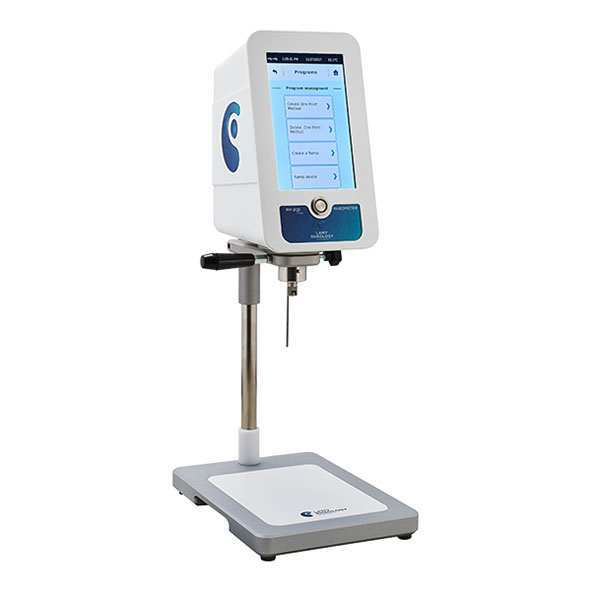
Rheology at your fingertips
Thanks to its large storage capacity and its easy programming, the RM200 PLUS allows you to realise all your measurements of flow curves, yield point, thixotropic, fitting without software.
Save your flow curves and calculate your rheological parameters directly without a computer (Plastic viscosity, flow limit, thixotropy, regression model according to Newton, Bingham, Casson and Ostwald). Choose your attachment system tailored to your product constraints.
Contact us for a quote or to discuss your rheological analysis needs.

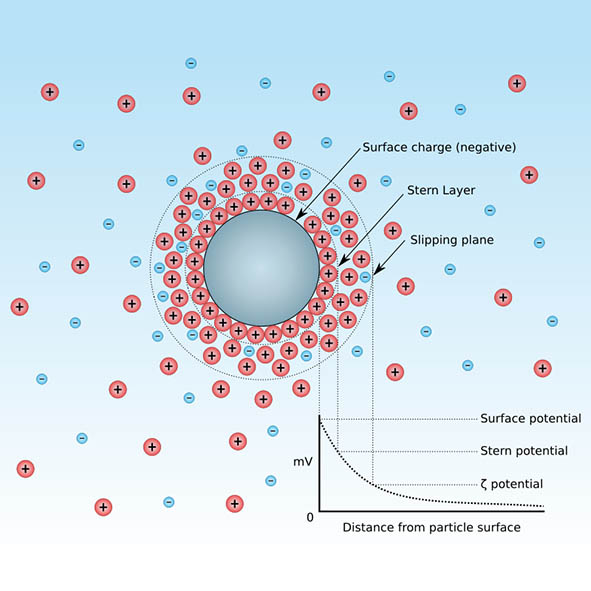
Zeta potential is also known as the electro-kinetic potential of a colloid. It refers to the charge repulsion / attraction of particles dispersed in a solution, and is measured by applying an electrical field to the dispersive medium. Researchers commonly perform zeta potential measurements to ascertain the longevity and mechanical stability of a particulate solution, and to establish particle agglomeration characteristics for pharmaceuticals, food products, and more. The DelsaMax Pro is a rapid zeta potential analyser capable of measuring sample volumes as small as 45 microliters (μL) in under a second. This speed of measurement is crucial for maintaining sample stability and supporting zeta potential characterisation of fast-moving consumer goods, as overlong exposure to electrical fields can cause analytes to degrade – reducing experiment throughput and results accuracy.
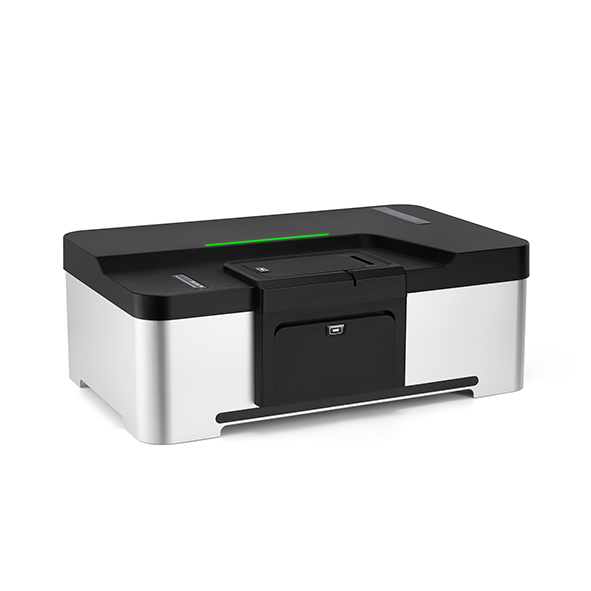
The BeNano Series is the latest generation of nanoparticle size and zeta potential analysers designed by Bettersize Instruments. Dynamic light scattering (DLS), electrophoretic light scattering (ELS), and static light scattering (SLS) are integrated into the system to provide accurate measurements of particle size, zeta potential, and molecular weight. The BeNano Series is widely applied in academic and manufacturing processes of various fields including but not limited to: chemical engineering, pharmaceuticals, food and beverage, inks and pigments, and life science, etc.
Contact us for a quote or to discuss your zeta potential analysis needs.

Powders and granular materials can acquire an electrical charge on the surface of their particles due to contact and movement against handling equipment and containers. Contact and movement of particles within the material itself can also cause charge acquisition. This process is called tribocharging.
It is important to measure particle charge as charge acquisition can lead to problems and unstable behaviour. Charged materials stick to processing equipment and containers, can become airborne more easily, and can flow in different ways than materials with no charge. Many researchers believe that material electrical properties are the most important contributors to powder flow behaviour.
The Mercury Revolution and Volution powder analysers provide particle charge assessments of powdered solid particles during dynamic and stable states when in contact with many different surfaces, including stainless steel, glass, and aluminium.
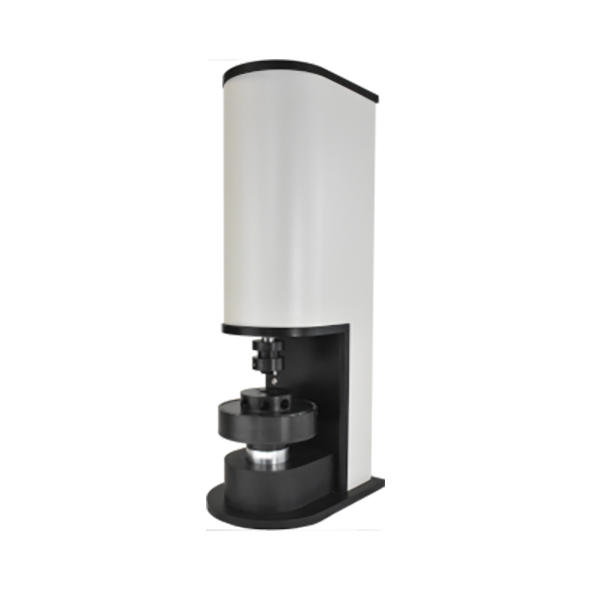

Flowability is the capacity to move by flow that characterises powders, i.e. loose particulate solids, as well as fluids. If you need an affordable, easy-to-use method to measure the flow properties and bulk characteristics of your powder then you need to be aware of the Volution Powder Flow Tester.
The Volution Powder Flow Tester uses an annular shear cell to measure a powder’s response to consolidating pressure using the yield locus technique. This approach, in conjunction with the instrument’s heavy duty frame and drive system, allows the Volution Powder Flow Tester system to measure powder samples at pressures up to 250kPa (50kg force). This is around 6 times greater than other instruments, which are often more expensive as well.
Cohesion is a measure of particle to particle bonding strength that results from inter-particle forces generated by factors such as electrical charges, moisture and van der Waals forces.
The angle of internal friction is a measure of the force required to cause particles to slide or move or on each other and is influenced by many parameters including particle surface friction, particle shape, hardness, particle size, etc. distribution, etc. As well as the cohesion and angle of internal friction of the material the Volution Powder Flow Tester can also measure wall friction, time consolidation and unconfined yield strength.
The Volution Powder Flow Tester also has built in temperature and relative humidity sensors, which means it will also automatically weigh the sample to provide density and compressibility measurements. Flow functions can be measured by testing the material at different pressures.
Meritics can provide this level of functionality at such low cost because design and engineering all takes place in house, thanks to their experience gained over 20 years in the industry. Due to the geometry of its test cell, the Volution can test granular materials as well as powders, which other shear testers cannot, as the test cells for other instruments are too small. With the ION Charge Module you can even measure powder charge too.
Contact us for a quote or to discuss your particle charge analysis needs.
Powder flow property measurements generally fall into two main categories: dynamic analysis and static analysis. Dynamic instruments measure powder flow properties as the test material is moving or is about to move.
Static instruments measure powder that is not moving and typically has been exposed to pressure. For a complete picture of a material’s flow behaviour, both types of testers are required. For solving specific flow problems, usually one type of tester or test is required.
The Revolution Powder Analyser can measure your powder’s ability to flow, consolidate, granulate, cake, pack and fluidise by measuring the power, time and variances in power of your powder in a rotating drum. This data can be used to quantify your powder’s particle behaviour during process applications such as blending, tableting, mixing and transportation. The Revolution is both easy to load and automatic, eliminating the opportunity for human error.
The REVOLUTION Powder Analyser consists of a rotating drum that measures the flow properties of granular and fluidised materials. Several drum sizes are available, from drums requiring 10 cc’s of sample to drums using 500 cc’s.
A stepper motor turns high precision silicone rollers which in return rotates the drum. The operator can set the drum rotation rate (range 0.1 to 200 RPM) and prep time (range 0 to 999 seconds) of the analysis. A digital camera with the assistance of back-light illumination takes digital images of the powder during the rotation process. The images can be accumulated up to a rate of 30 frames per second.
Using patent pending algorithms, the software measures the behaviour of the powder from the images collected due to the drum rotation and how this behaviour changes over time. This data is then used to calculate various parameters representing the powder’s quality and process ability.
Contact us for a quote or to discuss your particle charge analysis needs.
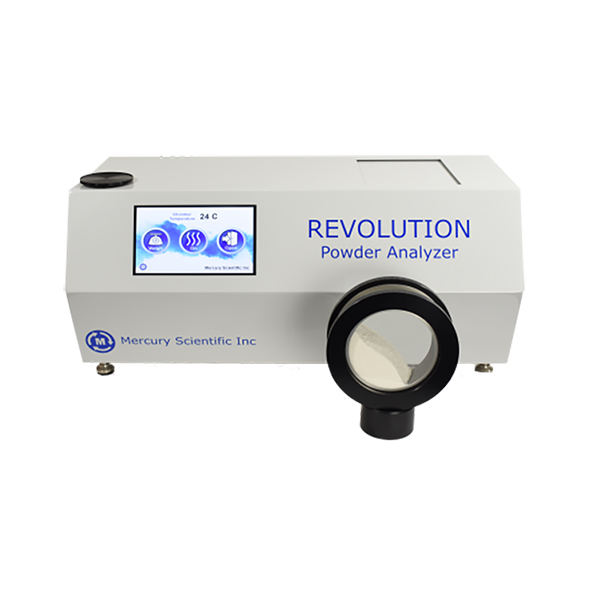
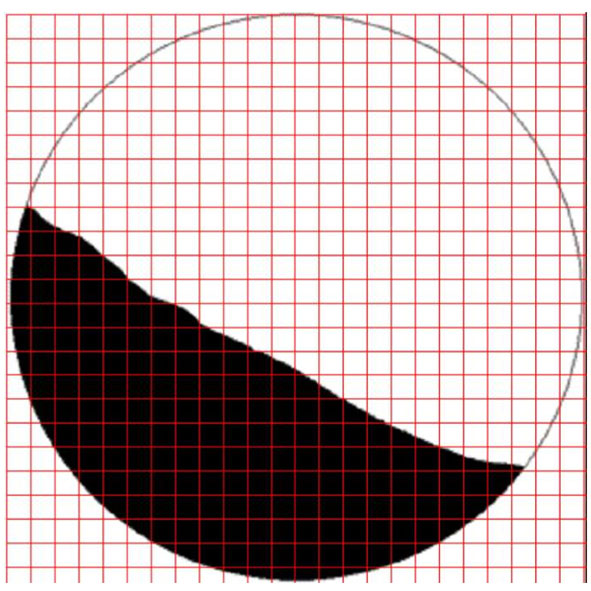

The flowability of bulk powdered solids is a crucial parameter for determining an analyte’s proclivity to conglomeration or fluidisation under distinct conditions.
Motion and pressure can cause bulk powders to undergo complex pseudo-phase transitions depending upon the molecular composition and particle geometry of the sample. Particle flow analysis is used to capture imagery of powders under defined mechanical conditions and to characterise the flow characteristics of the material as a proportion of potential energy to flow capacity, and cohesion relating to inter-particle forces.
Meritics supplies a broad range of powder flow analysers for determining the flowability and caking capacities of bulk powders. The Mercury Revolution is an advanced powder flow analyser for assessing the dynamic properties of samples at rotational speeds of up to 200 RPM. The Volution Powder Flow Tester uses an annular shear cell to assess a powder’s physical responses to consolidating pressures of up to 250 kPa.
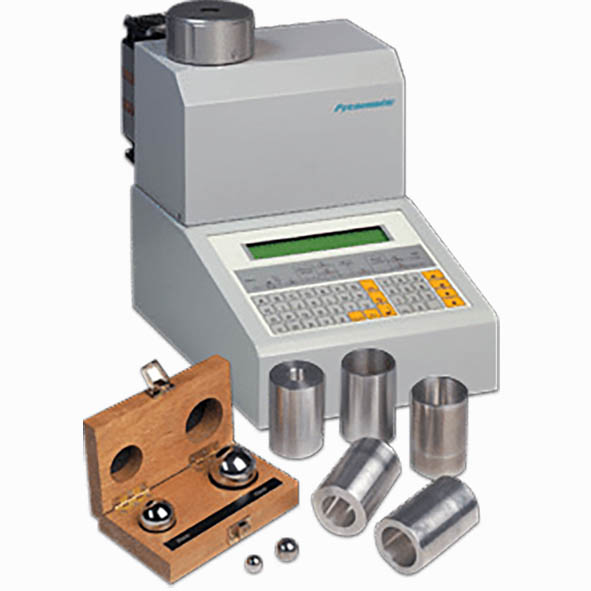
Absolute density of solids and powders is commonly measured through pycnometry, which uses gas displacement to determine the particulate density and purity of compact and granulated solid samples. This method uses a test gas with minute atomic dimensions such as helium to permeate the porous structures of a dry powder or solid sample. The small atomic size of helium enables the test gas to diffuse through extremely narrow pores, providing a volumetric measurement that can be compared to the weight of the dried sample to characterise the real or absolute density of the sample.
Powder flow property measurements generally fall into two main categories: dynamic analysis and static analysis. Dynamic instruments measure powder flow properties as the test material is moving or is about to move.
Static instruments measure powder that is not moving and typically has been exposed to pressure. For a complete picture of a material’s flow behaviour, both types of testers are required. For solving specific flow problems, usually one type of tester or test is required.
Contact us for a quote or to discuss your powder flow analysis needs.
The Revolution Powder Analyser can measure your powder’s ability to flow, consolidate, granulate, cake, pack and fluidise by measuring the power, time and variances in power of your powder in a rotating drum. This data can be used to quantify your powder’s particle behaviour during process applications such as blending, tableting, mixing and transportation. The Revolution is both easy to load and automatic, eliminating the opportunity for human error.
The REVOLUTION Powder Analyser consists of a rotating drum that measures the flow properties of granular and fluidised materials. Several drum sizes are available, from drums requiring 10 cc’s of sample to drums using 500 cc’s.
A stepper motor turns high precision silicone rollers which in return rotates the drum. The operator can set the drum rotation rate (range 0.1 to 200 RPM) and prep time (range 0 to 999 seconds) of the analysis. A digital camera with the assistance of back-light illumination takes digital images of the powder during the rotation process. The images can be accumulated up to a rate of 30 frames per second.
Using patent pending algorithms, the software measures the behaviour of the powder from the images collected due to the drum rotation and how this behaviour changes over time. This data is then used to calculate various parameters representing the powder’s quality and process ability.

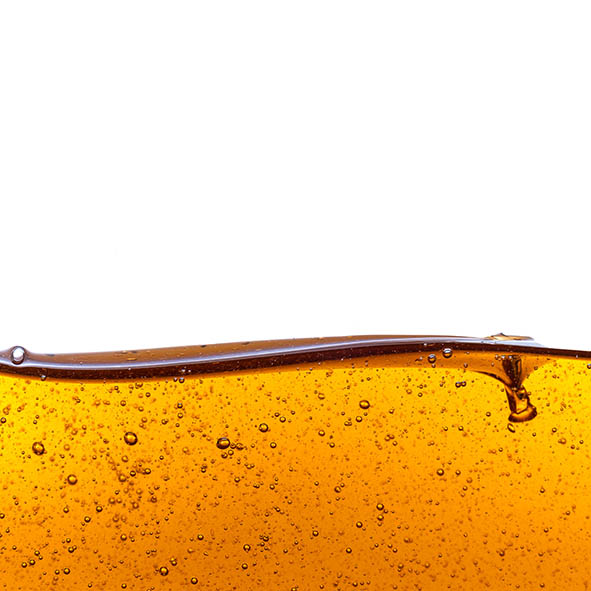
Viscosity is a measure of a fluid’s resistance to flowing under varying temperature conditions.
It is typically associated with the concept of liquid density or thickness, and usually increases exponentially with decreased temperatures. This property is determined by friction between particles within the liquid or solution and is quantified as a measure of centipoise (cP). Viscosity measurements apply relatively weak thermodynamic forces to a liquid or solution to encourage the material to flow. Temperatures can be increased and torque can be applied to measure the material’s resistance to these conditions, with common applications in the food and beverage, cosmetics, and chemical sectors.
Meritics provides a substantial range of viscosity analysers suitable for a broad range of applications. The RM 100 Portable enables analysts to measure viscosity outside of laboratory conditions with a sustained accuracy of within 1% of the full scale. The First Plus is an ultra-sensitive viscosity analyser with a torque range as low as 0.005 mNm for outstanding precision..
Unique design removes the problems associated with spring type viscosity measurements. This makes the Lamy range very robust and replacing expensive springs and pointer assembles are a thing of the past!
For ultra-sensitive viscosity measurements, the First Touch features a torque range of 0.005 to 0.8 mNm
With its expanded programming possibilities and increased modularity, the FIRST PLUS will be the ideal tool for your application whether you use it alone or with its software.
Delivery as a single unit or with the spindle sets L1-L4 or R2-R7.
Contact us for a quote or to discuss your particle analysis needs.

Meritics can help you analyse cosmetics.
Formulators working in the cosmetics and personal care industries have numerous delivery vehicles from which to choose when formulating skin care products: emulsions, gels, sticks, mousses, aerosols, and ointments all have specific benefits. However, the emulsion is by far the most popular because it offers almost unlimited versatility in meeting the primary market objectives of efficacy, aesthetics, and cost parameters.
As we will explore in this Application Note, nuclear magnetic resonance (NMR) relaxation is a technique that is easy to employ, produces rapid results, and requires limited input data. Importantly, because it does not make any assumptions about the composition of the formulation and requires little, or no, sample preparation this makes it an ideal technique for measuring finished commercial products.

In general, the composition of commercial
pigment dispersions – to produce, for
example, paints and inks – is complex and
typically comprises a fluid, a dispersant, a
polymeric resin and the pigment material. In
the preparation of aqueous dispersions, a
wetting agent may additionally be needed if
the pigment materials are hydrophobic.
NMR spectroscopy is one of the most
powerful analytical tools used to probe
details of the structure and dynamics of
molecules. Traditional devices employing
NMR technology require very high magnetic
fields and, hence, very large magnets and
related instrumentation. However, the
advent of small powerful magnets has
allowed instruments – such as the Mageleka
MagnoMeter XRS™ – to be designed that
have small footprints and are suited to
normal, routine laboratory analysis.

Reducing the particle size of materials
possessing poor solubility characteristics
can be an avenue to substantially
increasing the total surface area of the
material. This concept can be illustrated
when formulating drug products that contain
active pharmaceutical ingredients (APIs).
A larger surface area allows for much
faster dissolution of APIs and, thereby, an
increase in bioavailability, regardless of the
route of administration. This is of obvious
importance in manufacturing because low
active bioavailability of drugs can lead to
inefficient treatment and risk of toxic side
effects. Any increase in efficacy can reduce
the potential toxicity because less drug
substance is needed, which also serves
to reduce costs. There is also a growing
body of evidence that, specifically with
nanoparticulate API materials, it is the
particle surface area and not particle size
that is the defining metric that controls
toxicological interaction. This explains
the recent drive to develop reformulations
based on nanotechnology.
So, what technique can make fast, reliable,
direct measurements of wetted surface
area in any suspension and, particularly,
nanosize API dispersions? Nuclear magnetic
resonance (NMR) relaxation, which is the
basis for Mageleka’s MagnoMeter XRS™,
can directly measure the wetted surface
area of any particulate suspension.

The application performance of any pigment
is determined by its nature, including how it
was manufactured, and the level of dispersion
achieved in formulation. The most important
physical properties include particle size and
wetted surface area. The finer the particle size,
the more intense will be the color; the greater
the surface area, the greater will be the extent
and uniformity of surface coating. For industries
that must produce products with reliably
consistent colors, measuring particle size and
wetted surface area quickly and easily will aid
in more efficient formulation and help to reduce
production costs.
So, what technique can make fast, reliable,
direct measurements of wetted surface area
in any suspension and, particularly, nanosize
pigment dispersions? Nuclear magnetic
resonance (NMR) relaxation, which is the
basis for Mageleka’s MagnoMeter XRS™, can
directly measure the wetted surface area of any
particulate suspension.

The preparation of any suspension or slurry
comprising a powder material in a liquid, be it
for “blue sky” experimental R&D purposes or
in the pre-formulation of a commercial product,
will always start with a solid and a liquid.
Unfortunately raw materials are never 100%
pure, and this is true even for National Formulary
(pharmaceutical)
grade
material. Indeed,
industrial material can contain as little as 80%
of the active component, as a cursory glance at
the typical Material Safety Data Sheet and the
Technical Data Sheet, always supplied with the
material, will attest to! In all cases, the type and
level of impurities depends on the source of the
material and any subsequent processing.
NMR spectroscopy is one of the most powerful
analytical tools used to probe details of molecular
structure and dynamics. Devices employing NMR
technology require very high magnetic fields and,
hence, very large magnets. However, the advent
of small powerful magnets has allowed low-field
instruments, such as the Mageleka MagnoMeter
XRS™ Relaxometer, to be designed that have
small footprints and so are suited to normal,
routine laboratory analysis.

Yeast levels in pitch tanks for craft beers are typically in the 1B/ml plus range. Therefore a protocol that minimizes steps, errors introduced during pipette steps and minimizes cost to craft breweries is detailed in this SOP.

Measurement of algal growth parameters
such as cell size, cell number, and growth
rate is important for confirming optimal
growth conditions and culture health. One
of the best ways to simultaneously assess al
gal culture health is to take a series of cell
size and number measurements during their
growth cycle. The simplest method to do this
is to use the Coulter Principle.
The Moxi Z mini automated cell counter
provides a valuable three-parameter cell as
say (count, sizing, health) in just 8–15 sec
onds. Leveraging the single-cell resolution
of the Coulter Principle, this information
is provided with a degree of precision and
accuracy rivaled only by higher-cost count
ing systems. However, the Moxi Z achieves
this performance with enhanced usability,
increased functionality, and a maintenance
free operation.

Solid materials are regularly characterised relative to their density, which is expressed as the mass of a powder or solid material per unit volume. Density analysis is regularly acquired using a form of gas displacement, which can rapidly determine the real density and purity of solid materials such as ceramics, metals, and polymers.
The Thermo Scientific Pycnomatic is a comprehensive solution for performing density measurements of solid materials. It features a fully-integrated, high-precision temperature control for exceptional results reproducibility. It boasts a real multi-volume capability for utmost accuracy of results with different solid materials, including fine powders and foams.
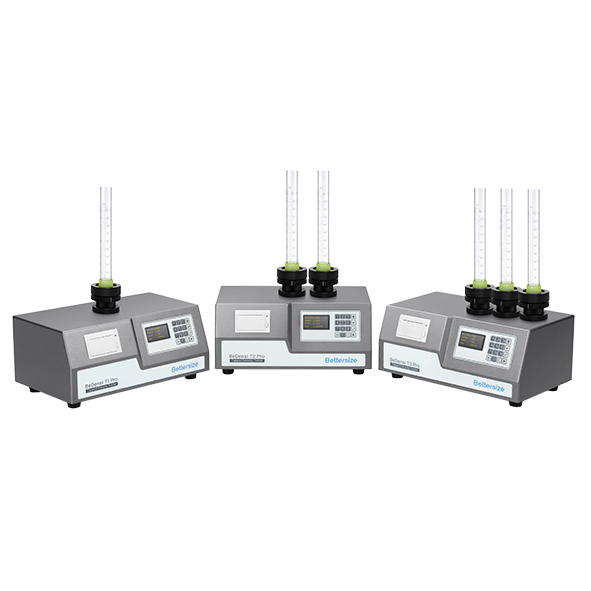
The BeDensi T Pro series is a reliable tapped density analyser that excels at intuitive operation while complying with the USP, EP, ASTM, and ISO standards. It can measure the bulk density and tapped density with less than 1% repeatability variation to help users to understand the flowability of a wide variety of powder materials.

Scientists expend significant time, labor and resources on
maintaining consistent, healthy cell cultures to support
their research efforts.
In addition to the initial, significant
expenditures for core equipment, there are substantial
recurring costs for materials that ensure optimal culture
environments including sterilized consumables, media, reagents
and growth factors. Beyond material costs, successful cell
culture requires proper training and attention to ensure aseptic
technique and use of cell-specific growth/treatment protocols.
Similar to visual
inspection of morphology and media color/composition,
this test is performed automatically with every Moxi Z cell
count, without the need for additional reagents.

Variations in core blood cell metrics such as white blood cell (WBC) counts and mean corpuscular volum (MCV) can be important idicatoprs of pathologies including infection, anemia, poisoning and disease.
By
applying established preparation protocols to whole blood samples, Moxi Z can generate important metrics from
blood samples for non-clinical analysis including red blood
cell (RBC) counts, mean corpuscular volume (MCV), white
blood cell (WBC) total counts and peripheral blood
mononuclear cell (PBMC) size distributions and counts.

Reactive Oxygen Species (ROS) are oxygen containing “free radicals”, a group of molecules that are highly reactive due to the unpaired elecytrons they contain.
In this application note we demonstrate how Orflo’s Moxi GO II Flow Cytometer can be applied to a wide range of cellular analysis, including ROS level measurement.

Mitochondria anre the principle organelles underlying cellular metabolism, servicng as the “energy factories” for the cell.
In this application note we show how Orflo’s Moxi GO II Flow Cytometer can be applied towards the tracking of cellular mitochondrial potential in response to the applications of two pharmacological agents, sodium azide (“azide”) and camptothecin.

Surface area analysis is a common particle measurement methodology that provides data relevant to a material’s adsorption and dissolution properties, as solid particles primarily interact with other media through their surface area. It is possible to determine multiple characteristics of solid materials by assessing the volume of an inert gas that it can adsorb, and the pressure required to push the gas into a porous structure. It is also possible to assess the interaction of gases with the free surfaces of powder particles. Both techniques provide critical insights for manufacturing of dosage form pharmaceuticals.
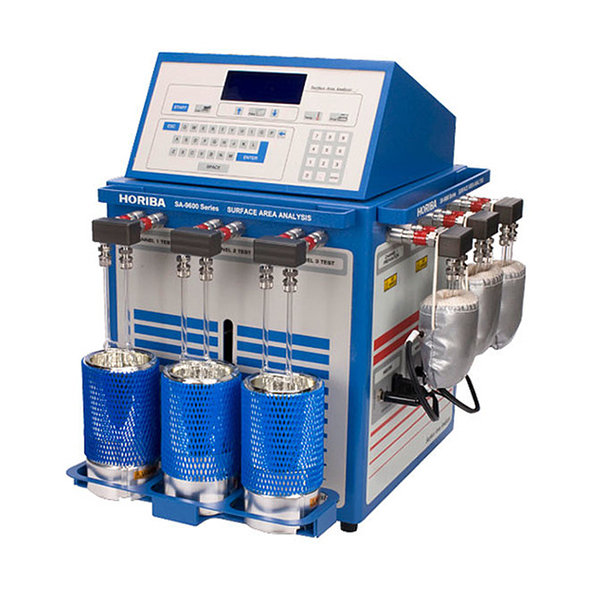
The Horiba SA-9600 series is suitable for both single- and multi-point surface area analysis with a range of 0.10 – 2,000 square meters per gram.
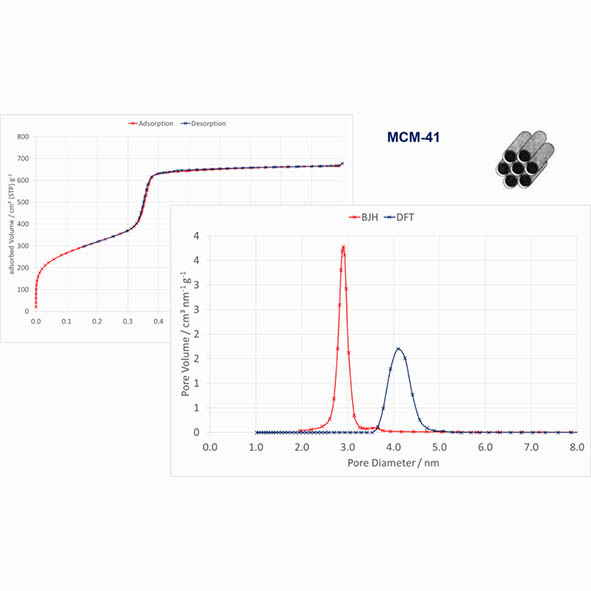
Brunauer-Emmett-Teller (BET) surface area analysis is the multi-point measurement of an analyte’s specific surface area (m2/g) through gas adsorption analysis, where an inert gas such as nitrogen is continuously flowed over a solid sample, or the solid sample is suspended in a defined gaseous volume. Small gas molecules adsorb to the solid substrate and its porous structures due to weak van der Waals forces, forming a monolayer of adsorbed gas. This monomolecular layer, and the rate of adsorption, can be used to calculate the specific surface area of a solid sample and its porous geometry, informing studies into the reactivity and bioavailability of pharmaceutical products.
The Horiba SA-9600 can measure BET surface area at a range of 0.10 to > 2,000 m2/g for intervals of just 6 minutes.
Contact us for a quote or to discuss your particle sizing needs.

Particle morphology refers to its form, shape, and its physiochemical or biochemical structure. Analysing particle shape and morphology can provide significant insights into the characteristics of a material and its practical applications, as well as its genesis.
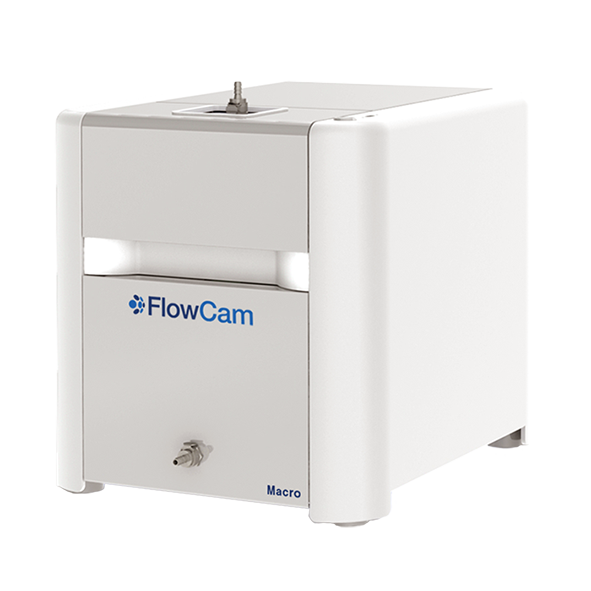
There are numerous applications for the observation of particle shape and morphology, including the assessment of drug efficacy and quality control of industrial surface treatments. The FlowCam series of particle counters is equipped to perform particle shape and morphology analysis, with additional parameter considerations for application-specific purposes. Sub-visible proteins of below 10 micrometers (μm) can be quantified using the FlowCam Biologics, while larger particles of between 50 µm – 5000 µm can be morphologically measured using the FlowCam Macro.
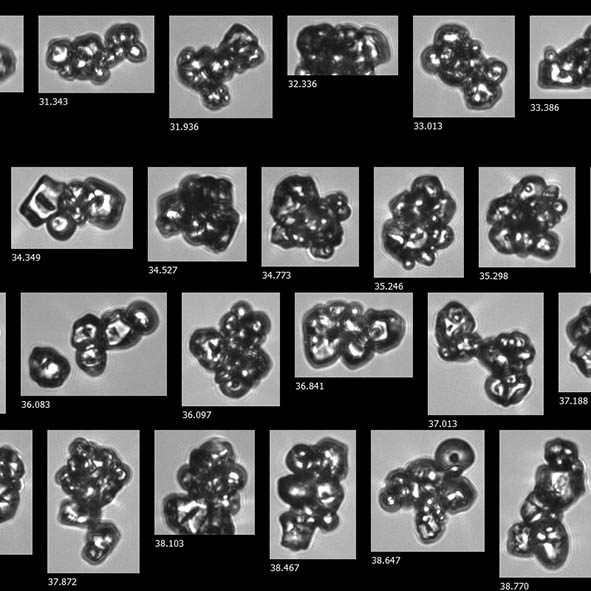
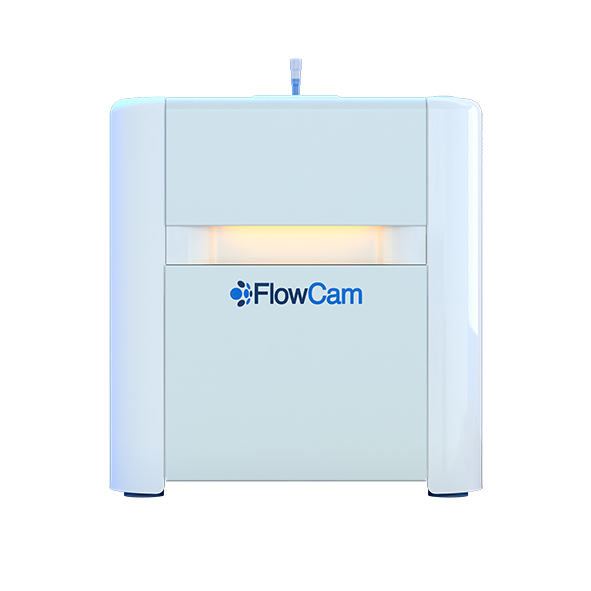
Today microscopic examination and counting and sizing of small particles is commonplace, Meritics work with Yokogawa Fluid Imaging Technologies (YFIT) and their FlowCam Image Analyser range can size from 300nm to 5mm in range, this takes the tedium involved away and frees up the scientist to analyse data comprehensively.
Electron microscopes probe the size range below the limit of optical microscopy and a scanning technique enables pictures of the surface features of even very delicate surfaces to be made in exquisite detail.
Most recently our scientists have been sizing sugar samples on the FlowCam 8000 to measure the size and to give an image of the particles.
Contact us for a quote or to discuss your image analysis needs.

Particle Count Analysis is a broad field of particle analysis, using multiple techniques and methodologies to acquire data about the density and concentration of solid, liquid, or gaseous particles in a sample. High-sensitivity imaging technology, electrical sensing zone (ESZ) techniques, and light obscuration methods are all used to measure the concentration or volume of particles, with proven applications in material characterisation and environmental studies.
At Meritics, we provide Laboratory Analysis using a range of particle counters, including the Multisizer 4e which uses Electrical Sensing Zone analysis; the Spectradyne nCS2 uses resistive pulse sensing to count and size from 2um down to 50nm and the FlowCam range which uses Dynamic Imaging.
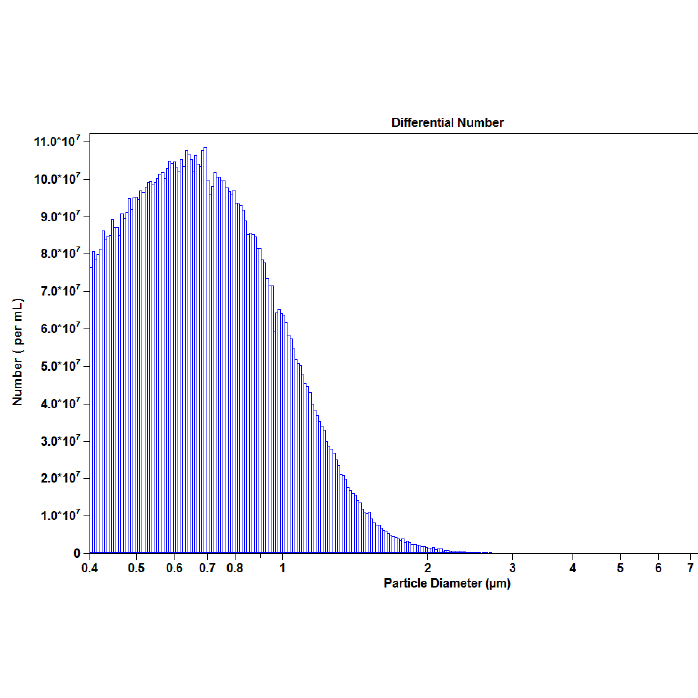
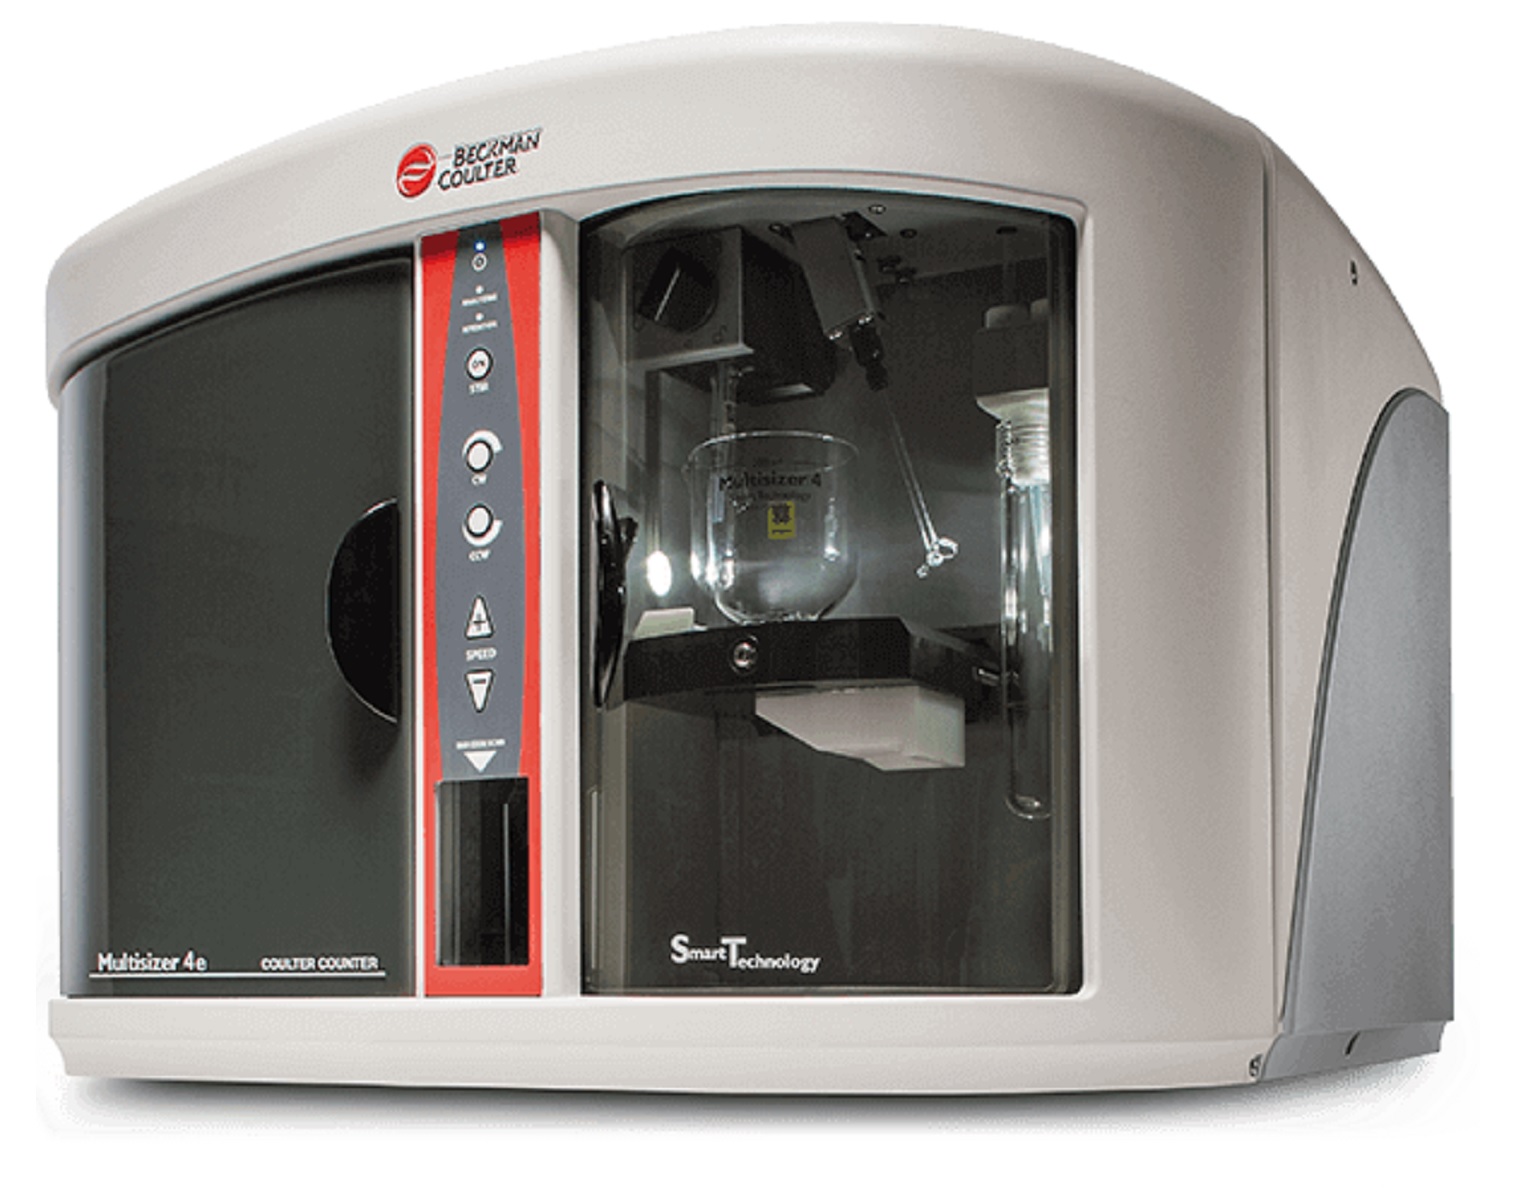
Beckman Coulter Multisizer 4e, with a range of 0.2µm to 1600µm is widely used in many areas: Life Sciences such stem cells, cell biology, and Industrial such as toner, ceramics, sediments etc. as well as Pharmaceutical applications.
The Coulter Principle (also known as ESZ – Electrical Sensing Zone) is hailed as probably the most significant advance in the field of particle technology, and tens of thousands of Coulter Counter instruments are in regular use worldwide.
Most recently our scientists have been running a lot of water samples on the Multisizer 4e to measure contaminants.
Contact us for a quote or to discuss your particle sizing needs.
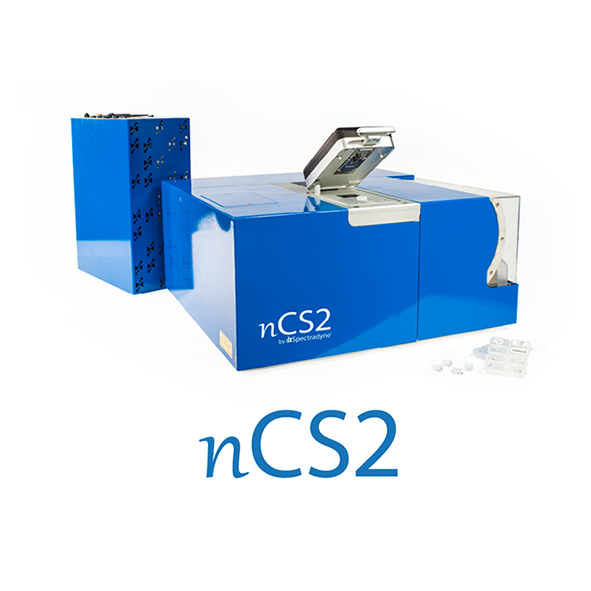
The Spectradyne’s nCS2 TM has taken the Coulter Counter method and re-engineered the principle, it is now possible to count and size individual particles down to 50nm.
The Spectradyne nCS2TM instrument provides a unique platform for the rapid quantitative measurement of Nanoparticle size in solution.
The instrument measures individual nanoparticles to produce particle size distributions with quantitative concentration information for particles from 40nm to 2000nm in size. Not relying on optical technology, the Spectradyne system can be used for protein aggregation studies, extracellular vesicle analysis, nanomedicine, virus studies etc.
Disposable microfluidic cartridges eliminate cross contamination and make operation simple and straightforward from just 2-3µl of sample.
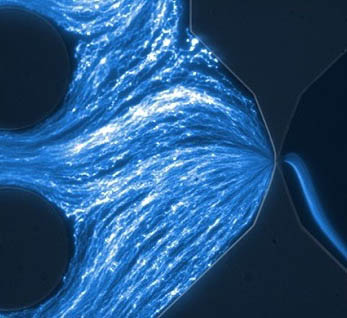
Spectradyne’s nCS1 instrument and associated analysis cartridges, are based on Spectradyne’s patented nanoparticle analyzer (NPA) technology. The heart of the instrument is the microfluidic cartridge, which allows the electrical detection of nanoparticles as they pass one by one through a nanoconstriction. Particles larger than the nanoconstriction are removed before reaching it by filters that are built into the cartridge.
No pre-filtering of the sample is required by the user.
Contact us for a quote or to discuss your particle sizing needs.
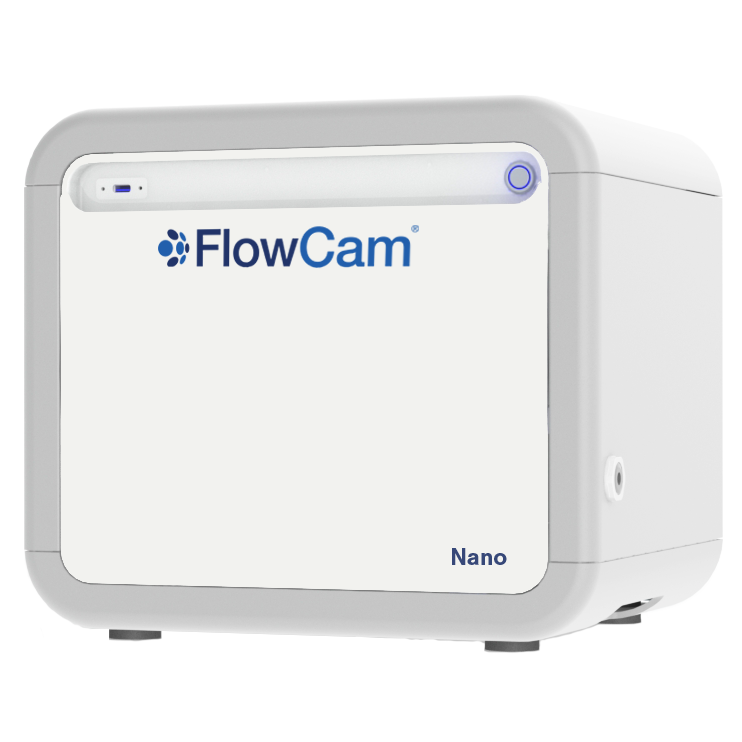
Today microscopic examination and counting and sizing of small particles is commonplace, Meritics work with Yokogawa Fluid Imaging Technologies (YFIT) and their FlowCam Image Analyser range can size from 300nm to 5mm in range, this takes the tedium involved away and frees up the scientist to analyse data comprehensively.
Electron microscopes probe the size range below the limit of optical microscopy and a scanning technique enables pictures of the surface features of even very delicate surfaces to be made in exquisite detail.
Most recently our scientists have been sizing sugar samples on the FlowCam 5000 to measure the size and to give an image of the particles.
Contact us for a quote or to discuss your particle sizing needs.

Peripheral Blood Mononuclear Cell (PBMC) purifications are a critically important cell preparation in a broad range of research and clinical studies including such profound applications such as HIV research, cancer immunotherapy, cord blood banking, regenerative medicine and fundermental studies of cytokine-based immune responses.
In this application nmote we demonstrate how Orfl’s Moxi GO II can be applied towards the characterisation on PBMC preparations.

At the core of the brewing process is the conversion of sugar into alcohol by yeast. Beyond the initial selection of the yeast strain, the understanding of the shifting characteristics of the yeast in the wort, relative to the constant-changing environmental conditions, is critical. At a bare minimum brewqers need to maintain proper concentrations of yeast throughout the process by adding or “pitching”, yeast at various timepoints. The Moxi GO II is ideally and uniquely suited to enabling yeast monitoring in brewing.

Cell transfection and transduction refer to an array of techniques used to introduce foreign genetic material, or cloning vectors, into cell genomes.
Orflo’s Moxi GO II is ideally and uniquely suited to fulfilling researchers needs for transfection monitoring

Cellular Aptosis is a sophisticated mechanism employed by cells to carefully control death in response to cell injury. Commonly referred to as “programmed cell death”, apoptosis progresses through a systematic signalling cascade that results in characteristic, directed morphological and biochemical outputs in the cell.
Orflo’s Moxi GO II is ideally and uniquly suited to fulfilling researchers needs for apoptosis monitoring.

Caking or the bonding of particles due to inter-particle cohesion has a huge effect on the behavior of
powders. Strong bonds between particles can prevent materials from exiting silos and storage
containers. However, under dynamic conditions, caking can actually improve the flow properties of the
material. Caking in powders occurs in two ways. Under static conditions as in storage containers and
silos, caking occurs due to particles being pressed together by the force of gravity acting on a column
of material or by external forces. Generally the stronger the forces acting on the material the stronger
the bonds between cohesive particles. Under dynamic conditions, caking occurs due to particles
smashing together as they flow. This type of caking is also referred to as agglomeration, clumping or
granulation. Dynamic conditions are defined as situations where a powder is moving under the
influence of gravity or by mechanical convection. In industry, powders are typically stored under static
conditions but are used under dynamic conditions. Therefore, the characteristics of the material after
storage under static conditions as well as the stability of the material under dynamic conditions are
critical to the successful use of the material. In this study, the effects of caking under static and
dynamic conditions on the dynamic flow characteristics of powders are analyzed. Powders with
different degrees of inter-particle cohesion are studied using uni-axial compression to simulate static
conditions and a rotating drum to simulate dynamic conditions. The assessment of the inter-particle
cohesion of the material is achieved by measuring the unconfined yield strength of the material after a
consolidating stress has been applied. It is found that caking due to inter-particle cohesion under both
static and dynamic conditions directly affects the dynamic flow characteristics of powders and also can
create instabilities in these characteristics as the materials are subjected to dynamic forces. The
dynamic flow characteristics measured include avalanche energy and dynamic density. It is also found
that the level of caking in a powder can be assessed by measuring the changes in its dynamic flow
characteristics before and after exposure to static and dynamic conditions.

Analysing Static Charge has never been easier. The Revolution Powder Analyser has been used extensively to test the flow properties of metal and polymer powders used for additive manufacturing applications. The tests that have been proven to be suited to additive manufacturing applications include the flowability test, the packing test, the multi flow test, caking test,and the electrical charge analysis.

Powder properties play a critical role in the performance and reliability of additive manufacturing processes. Metal and polymer powders must flow consistently, pack effectively and behave predictably throughout the manufacturing process to achieve repeatable results.
Variations in powder flow behaviour can affect powder spreading, layer formation, packing density and ultimately the quality of the finished component. Understanding how a powder behaves before and during processing therefore helps manufacturers optimise their materials and improve process consistency.
The Revolution Powder Analyser has been used extensively to characterise the flow properties of metal and polymer powders used in additive manufacturing applications. Its range of powder testing capabilities provides valuable information about how materials behave under different conditions.
The flowability test provides an indication of how readily a powder moves under controlled conditions. This is particularly important for additive manufacturing, where consistent powder delivery and spreading are essential for producing uniform layers.
Differences in flow behaviour between powder batches can indicate changes in particle characteristics, moisture content, surface properties or other material parameters.
The packing test evaluates how effectively powder particles pack together. Packing behaviour can influence powder bed density and the way particles interact during processing.
Understanding packing characteristics can help manufacturers assess different powder formulations and identify materials that provide the consistency required for a particular additive manufacturing process.
The Multi Flow test provides additional information about powder behaviour under different flow conditions, helping users understand how materials respond as testing conditions change.
The caking test assesses a powder’s tendency to form agglomerates or cake during storage or handling. This can be particularly important for powders that need to maintain consistent flow properties between production, storage and use.
Electrical charge analysis provides further insight into powder behaviour. Electrostatic charging can influence how particles interact with equipment and with one another, potentially affecting powder handling, spreading and deposition.
By combining flowability, packing, Multi Flow, caking and electrical charge analysis, the Revolution Powder Analyser provides a comprehensive approach to understanding metal and polymer powders for additive manufacturing. These measurements can support material development, quality control, batch comparison and process optimisation, helping manufacturers achieve more predictable powder performance and consistent additive manufacturing results.

The Evolution Powder Tester is designed to measure the unconfined yield strength of powders and
granular materials quickly, accurately, and repeatably. The heart of the design is the analysis cell
The Evolution Powder Tester is used to compare the behaviour of materials under consolidated load. The
only other instruments available for this type of test are powder shear testers. The Evolution was
designed specifically as an alternative to shear testers for many reasons, download the full paper to the right:

New powder characterisation tests such as the rotating drum and the
Freeman FT4 rheometer have been introduced in recent years. These instruments have yet to be standardized for use with metal powders. Greg Martiska,
Mercury Scientific Inc., presented the results of testing with the Revolution
Powder Analyser and Joe Tauber, Kennametal Inc., presented data from testing with a Granudrum. The third workshop participant was Tim Freeman,
Freeman Technology, a Micromeritics company. He presented the test results
obtained using the FT4 rheometer.

Powders and granular materials are deceptively complex. Unlike liquids and solid materials, their behaviour can change significantly depending on how they are stored, handled, transported and processed. A powder that flows freely during one stage of a process may become cohesive, compacted, aerated or difficult to discharge under different conditions. Understanding these changes is therefore essential for maintaining consistent processing, product quality and reliable powder performance.
Powder flowability is governed by the interactions between individual particles, groups of particles and the surrounding gas. Particle size, shape, surface properties and density can all influence behaviour, while external factors such as pressure, humidity, temperature, shear and impact can alter the powder structure. Importantly, powders can also exhibit a ‘memory’ of their previous handling and storage conditions, resulting in changes such as caking, agglomeration, de-agglomeration, attrition and changes in effective particle size.
For this reason, a single measurement of powder flowability may not provide a complete picture of how a material will behave in a real process. Evaluating powders under different states and conditions can reveal how their properties change as they move between consolidated, unconsolidated and fluidised states. Dynamic testing can provide insight into the micro-structure and flow behaviour of a powder, while static testing can assess the strength and stability of its macro-structure.
This application note explores the principles behind powder and granular material flow behaviour and the range of testing approaches available using Mercury Scientific instrumentation. It examines how powder properties can be characterised under realistic conditions, including the effects of consolidation, storage, shear, vibration and fluidisation. The aim is to provide a more complete understanding of powder behaviour and help identify changes that could affect handling, processing and final product performance.

Powders and granular materials are made up of freely moving particles and air. For powders, the
particles are small, ranging in size from nanometers to microns. For granular materials, the particles are
typically in the millimeter size range. Because they are made up of freely moving particles and air,
powders and granular materials exhibit properties of both solids and liquids. Under certain conditions,
they may behave more like liquids and flow easily. Under other conditions, they may behave more like
solids and not flow at all or even become solid. In order to understand their behaviour, it is necessary to
measure how powders and granular materials behave under different conditions.

Powders used in the AM industry either they spread well or they do not. Poor powder spreading is due to
specific issues with the powder or printer parameters. Therefore, the specific spreadability issues must be
identified and quantified so that the root cause of the issue can be determined and corrected. Data is
presented in identifying and quantifying various spreadability issues including low layer density, low
layer thickness, non-uniform layer coverage, channeling, and layer waviness. The root causes of these
issues are determined, and corrective actions are presented.

Powders and granular materials are unique in terms of
industrial materials in that they can remember their stress
and environmental history. In other words, a powder can
change depending on how it is handled and stored. For
example, if a powder is stored in an industrial tote
containing a 1 ton mass, the gas in the powder will be
removed (compressibility) and the powder particles may
form large particles (agglomerates) due to the pressure
acting on the particles. If stored long enough in this way,
the powder may actually become a solid (caking). When the
pressure is removed, the powder may or may not go back to
its original condition before storage.

The ability of a powder to form a consistent layer in an additive manufacturing (AM) machine plays a critical role in producing high-quality parts. This property is known as powder spreadability.
Several definitions of powder spreadability exist. However, the industry has not yet reached a consensus on how to measure it. AM machines often use in-situ techniques to analyse powder layer formation. These methods mainly support process monitoring rather than predictive powder testing.
Researchers have proposed several tests and devices to assess powder spreadability.¹⁻⁴ These include automated test beds that spread powder across a test surface. Manual spreading devices can also replicate aspects of the powder deposition process.
Most spreadability tests use optical analysis to examine the resulting powder layer. This approach can reveal variations in surface coverage and layer uniformity. Some methods also measure the density of the powder layer. They do this by weighing the powder and calculating the volume of the spread layer.
However, spreadability does not depend on a single powder characteristic. Particle size, particle shape, density and surface properties can all influence how a powder behaves during spreading. Flowability also plays an important role. A powder must move consistently as the recoater or spreading mechanism distributes it across the build platform.
Good flowability does not always guarantee good spreadability. A powder may flow well under one set of conditions but behave differently during the spreading process. Factors such as powder packing, cohesion and particle interactions can affect the final layer.
For this reason, comparing powder flowability with spreadability can provide valuable insight into AM powder performance. Flowability tests can help identify differences between powders before they enter the manufacturing process. Direct spreadability tests can then show how those differences affect layer formation.
This application note compares the spreadability and flowability of metal powders used in AM applications. The results demonstrate how these two properties relate and highlight the value of characterising powder behaviour before production.

The spreadability of several metal powders manufactured for additive manufacturing applications is
measured for a range of layer thicknesses under different application conditions including a range of
spreading speeds, different spreader geometries, a range of powder feeding geometries and spreader
application pressures and different environmental conditions. The powder spreadability analyzer used for
the measurements is a new instrument commercially produced by Mercury Scientific Inc. Data presented
include spreading efficiency, mass per spreader travel and spreading uniformity per spreader travel.

Powders can change their flow properties as they are handled and used. They also can become more
sensitive to segregation on handling and environmental conditions. This means that a powder that has
been used or recycled may change its behaviour due to handling and environmental exposure more than
virgin material. This behaviour is evaluated by testing the flow properties of virgin and used Additive Manufacturing powders
with the Revolution Powder Analyser before and after exposure to segregation pressure and different
environmental conditions.
Rotating drum rheometers have been widely used to study powders for Additive Manufacturing applications for over 15 years and powders in general for roughly 40 years. The concept of studying powder flow behaviour in a
rotating cylinder or “drum” was presented in Kaye et al in 1995. Powder was placed in a clear
cylinder with a light source in front of it. An array of photocells was places behind the cylinder. The
cylinder or drum was rotated, and the sample powder would prevent or allow light from light source to
reach the photocells. In this way, the avalanching behaviour of the powder could be studied. This concept
was commercialised under the name Aero-Flow in 1996 by Amherst Process Instruments. As a result of
this detection method, the Aero-Flow could only measure the time between avalanches.
The best detection method to study powder in a rotating drum is naturally a digital imaging device.
However, in the 1990’s digital imaging devices and processing systems were expensive, and the time
required to analyse a single image was roughly 20 to 30 seconds. This situation changed rapidly at the
end of the 1990’s with increases in computer processing speed and development of inexpensive digital
imaging devices. A commercial instrument using a digital camera to image the powder in the drum was
developed by Mercury Scientific Inc. in 2002 and was commercialised under the name Revolution
Powder Analyser.

Geometry can play a crucial role in the performance of fibres in
different applications. Shape factors that influence performance
include length (i.e. size of the longest dimension of the fibre), width
(i.e. size of the shortest dimension), and curl. Despite the importance
of fibre geometry, many conventional particle sizing measurements
struggle to accurately capture the morphology of these particles.
Volumetric-based particle sizing methods such as laser diffraction
and Coulter Counters assume particles exhibit spherical geometry
and only report equivalent spherical diameter (ESD) measurements.
Manual microscopy, the primary method used for measuring fibre
length and width, is low-throughput and labour-intensive to perform.
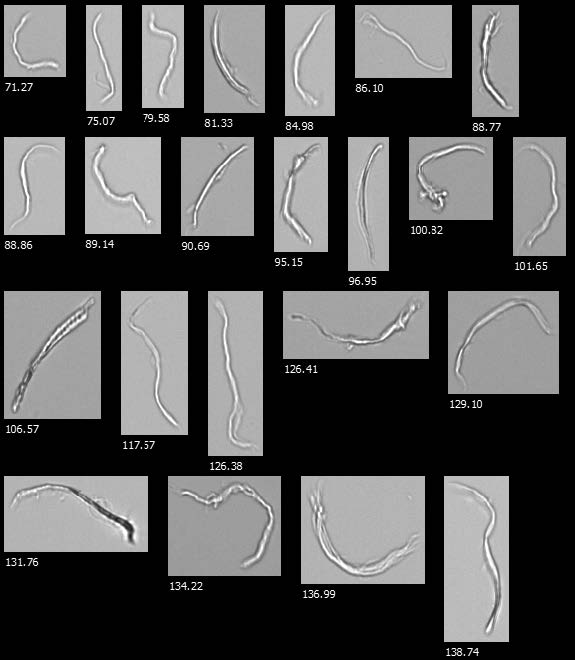
Flow imaging microscopy (FIM) instruments like FlowCam are an
automated, high-throughput alternative to manual microscopy for
fibre analysis. VisualSpreadsheet® software acquires and analyses
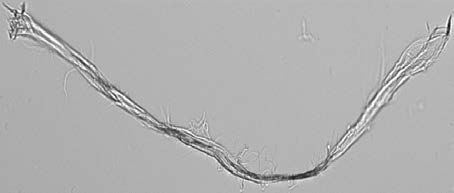
images of fibrils, providing automated measurements of not only
fibre length and width but also fibre straightness and curl from
particle images similar to those obtained via manual microscopy
(Figure 1). As FIM instruments capture fibre images in a flowing
fluid, this technique offers much higher throughput than manual
microscopy. These features make FlowCam an ideal instrument for
rapid, automatic fibre analysis.
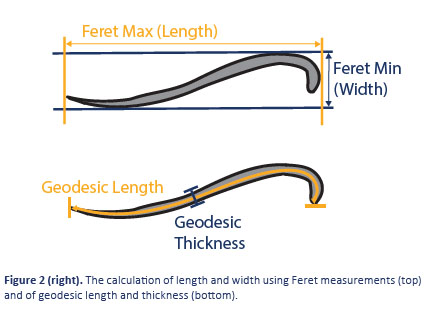
Most particle imaging systems use Feret measurements to determine
the length and width of particles. Feret measurements involve finding
edges on opposite sides of a particle that are parallel to each other
and measuring the distance between these edges. The shortest
Feret measurement is reported as particle width, and the longest
is reported as particle length (Figure 2). These Feret measurements
are recorded as the “Length” and “Width” parameters reported
by VisualSpreadsheet. While these measurements are accurate for
symmetric and straight particles, Feret measurements dramatically
undersize the length and oversize the width of curved particles.
VisualSpreadsheet also records Geodesic measurements of particle
lengths and widths. Geodesic measurements account for the arcing
of particles like fibres, thus providing a more accurate representation
of fibre length and width (Figure 2). In VisualSpreadsheet, these fibre
measurements are reported as geodesic length and geodesic thickness.
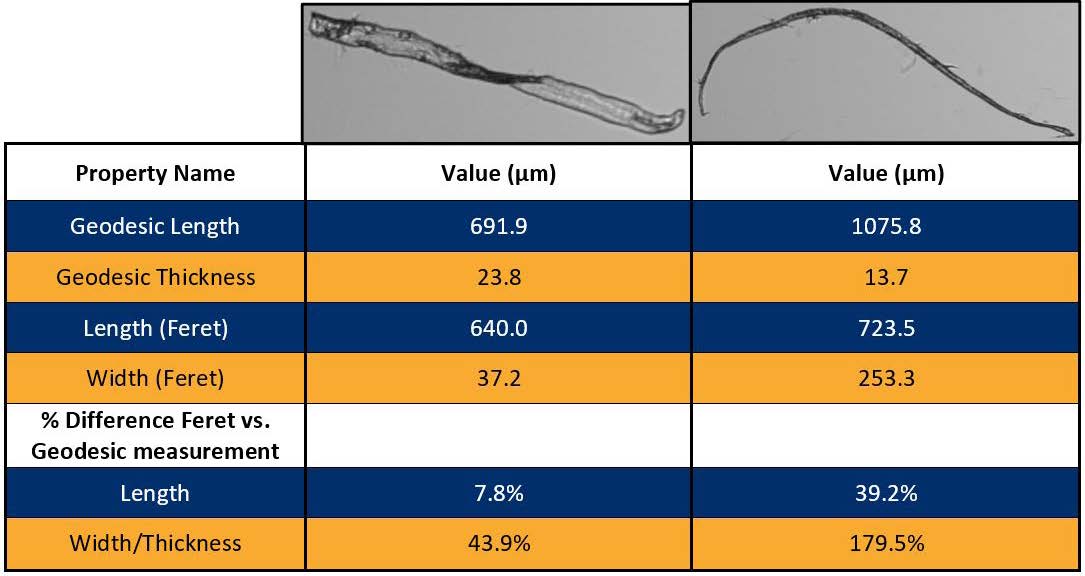
Figure 3 shows a comparison between these measurements for a
straight fibre and for a curved fibre. Reported values for length (Feret)
and geodesic length of the straight fibre are relatively similar, as are
those for width (Feret) and geodesic thickness. When these values
are compared for the curved fibre, the length (Feret) measurement
is much lower than the geodesic length measurement, and width is a
much larger value than the geodesic thickness measurement. While
the length (Feret) measures the long-axis distance covered by the
particle, the geodesic length factors the curvature of the particle into
its reported length and is thus more accurate. Similarly, the geodesic
thickness is more accurate as it primarily accounts for the width of the
particle and not the short-axis distance covered by the particle.
Other fibre measurements available in VisualSpreadsheet include
fiber straightness and fibre curl. Fiber straightness is the ratio
of length (Feret) to geodesic length. Higher straightness values
indicate better agreement between the Feret and geodesic length
measurements, corresponding to straighter particle geometry.
Fiber curl is calculated by dividing geodesic length by length (Feret)
and subtracting one. A particle with a fibre curl of zero is perfectly
straight and increasing curl values indicating higher degrees of
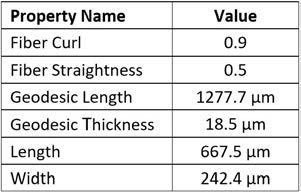
curling. Figure 4 shows fibre measurement data for a curved wood
fibre with a relatively high fibre curl value and relatively low fibre
straightness value.
In applications where fibre morphology is important for quality
control of fibrous materials, VisualSpreadsheet can be used to
build and save custom filters that automatically report counts and
concentrations of particles matching a particular specification. For
example, if fibre straightness is of concern, pre-built filters can
automatically report a percent of fibres that meet or exceed a user defined
fibre straightness threshold.
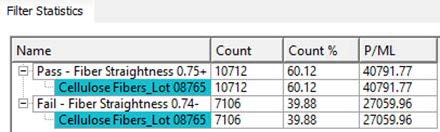
Figure 5 shows data for custom value filters created for bleached
softwood cellulose microfibrils at a specific stage of the refining
process. For this example, at least 50% of the fibres must have fibre
straightness ≥ 0.75 for a lot to pass quality control. After each lot of
fibres is analysed, the filter bins instantly populate with a percentage
of particles matching the passing criteria, allowing operators to
quickly assess whether a particular lot has passed.
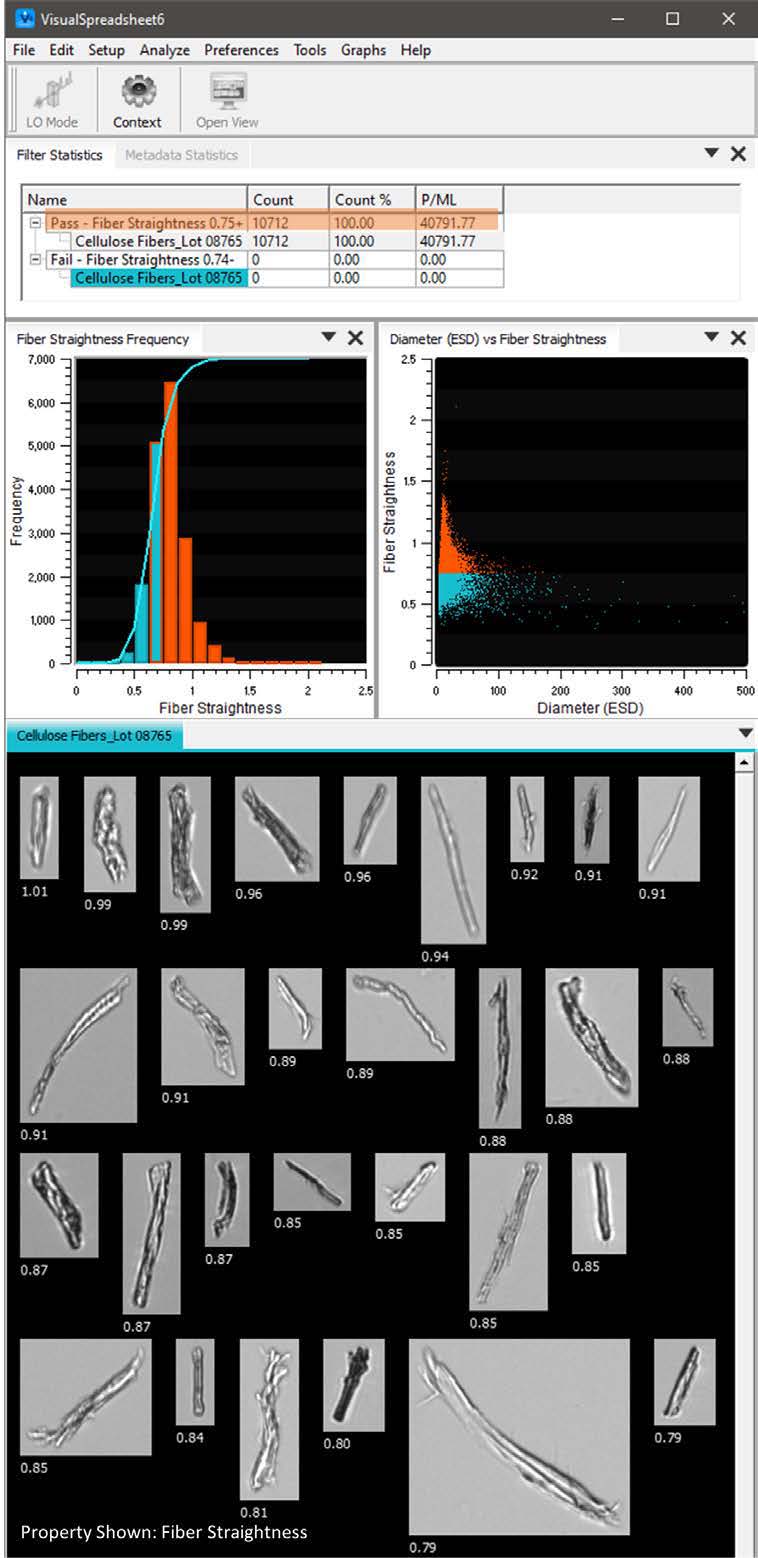
An added benefit of VisualSpreadsheet is the ability to directly
interact with the filter grid and data plots. By selecting the “Pass –
Fibre Straightness 0.75+” filter, particle images that match the filter
will automatically display in the View Window (Figure 6, next page).
These particle images can then be sorted, selected, and/or saved.
Regions of histograms or scatterplots that contain particles matching
the filter will also be highlighted. Data can be easily exported into
Excel or as a PDF document for a seamless reporting and archiving
process.
FlowCam is a powerful analytical tool that expedites and streamlines
fibre analysis. Integrated fibre morphology parameters include
geodesic length, geodesic thickness, fibre straightness, and fiber curl.
Using these measurements, FlowCam provides more accurate and
reliable data than volumetric-based methods and offers a significant
time-savings over manual microscopy. The option of building custom
filters in VisualSpreadsheet allows for instantaneous reporting of
results at the conclusion of sample analysis, saving users time and
effort in assessing fiber quality.

Lysozyme is a commonly used enzyme for lysing Gram-positive bacteria. The comparatively simple structure and low cost make it a popular model in much current biological research.
In this application note, with the BeNano 90 Zeta, the particle size of lysozyme was measured and the molecular weight of lysozyme was calculated through the empirical Mark-Houwink equation. The study on the lysozyme denaturation at high temperature has been successfully carried out, by utilizing the precise temperature-control system of the BeNano 90 Zeta.
Learn more about Lysozyme Analysis in this application note.

Coffee creamer powder is a complex formulation designed to disperse effectively in a liquid and deliver consistent performance, appearance and texture. Its behaviour in suspension is influenced by the interaction between particles and the surrounding liquid, making zeta potential an important parameter when investigating dispersion stability.
Zeta potential describes the electrokinetic potential at the surface of particles dispersed in a liquid. It is influenced by factors including the chemical composition of the particle surface and the properties of the surrounding solution. Understanding these interactions can help explain why some dispersions remain stable while others are more prone to aggregation or separation.
The pH of the dispersion environment can have a significant effect on the measured zeta potential of Coffee Creamer Powder. Changes in pH can alter the charge at the particle surface and, consequently, the attractive and repulsive forces acting between particles.
In general, particles tend to exhibit a more positive zeta potential under acidic conditions and a more negative zeta potential under alkaline conditions. Dispersions with a greater positive or negative zeta potential generally experience stronger electrostatic repulsion, which can contribute to improved stability. As the zeta potential approaches 0 mV, repulsive forces are reduced and the risk of particle aggregation may increase.
In this application note, the relationship between zeta potential and pH is investigated using a commercially available Coffee Creamer Powder containing a combination of polysaccharides, proteins and stabilisers. Measurements are performed across different pH environments to examine how changes in the dispersion conditions affect particle charge.
Zeta potential is measured using electrophoretic light scattering (ELS) with phase analysis light scattering (PALS). The study demonstrates how this technique can provide valuable insight into the surface charge and dispersion behaviour of complex powdered food formulations, helping researchers and manufacturers better understand factors that can influence product stability and performance.

The BeNano 90 Zeta provides accurate and rapid characterization of particle size and zeta potential of Bovine Serum Albumin (BSA) in an aqueous solution as will be detailed in this application note. The results show the BeNano 90 Zeta’s capability in low molecular weight proteins particle size and zeta potential measurement, even though the scattering intensity is weak.

In all product development, the particle size of products and materials is a critical parameter in their manufacture. Changing the particle size distribution of a material has a massive impact on its characteristics and behaviour either during manufacture, within the final product or on its effects within the environment.
The Meritics Lab offer a range of measurement techniques and particle size analysis testing methods that cover virtually all materials — wet or dry, ranging from >1 nm to 5 mm in size. Our expert scientists can help select the most appropriate test for your material/system from the following:
Depending on the technique used, we can report:
Additionally, Meritics offer a fully validated method development service.
Get in touch for a quote or to find out more about how we can support you ….
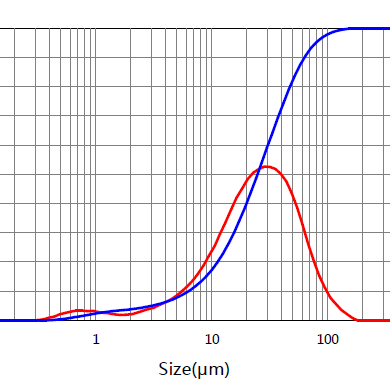

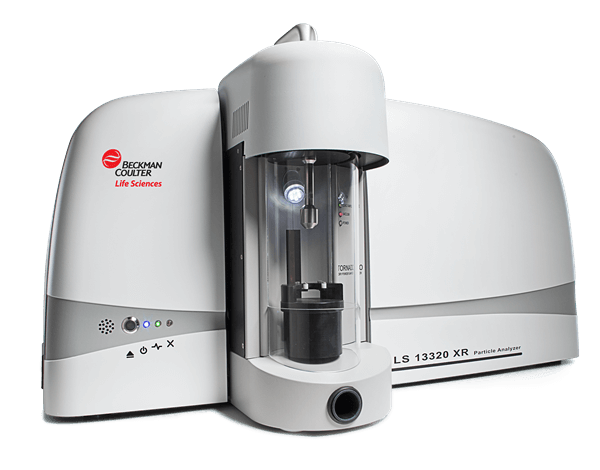
Laser diffraction is based on Fraunhofer theory, where light scattering intensity is proportional to particle size. Smaller particles scatter light at wider angles, and the reverse is true for larger particles. Samples pass through a flow cell, and particle size is calculated from the scatter pattern.
For particles above ~1µm, the diffraction pattern is clear and measurable. Below this range—especially under 0.4µm—the signal becomes vague, limiting accuracy. Some instruments extrapolate data below this threshold, but accuracy suffers.
To overcome this, Beckman Coulter developed PIDS (Polarisation Intensity Differential Scattering). By measuring scatter from both vertically and horizontally polarised light across multiple wavelengths, the system accurately characterises particles below 0.4µm. The LS 13320 XR now achieves real measurements down to 10nm.
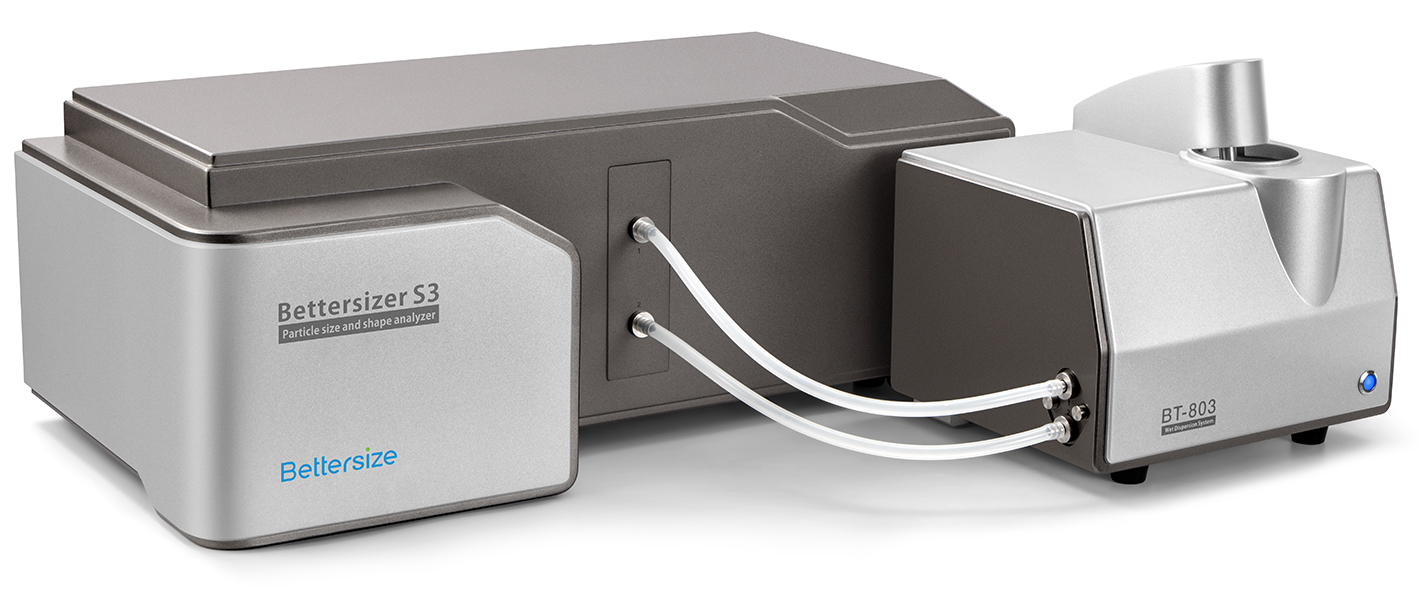
Our scientists routinely measure dry powders (e.g. sugar, soil), emulsions, and aqueous/non-aqueous dispersions. Results can be reported by number, volume, or surface area weighting.
Contact us for a quote or to discuss your particle sizing needs.
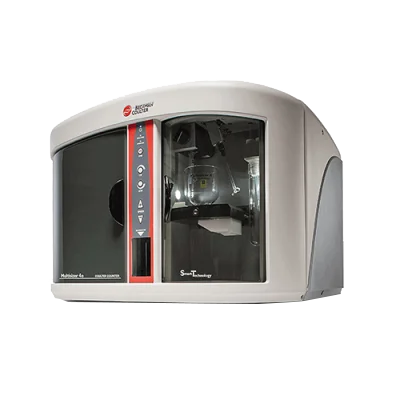
Beckman Coulter Multisizer 4e, with a range of 0.2µm to 1600µm is widely used in many areas: Life Sciences such stem cells, cell biology, and Industrial such as toner, ceramics, sediments etc. as well as Pharmaceutical applications.
The Coulter Principle (also known as ESZ – Electrical Sensing Zone) is hailed as probably the most significant advance in the field of particle technology, and tens of thousands of Coulter Counter instruments are in regular use worldwide.
Most recently our scientists have been running a lot of water samples on the Multisizer 4e to measure contaminants.
Contact us for a quote or to discuss your particle sizing needs.
Today microscopic examination and counting and sizing of small particles is commonplace, Meritics work with Yokogawa Fluid Imaging Technologies (YFIT) and their FlowCam Image Analyser range can size from 300nm to 5mm in range, this takes the tedium involved away and frees up the scientist to analyse data comprehensively.
Electron microscopes probe the size range below the limit of optical microscopy and a scanning technique enables pictures of the surface features of even very delicate surfaces to be made in exquisite detail.
Most recently our scientists have been sizing sugar samples on the FlowCam 8000 to measure the size and to give an image of the particles.
Contact us for a quote or to discuss your particle sizing needs.
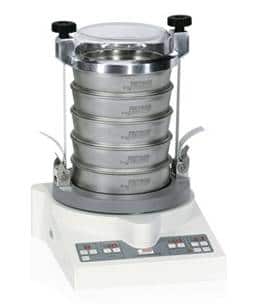
For the characterisation of bulk goods of different forms and sizes, the knowledge of their particle size distributions is essential. The particle size distribution, i.e. the number of particles of different sizes, is responsible for important physical and chemical properties such as solubility, flowability and surface reaction.
In many industries such as food, pharmaceuticals and chemistry traditional sieve analysis is the standard for production and quality control of powders and granules. Advantages of the sieve analysis include easy handling, low investment costs, precise and reproducible results in a comparably short time and the possibility to separate the particle size fractions. Therefore, this method is an accepted alternative to analysis methods using laser light or image processing.
Contact us for a quote or to discuss your particle sizing needs.

Pigments provide colour to a wide range of products, from coatings and inks to plastics, cosmetics and pharmaceuticals. Manufacturers use both organic and inorganic pigments, but achieving consistent colour and performance depends on more than chemical composition alone. Pigment analysis plays an important role in understanding how particle characteristics influence the behaviour of a formulation.
Particle size can affect key properties including colour strength, dispersion, application behaviour, durability and resistance to light and weathering. Manufacturers therefore need reliable particle size measurements to monitor raw materials, optimise formulations and maintain consistent product quality.
Dynamic light scattering (DLS) provides a useful technique for measuring particle size in pigment suspensions. However, high-concentration samples can present a challenge. Their high particle concentration and low light transmittance can interfere with conventional measurement approaches, making it difficult to obtain reliable results.
This application note explores the use of DLS for pigment analysis in two high-concentration pigment suspensions: a red pigment and a yellow pigment. To overcome the optical limitations associated with these samples, the analysis used a capillary sizing cell with a 1 mm internal diameter.
The BeNano 90 Zeta successfully characterised the particle size of both high-concentration pigment suspensions using DLS technology. The capillary sizing cell helped manage the high concentration and low transmittance of the samples, allowing the system to collect reliable particle size data without requiring excessive sample dilution.
This approach demonstrates how the right measurement configuration can extend the capabilities of DLS for challenging pigment samples. By combining the BeNano 90 Zeta with a capillary sizing cell, laboratories can perform effective pigment analysis even when conventional optical measurement conditions prove difficult.
The results highlight the potential of DLS as a practical tool for investigating pigment particle size and supporting formulation development, quality control and process optimisation.

From raw materials and powders to suspensions, catalysts and formulated products, particle properties can have a significant impact on how chemical materials behave and perform. Particle characterisation gives chemical manufacturers the data they need to understand these properties, improve processes and maintain consistent product quality.
Particle size, size distribution, surface area, pore structure, zeta potential and stability can all influence important manufacturing parameters. These include reaction rates, dispersion, dissolution, filtration, sedimentation, flowability, packing, storage stability and the performance of the final product.
Whether you are developing a new formulation, checking incoming raw materials, investigating a process issue or carrying out routine quality control, choosing the right analytical technique is essential.
At Meritics, we provide particle characterisation solutions for a wide range of chemical applications. Our instrumentation covers techniques including laser diffraction, dynamic light scattering, zeta potential, gas adsorption, chemisorption and stability analysis, helping you build a more complete picture of your materials.
Our solutions for chemical manufacturing include:
Selecting an instrument is only part of the process. Understanding which technique, measurement method and sample preparation approach best suits your material can make a significant difference to the quality of your results.
Explore our chemical industry application notes to see how particle characterisation techniques can be applied to real-world materials and manufacturing challenges.
Need help choosing the right technique for your application?
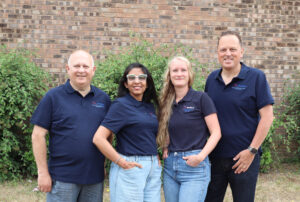
Contact one of our friendly application specialists at sales@meritics.com
Our team can discuss your material, measurement requirements and objectives and help identify an appropriate particle characterisation solution.

In this application note, a non-ionic surfactant micelle Tween 20 and an ionic surfactant micelle SDS were studied by investigating their particle sizes and the effect of temperature on their phase behaviors through dynamic light scattering (DLS) technology.

Three light scattering technologies, i.e., DLS, ELS, and SLS, are incorporated in the BeNano 90 Zeta to enable the measurements of size, zeta potential, and molecular weight, respectively. In this application note, the sizes of BSA in three dispersants are measured, showing the size trend when using different types of dispersants. Then, the molecular weight Mw of BSA is obtained by the BeNano 90 Zeta and shows excellent agreement with the Mw provided by the GPC system. Finally, by utilizing kD, zeta potential, and A2, the stabilities of BSA protein in different dispersants were successfully evaluated and sorted.

If you don’t have a particle analyser, or perhaps your current particle characterisation capability is at capacity, then why not use our Contract Particle Characterisation Laboratory to provide the sample analysis data you need?
Our team of experienced particle technologists are available to help you obtain measurement data you need quickly, whether it be a particle size distribution from a laser particle size analyser, using our dynamic light scattering instruments for zeta potential measurements, or our gas adsorption analysers for surface area and pore volume determinations, we offer a comprehensive range of analysis options on our wide range of particle characterisation instrumentation. From nanoparticle size analysers to millimetre sized particle imaging systems, we can usually.
We are happy to run one-off samples, you can submit samples on a regular basis, or we can run a batch of samples for a research or development project, whatever your needs you’ll find our service great value for money.



Hiring an instrument can help you through periods of high workload, provide useful data whilst you justify its acquisition or carry out a small research project.
Meritics has a number of particle characterisation instruments for hire/rental.
Whether you need something for a day, a week, a month or a year contact us to see how we can help you get the data you need in a timely but economic way.
If you do not see what you need, please contact us, we probably have it!
Depending on the instrument required we can either ship a system to you for immediate use, or our applications team can deliver, install and if required, train your people on its operation so that you start getting valuable data from the start of the hire.
We understand that there may be occasions when budget or time constraints prohibit the purchase of new equipment: we offer a range of options and equipment for hire along with practical support from our expert engineering team.


Regardless of whether you’re a novice or seasoned laboratory professional, our team of expert trainers combines extensive laboratory experience with advanced teaching techniques to enhance your skills and empower your research endeavors.


Training on instruments or a specific analysis technique can be provided on-site or in our laboratory.
While it would be ideal for your instrument to function indefinitely, we acknowledge that breakdowns can occur. In such instances, rest assured that we are here to support you when these situations arise.







Throughout the warranty period, your Meritics system is comprehensively protected, encompassing corrective maintenance, parts, and on-site labour. To guarantee your ongoing satisfaction, we provide a selection of service agreements tailored to optimise your system’s performance over its entire lifespan.


Our expertise in particle characterisation means that our consultancy service can support your analysis requirements and help assist with solving key challenges.
Whether you are looking to buy an instrument, for some contract analysis or looking to hire an instrument for a project, give us a call on +44(0)1582 704807, email us at info@meritics.com or drop us a message through our contact page , we look forward to helping you.
We provide in-house applications support to customers for specific applications, usually without charge. To get help with an application, give our friendly team a call on +44(0)1582 704807.
We typically help customers with process changes, method development and changes to other variables such as raw materials.
Our founder, Brian Miller, is Secretary to the Royal Society of Chemistry’s Particle Characterisation Interest Group and has published over 35 white papers in this specialist field.
Our team of analysts and engineers have over 100 years’ combined experience in the field. Meet the Team.
We can also provide additional services including site visits, advanced training, and preparation for regulatory approvals including method reviews and data checks. Request a quote.



The zeta potentials of lipid emulsion suspensions at different concentrations were successfully characterized by the ELS technology of the BeNano 180 Zeta. The results confirm the capability of the BeNano 180 Zeta in measuring the zeta potential of highly concentrated samples thanks to the innovative optical system and the folded capillary cell with a short light path. It is also concluded that the zeta potential results obtained from highly concentrated samples could not reflect the true potential value of the system. In order to obtain the true zeta potential results, use a proper dilutant to dilute the concentrated sample to an appropriate range. For an unknown aqueous system, it is recommended to perform a concentration titration experiment to determine the optimal concentration range.

In this application note, the BeNano 90 was used to characterize two iron dextran injections, a commercially available one and a R&D stage one. Size differences were successfully distinguished, and the presence of aggregates in the R&D sample was ascertained. With regards to the injection preparations, particular attention needs to be paid to the formation of aggregates, due to their significant effect on the drug stability, efficacy, and immune response. Hence, the BeNano 90 with its excellent sensitivity for aggregates or large particles will be extremely useful and convenient as a research tool for injection preparation.

The BeNano 90 Zeta was employed successfully to determine the size and zeta potential of nano alumina dispersed in the aqueous environment. The measurement results suggest that the nano alumina is close to monodisperse in size and possesses high stability with the zeta potential amplitude over 30 mV.

In the field of immunodiagnostic assay, the BeNano 90 is able to provide highly accurate and reproducible test results, which is a powerful process-monitoring tool for producing and developing such latex-antibody immunological reagents.

In this application note, a thermosensitive PNIPAm sample is characterised by automatic measurements of the particle sizes and zeta potentials under the programmed temperature change process of the BeNano. The PNIPAm measured exhibits similar behaviour with the reported results from most literature. The temperature trend measurement of the BeNano can significantly improve the measurement efficiency and provide a robust and powerful testing tool for such applications.

This study shows the measurement of zeta potentials of titanium dioxide (TiO2) at different pH levels using the BAT-1 autotitrator. Zeta potential, which depends on the chemical composition and environment, can vary with pH. The TiO2 powder was dispersed in water and subjected to automatic titration with HCl from pH 5.4 to 2 using the BAT-1 autotitrator. Results showed that the zeta potential of TiO2 was positive at low pH, approached zero at pH 3.5 (isoelectric point), and gradually became negative with increasing pH. The BeNano with PALS technique provided accurate and repeatable zeta potential measurements, simplifying the process and improving efficiency.

The use of alumina (Al2O3) as a versatile material has prompted research on its stability under different surface modifications. Zeta potential, which depends on the chemical composition and pH of the medium, is an important parameter to assess stability. The BAT-1 autotitrator and BeNano analyzer were employed to measure the zeta potential of Al2O3 particles at different pH levels. The results indicated that the isoelectric point of the Al2O3 system was at pH 6.8, with lower zeta potential magnitudes suggesting instability near this point. Higher pH levels (10-12) exhibited higher zeta potential magnitudes and greater system stability due to stronger electrostatic forces.

This application presents the use of Dynamic Light Scattering Microrheology (DLS Microrheology) to measure the thermal-sensitive rheological behavior of a BSA (bovine serum albumin) solution using the BeNano 180 Zeta. DLS Microrheology utilizes tracer particles to measure the mean square displacements (MSD) and obtain rheological information of solutions. The study reveals that at higher temperatures, aggregation of BSA leads to an increase in viscoelasticity. The DLS microrheological technique provides a powerful and efficient means to characterize the rheological properties of liquids.

This application note discusses the characterization of the size and size distribution of monosaccharide molecules, specifically glucose. The BeNano, equipped with a high-speed correlator, was used to measure glucose, which has a molecular weight of 180 Da. Viscosity correction was performed using polystyrene spheres, and measurements were conducted at different concentrations. The results showed distinct correlation functions and size distributions for sucrose and glucose samples, highlighting the presence of monosaccharides and polysaccharides. The BeNano system demonstrated reliable detection capabilities for small particles like glucose.

This application note presents a study on determining the zeta potential of battery electrode slurry dispersed in NMP solvent. The experiment utilized the BeNano to measure the zeta potential of four different samples. The results showed that all samples had negative zeta potentials, indicating the presence of negative charges in the electrode materials. The zeta potential amplitudes were around 50 mV, indicating high stability. The study highlights the importance of understanding zeta potential for optimising battery electrode production and emphasizes the reliability of the measurements.

Why T-cells are important

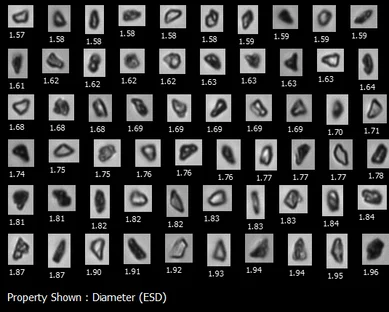
Through its exceptional image quality and the widest size range available, FlowCam 8000 represents state-of-the-art particle imaging technology.
Analyse thousands of particles in less than a minute and comprehensively characterise the size, count, morphology, and identity of subvisible and visible particulates in their native solvent.
Flow Imaging Microscopy (FIM) combines the benefits of digital imaging, flow cytometry, and microscopy into a single solution.
Beyond traditional particle sizing and counting, image-based analysis allows for comprehensive characterization of subvisible API aggregates and contaminants in biopharmaceuticals, mammalian cells, microplankton, emulsions, and advanced materials.
|
Size range
|
Particle sizing and imaging 2 µm to 1 mm with magnification options of 20X, 10X, 4X, and 2X |
|
Minimum sample volume
|
100 µL |
|
Sample processing capability
|
Sample processing capability from 0.05 mL/minute up to 10 mL/minute, depending on flow cell configuration |
|
Camera
|
High-resolution camera available in color or monochrome |
|
Maximum particle concentration
|
Maximum particle concentration of 5 million particles/mL at 2.5 µm particle size |
|
Additional systems
|
Compatibility with ALH for FlowCam(TM) automated liquid handler |
|
Fluorescence excitation options
|
Fluorescence excitation options (488 nm, 532 nm, 633 nm) with 2-channel fluorescence detection |



High-resolution images to detect and identify submicron particle types
FlowCam Nano provides dynamic image analysis of submicron particles from 300 nm to 2 µm, bridging the gap between traditional flow imaging microscopy and other particle analysis techniques.
Use FlowCam Nano for early detection of aggregates and contaminant monitoring for protein formulations, nano-drug delivery systems, characterization of bacteria, bioprocess monitoring, and materials characterization.
FlowCam Nano is a flow imaging microscope for submicron particle imaging in biopharmaceutical and other materials applications. Its advanced optical imaging capabilities enable detection and morphological analysis of the smallest particles observable using light microscopy.
Detect submicron-sized particles including protein aggregates and small oligomers of drug delivery vehicles like LNPs and exosomes to proactively improve product stability and quality—even before larger particles are present.
|
Measurement size
|
Flow imaging and particle sizing from 300 nm to 2 µm using oil immersion with 40X magnification |
|
Minimum sample volume
|
Minimum sample volume of 100 µL |
|
Sample flow rate
|
Sample flow rate up to 25 μL/minute |
|
Camera
|
High-resolution monochrome camera |
|
Compatible with
|
Compatible with aqueous solvents for analysis in native buffers |
|
User friendly
|
Ease of use with disposable flow cells and autofocus technology |


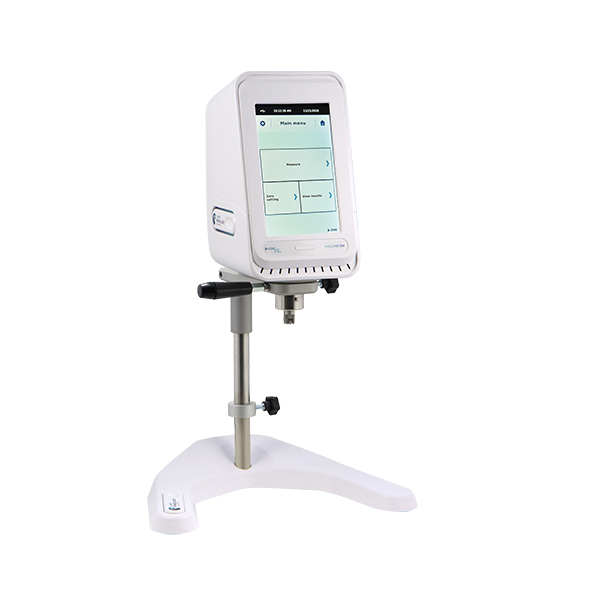
LAMY RHEOLOGY is the first French manufacturer of measuring instruments for laboratories, research and industry.
LAMY RHEOLOGY is a family-owned and run company that has become the French leader in the rheometer and viscometer market; in 2025, the company is celebrating its 70th birthday. Established by Jean Lamy in 1955, the firm was taken over by his daughter, Danielle Lamy in 1986, then by his grandchildren, Sophie and Eric Martino in 2006, whose takeover marks the completion of a process initiated in the early 90s: for nearly 25 years, LAMY RHEOLOGY has been manufacturing its entire range of products in this way.
The firm, from the Rhône-Alpes, is the only French manufacturer of rheometers and viscometers. It takes advantage of being “Made in France”, not for its label, but for its real quality ethics. Generation after generation, it has stayed true to this course of action and because of this the company has established itself as a key player in the industry, recognised for the team’s commitment.
Viscosity measurement is crucial for characterising fluid properties, determining resistance to flow. Accurate viscosity data ensures quality control and process optimisation in industries such as pharmaceuticals, food, cosmetics, and petrochemicals. Advanced instruments, like Lamy Rheology Viscometers, provide precise, reliable measurements for both Newtonian and non-Newtonian fluids, enhancing material performance and consistency.
Below are the wide range of Viscometers by Lamy Rheology offering you a great choice of viscosity measurement instruments.
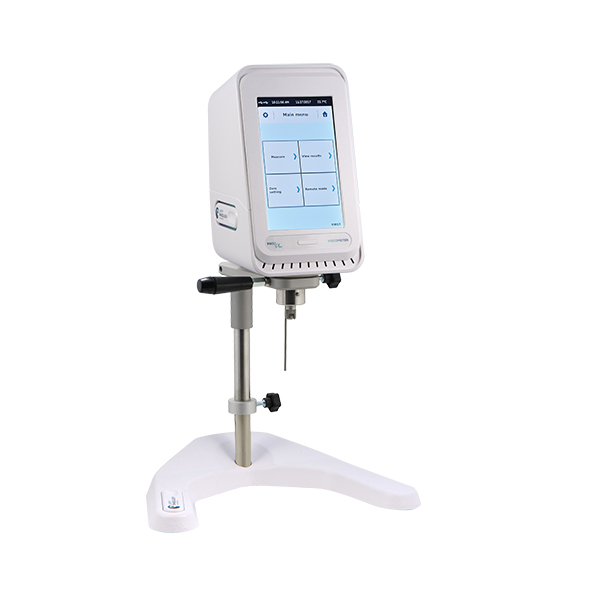
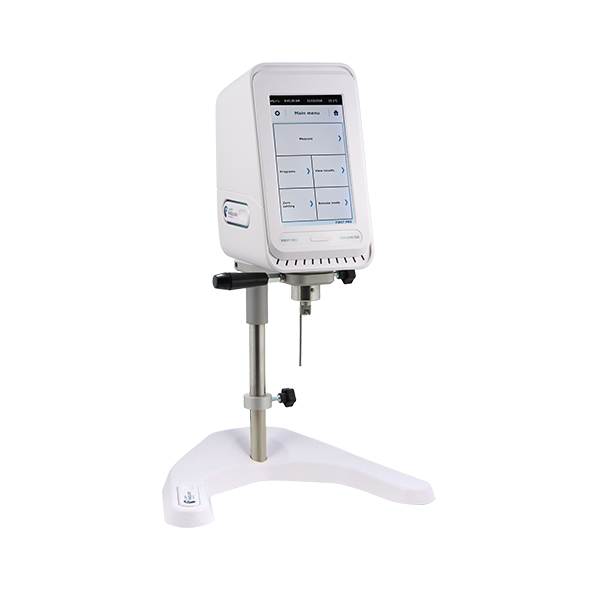
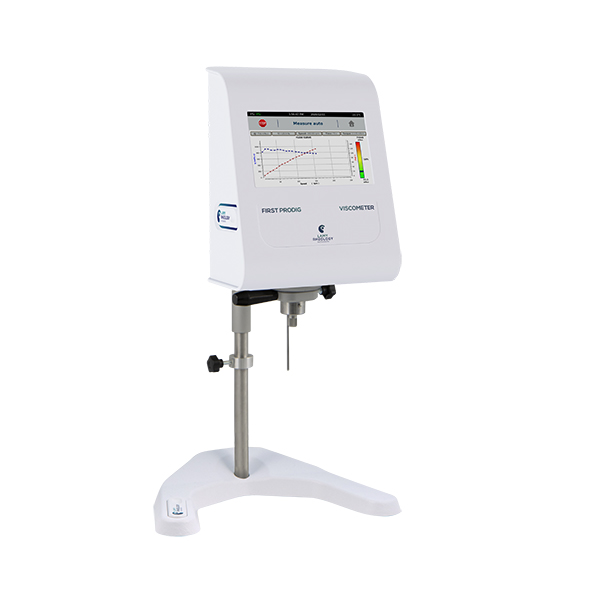
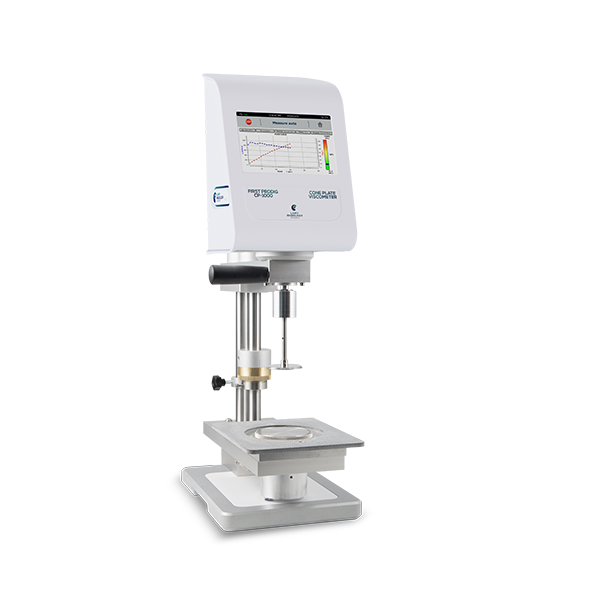
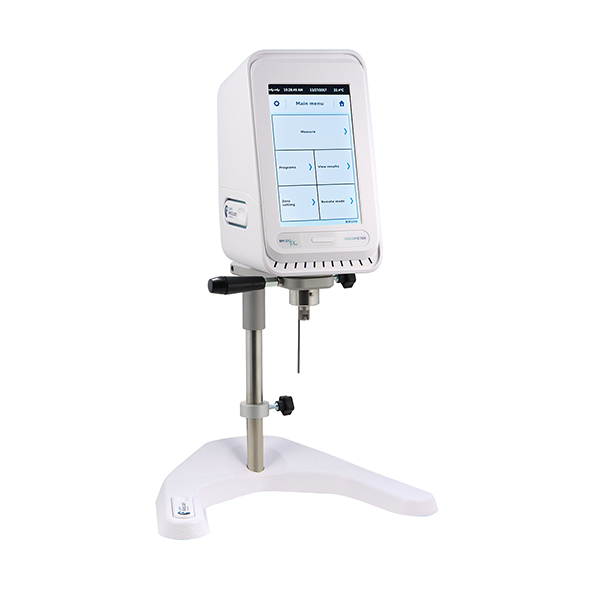
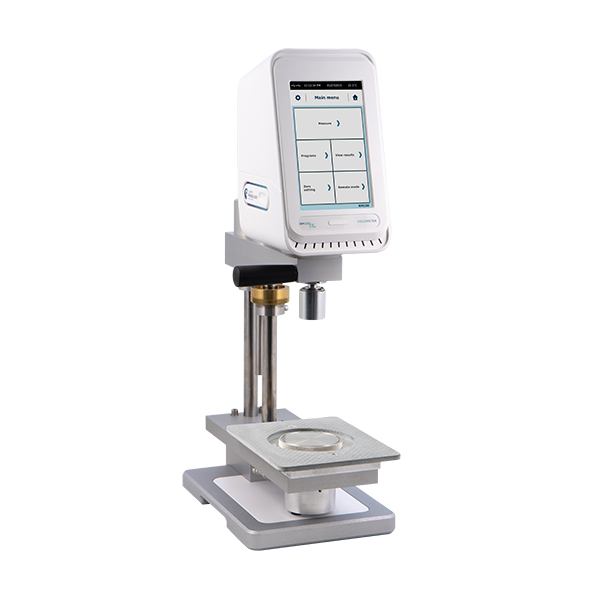
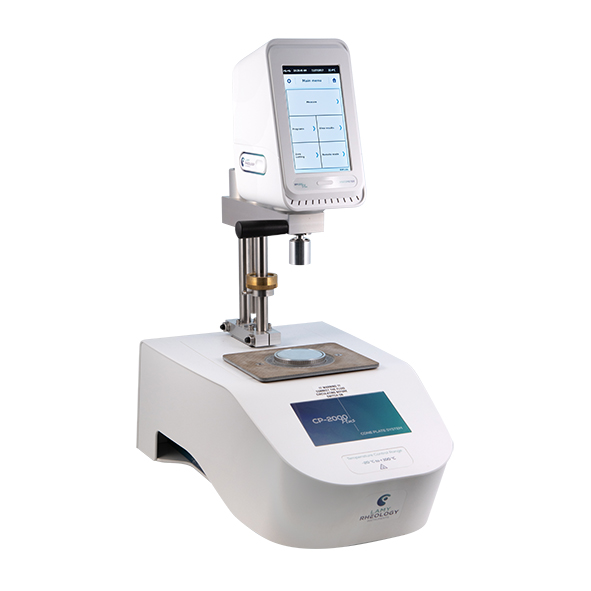
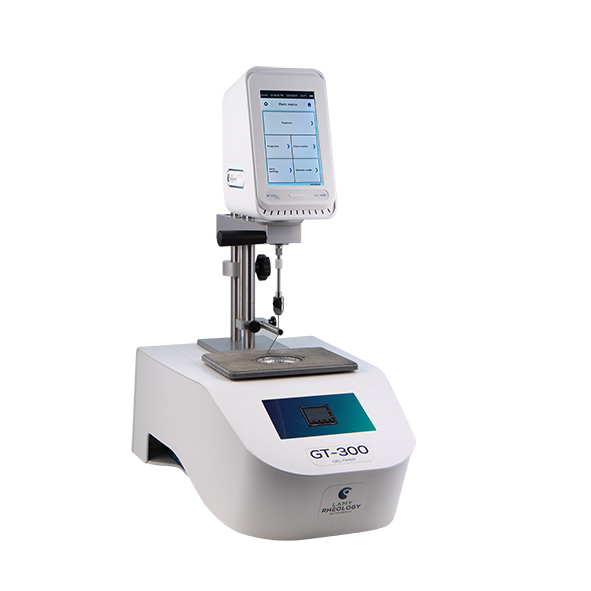
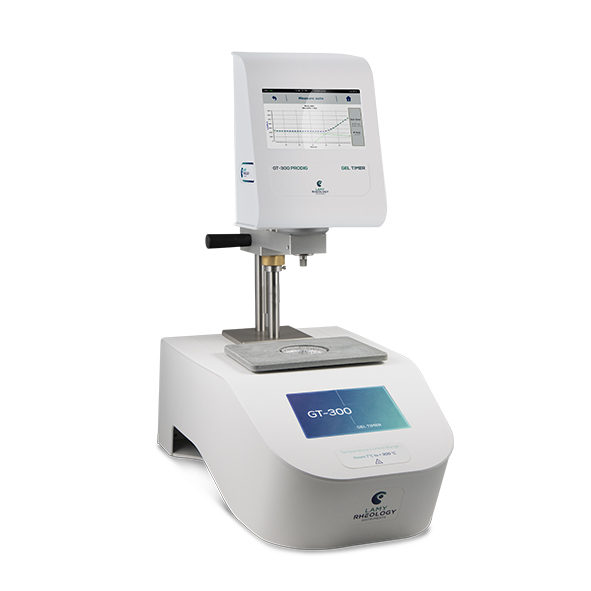



The surface area of a material is, in many cases, as important as the chemical properties. As particle size decreases, surface area increases. Porosity of materials – from micropores to macropores – contribute even more to the total surface area. The interface at the surface is what defines how a solid reacts to other substances, be they gases, liquids, or solids.
Surface area can impact shelf life, stability, dissolution and efficacy of pharmaceutical powders and tablets. Likewise, surface area can affect the rheological properties and hiding powers of pigments, paints, and coatings. It has a significant impact on the ability for materials like catalysts, adsorbents, filtration materials and air separation products to react in the designed application. Ceramics used in applications ranging from; dinner plates, to dental implants, to electronics, all are affected by surface area.
While particle size is frequently used to control size reduction and milling of minerals and other substances, surface area can provide substantial size reduction feedback. Many times, a material which may have the same particle size across different batches may reveal completely different surface areas due to small changes in processing.
The SA-9600 series of surface area analysers brings exceptional speed, convenience, and low cost-per-analysis to surface area measurement on a wide variety of materials. Now you can perform ultra-fast single or multi-point surface area measurements with push-button ease.
These tools use the robust and proven flowing gas method to acquire gas adsorption and desorption data. This information is then used to calculate total surface area utilising the well-known BET method. The advantage of the flowing gas method is most evident in single-point mode where up to thirty sample analyses can be performed per hour.
The patented SA-9600 technology provides routine total surface area determination in as little as two to six minutes. The SA-9603 models feature three stations for three simultaneous surface area measurements.
Begin analyses with simplicity. The SA-9600 does the rest! The entire analysis is completed without further interaction and avoids the manual steps required with many similar analysers.
Laboratory bench space is at a premium in most labs. The SA-9600 provides all analysis and preparation stations in one small, well-designed cabinet. No need for additional space for separate analysis and preparation devices as with many alternative analyzers. If expansion is needed, additional stations are added in the same footprint – not by adding more devices which consume more space on the lab bench. The SA-9600 may also be controlled from the built-in computer and keyboard saving additional space in your lab.
To ensure repeatable accuracy, the SA-9600 performs an automatic calibration before every measurement. And from there, the SA-9600 technology eliminates variables otherwise introduced by operator involvement.
The use of mass flow controllers in some versions of the SA-9600 series automatically create the necessary mixtures of nitrogen and helium for multi-point BET surface area analysis. This lowers the total cost of ownership by eliminating the need to purchase expensive gas mixtures. Straight forward design ensures service costs are minimal compared to more complex, static volumetric technology.
Detector Protection
An automated bypass loop and cell detector switch limits the effects of missing or broken sample cells by bypassing the detector when gas flow to the cell stops.
Electronic Valves
Reliable electronic valves eliminate the need for a compressed air or gas supply to actuate valves during the measurement process, further lowering cost of ownership.
Improved Gas Handling
Thoughtful design of manifold layout and valve selection result in more stable, balanced flow, improving repeatability, lowering maintenance costs, and easing operation.
Robust Dewar Elevator System
A rugged mechanical design means smoother and reliable movement of the Dewar tray that raises and lowers the LN2 Dewars.
Software Control
The SA-9600 software was designed to be easy as 1, 2, 3.
And in a few minutes the full surface area report will be complete.
View the measurement in real-time to see the auto-calibration, adsorption, and desorption.
Flexibility
Built-in functions allow optimization of system for different sample types.
Use the feature-rich SA-9600 software to control the unit via USB communication or use the built-in keyboard and display.
High Throughput
Every SA-9600 model includes multiple sample preparation stations (2 or 3 depending on model). For very high throughput environments the SA-9660 accessory provides three additional stations.
Total Surface Area: 0.1 to 50 m2
Specific Surface Area: Approximately 0.01 – 2,000 m2/g
Much more sensitive to low surface area samples than volumetric type analyzers, allowing the use of samples less than 1g and as low as 0.1 square meters in the sample cell.
Reproducibility is better than 1% COV.
Accuracy is better than 10% for most samples.
The SA-9600 Series offers a full line of high-quality, high-performance BET Surface Area Analyzers with four fully automatic analyzers to meet the needs of any research or quality assurance laboratory. The SA-9600 Series analyzers include:
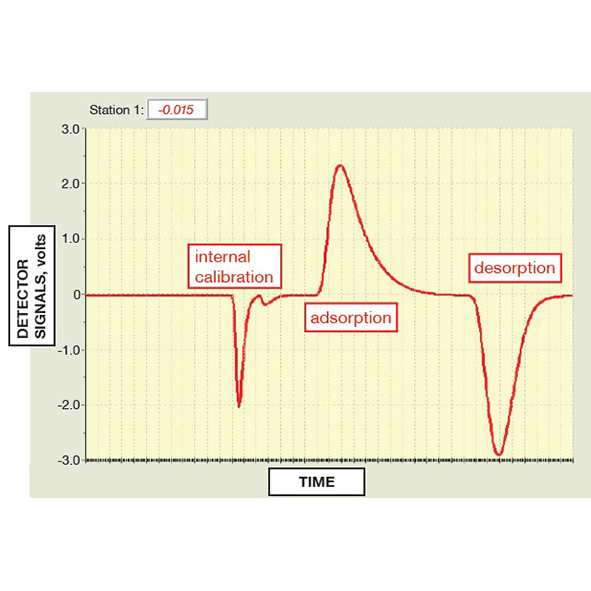
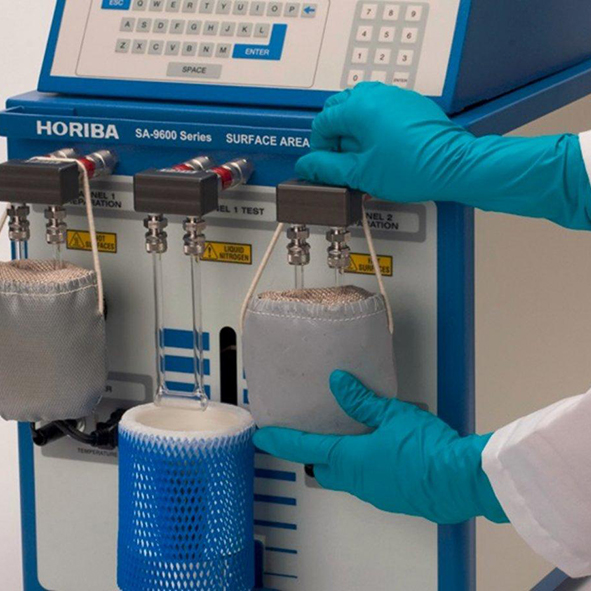
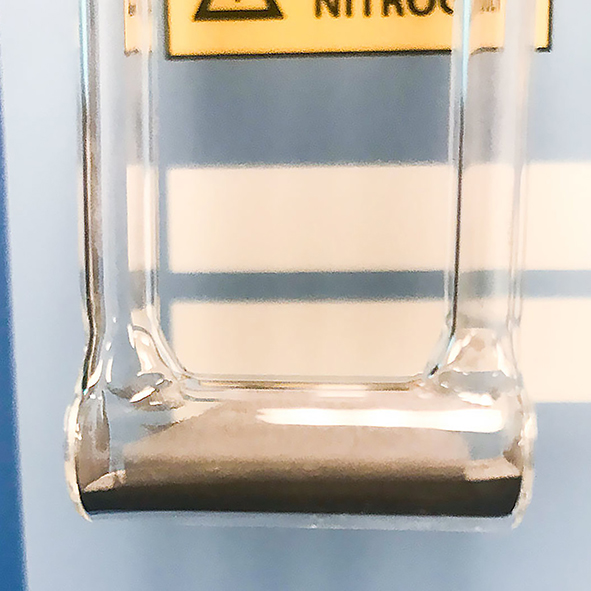
Metal Powders
The REVOLUTION Powder Analyser can measure your powder’s ability to flow, consolidate, granulate, cake, pack and fluidise by measuring the power, time and variances in energy of your powder in a rotating drum. This data can be used to quantify your powder’s particle behaviour during process applications such as blending, tableting, mixing and transportation.
The REVOLUTION Powder Analyser is both easy to load and automatic, eliminating the opportunity for human error.
The REVOLUTION Powder Analyser consists of a rotating drum that measures the flow properties of granular and fluidised materials. Several drum sizes are available, from drums requiring 10 cc’s of sample to drums using 500 cc’s. The instrument is very easy to use. A measured volume of test powder is collected using the provided sample cup. The sample is then loaded into the sample drum and the drum is placed inside the instrument on two rollers in front of a machine vision camera. The drum is back or front lighted depending on the measurements required. The test is started and images of the sample powder are taken with the camera and are analysed using image analysis software as the drum turns or vibrates. The analysis software locates the powder and measures several powder parameters automatically for every image.
Powder flowability is defined as the ease with which a powder will flow under a specified set of conditions. Some of these conditions include: the pressure on the powder, the humidity of the air around the powder and the equipment the powder is flowing through or from. For some applications, ease of flow is simply defined by whether the powder flows or not, the so called “go no-go” approach. The only question is: Will the powder flow through the system or not? For other applications, the rate and consistency of the powder flow is important.
The following are some process examples where the flow rate and consistency is important: a powder die that must be filled with the same amount of powder each and every time or a consumer product that must flow smoothly out of a small container.
Any device used to test powder flowability must take the application problems and processing conditions into account to supply relevant data to the user. The powder in the test device must be in the same state as it is in the process being studied. This ensures that the flow analysis will be applicable to the problem.
The REVOLUTION Powder Analyser is the perfect powder tester for measuring the following:
A flowability method is created by selecting the time and rate of rotation based on evaluated process conditions. 10-500cc’s of sample are placed inside of the measurement drum. The instrument is run for a set number of avalanches or data points.
The instrument measures 20 parameters relating to the behavior of the sample in the drum including avalanche energy, break energy, surface fractal, sample density, avalanche angle, etc. The standard deviations for all of these measurements is also calculated. Figure A presents the energy level of the powder in the sample drum over time.
The REVOLUTION Powder Analyser calculates the power average by measuring the change in the power of the powder for each avalanche. The avalanche spectrum shows graphically the total power amplitude at each avalanche frequency in Figure B.
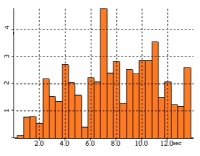
The cumulative powder spectra provides an excellent tool for comparing the flow properties of different powders (Figure C). The lower the avalanche time and energy, the better the powder flows.
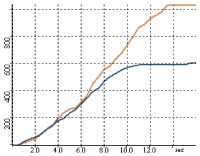
The REVOLUTION Powder Analyzer also measures avalanche angle and rest angle of each avalanche. This Angle Graph displayed in Figure D indicates the angles required to start and continue the flow of the powder. The rest angle is typically very close to the angle of repose of the material. The advantage of the RPA is that these measurements can be made hundreds of times providing a repeatable average as well as a range for each parameter measured.
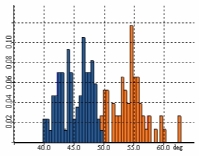
The REVOLUTION Powder Analyser measures many parameters to help determine the difference between powders and establish parameters for predicting powder performance. These measurements include fractal dimension, powder volume and surface linearity. Once the flowability test has been completed, the software will provide the user with the statistical analysis.
A powder is fluidised when a gas is injected into the powder causing the powder particles to separate and enter a fluid like state. The properties of the powder, as well as the pressure and temperature of the gas, determines the degree of fluidisation. For fine powders, the gas pressure required to fluidise the particles is very low. This low pressure can be created by rotating the powder in a drum. Varying the rate of drum rotation results in changes of the fluidisation pressure. The fluidisation of a fine powder can be studied by measuring the volumetric expansion of the powder in a rotating drum as a function of the rotation rate of the drum.
The following are some process examples where the flow rate and consistency is important: a powder die that must be filled with the same amount of powder each and every time or a consumer product that must flow smoothly out of a small container.
In addition, the rate at which a fluidised fine powder settles to its original state can be measured by stopping the rotation and reducing the fluidisation pressure to zero.
The REVOLUTION Fluidisation Test measures a powder’s volume increase at specified angular velocity intervals in a rotating drum to create a fluidisation function for the powder. During the fluidisation test, the rate of decrease in the powder’s volume is measured to create a settling function for the material. Appropriate powders for the REVOLUTION Fluidisation test include: toners, catalysts, powder coatings, and other powders with low pressure fluidisation potential.
There are four optional process steps to the Fluidisation Analysis: Prep, Settling, Analysis, and Settling. These four steps are discussed below.
Within the Prep Step, the user can rotate the powder at a chosen rotation rate and length of time to completely fluidise the material. This step will allow the user establish a repeatable initial fluidised state for this analysis. This prep step can be skipped if the user wishes to study the fluidisation of the material in its original state.
If the material has been fluidised in the prep step, the material must return to its un-fluidised state to perform the fluidisation analysis. In this step, the rotation of the drum is stopped for a specific length of time or until the volume of the sample reaches its original state. The rate at which the powder’s volume decreases is measured and is used to create a settling function.
During the analysis, the user sets the start and end drum rotation rate with the desired step rate. REVOLUTION will begin the drum rotation at the specified start rotation rate, stepping up the rate at the desired intervals until the end rotation rate is achieved. The user can chose to ramp up the angular speed at any desired intervals to achieve the equilibrium fluidised state.
After a specified equilibration time has elapsed at the end rotation rate, REVOLUTION will begin computing the statistical measurements described below for this fluidisation analysis step. In Figure A, the statistical analysis shows the operator the rate at which the powder fluidised by the increase in the overall volume. In Figure B, the fluidisation test results are shown for two different powder samples: one sample fluidises at a faster rate than the other.
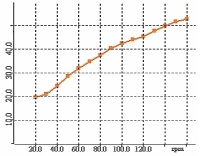
Figure A – Fluidisation function sampkle height v.s rotation speed
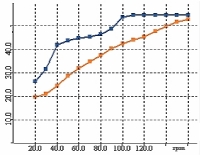
Figure B – Overlay of Fluidization Function for 2 samples
After the fluidised analysis, the REVOLUTION Powder Analyser measures the settling time of the powder. This settling time is valuable for anyone who is fluidising a coating for example and needs to know the amount of time required for the powder to settle on the coating surface. In Figure C, the analysis shows the operator the rate at which the powder settled after the fluidisation operation had been stopped.
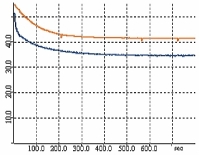
Figure C – Overlay of settling rate for two samples
Powders can behave very differently depending on the amount of energy they are subjected to as they move through handling equipment. One powder may flow more evenly as it is subjected to more mechanical energy while another powder may become more erratic. This behavior can be studied using the REVOLUTION Multi-Flow test method. In the multi-flow method, the sample drum speed is increased gradually over time and the sample powder’s behavior is measured.
The Multi-Flow Analysis studies how a powder or granular material transitions from avalanching to continually flowing as it is subjected to faster speeds. By gradually increasing the rotation speed in the Multi-Flow Analysis, the user can evaluate the speed at which their powder is no longer avalanching in their process but flowing continuously. This data can be used to predict how powders will behave in high speed equipment.
Before analysis, the samples are prepared by rotating the sample drum at a fixed speed for a fixed time. In this case, the preparation consisted of rotating the powder drum at 20 RPM for 30 seconds to aerate the sample. The prep time and rotation speed are user programmable and are selected to best suit the application being studied.
After preparation, the sample drum rotation is started and sample properties are measured. After programmable intervals, the drum speed is increased by fixed intervals and changes in the sample properties are determined.
The Energy Function Graph displays the energy level of the sample powder versus drum rotation rate. This data is used to calculate energy slopes. The gray area presents the standard deviation of the energy level. Figure A shows data for a sample that behaves more erratically as the rotation speed increases while Figure B shows data for a sample that’s behavior improves.
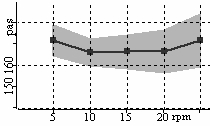
Figure A – Energy Function
Poor Sample Behavior
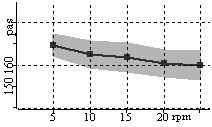
Figure B – Energy Function
Good Sample Behavior
The Packing Analysis studies the powder’s ability to pack or settle after being exposed vibrational energy during transportation and storage.
The following are some process examples where packing and settling are important: a container that must be filled with the same amount of powder each and every time but settles to a different amount during transportation and storage or a powder that packs into a strong cake during handling and storage. An ideal powder has properties that do not change during processing, handling and storage.
Any device used to test the changes in volumetric expansion and compression must take the application problems and processing conditions into account to supply relevant data to the user. The powder in the test device must be in the same state as it is in the process being studied. This ensures that the packing analysis will be applicable to the problem.
The REVOLUTION Packing Test has three process steps: Preparation, Vibration and Analysis.
The sample powder is rotated at a chosen rotation rate and length of time to completely aerate the material. This step will allow the user establish a repeatable initial powder state before beginning the packing analysis. After the initial preparation, the RPA measures the powder volume.
The motor in the REVOLUTION Powder Analyzer vibrates the powder for a period of time at a specified amplitude and frequency. The sample volume is monitored during the vibration and the final volume is recorded as the volume after vibration. The percentage change in volume from after prep and after vibration indicates the sample’s ability to pack during storage and transportation.
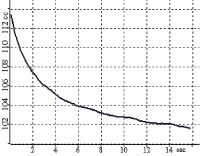
Volume during vibration
After the volume measurement, the powder is rotated at a specified speed until the compacted powder breaks (or avalanches). The software calculates the force required to break the powder mass.
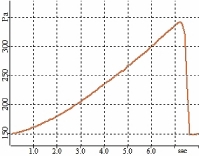
Figure A – Energy Function
Poor Sample Behavior
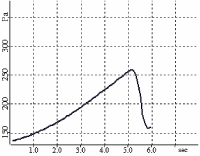
Figure B – Energy Function
Good Sample Behavior
Powders and granular materials can acquire electrical charge on the surface of their particles due to contact and movement against handling equipment and containers. They can also acquire charge due to contact and movement of particles within the material itself. This process is called tribocharging. Tribocharging is caused by electrons moving from one surface to another when different materials come in contact with each other. One material will become positive and the other will become negative. The amount of charge developed depends on the nature of the materials in contact, the pressure of the contact, the relative velocity of the contact surfaces, and the friction between the contact surfaces.
Measuring the charge acquisition properties of powders and granular materials is important because charge acquisition leads to problems and unstable behavior. Charged materials stick to processing equipment and containers. Charged materials can become airborne more easily. Charge materials flow in different ways than materials with no charge. In fact, many research believe that material electrical properties are the most important contributors to powder flow behavior.
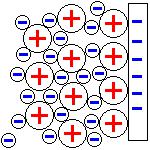
Charge can cause powder particles to stick to one another and to equipment surfaces creating blockages and cleaning problems
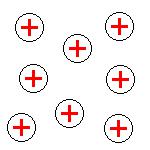
Charge can cause particles to repel one another creating airborne dust and materials that are difficult to control
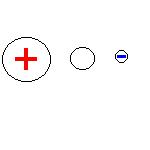
Flow agents and glidants can dissipate charge in a powder or prevent charge from accumulating
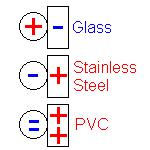
Contact materials can create or remove charge from powders and granular materials.
Using the ION Charge Module with the Revolution allows measurement of charge acquisition properties between contact surfaces and test samples while controlling velocity and contact time.
Step 1:
Test sample is loaded into the sample drum and placed in the analyzer on the two rollers.
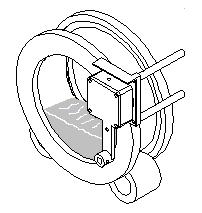
Step 2:
The field meter is rotated in front of the sample drum and the initial charge on the surface of the contact plate is measured.
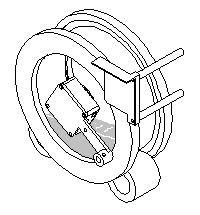
Step 3:
The sample drum is rotated at a programmed velocity and the charge on the contact plate is measured at programmable intervals.
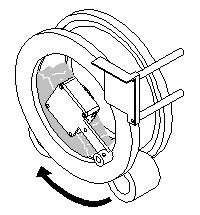
Step 4:
The drum rotation is stopped and the field meter measures the charge dissipation.
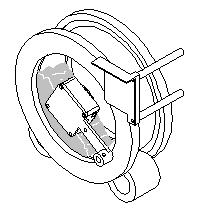
|
SAMPLE
|
CHARGE |
|
D50 = 4um
|
3708 V |
|
D50 = 8.2um
|
3009 V |
|
D50 = 11-15um
|
2303 V |
|
D50 = 16um
|
1516 V |
The data above is for a powder with different particle sizes charged with glass. Typically charge development increases as particle size decreases.
|
SAMPLE
|
CHARGE |
|
0.7% Moisture
|
2006 V |
|
0.9% Moisture
|
1098 V |
|
1.2% Moisture
|
731 V |
|
2.9% Moisture
|
43 V |
The data above is for a powder with different moisture content charged with glass. Typically charge development decreases as moisture content increases.
|
SAMPLE
|
CHARGE |
|
No flow aid
|
-1260 V |
|
0.4% Flow aid
|
240 V |
|
0.8% Flow aid
|
1310 V |
The data above is for a powder with different flow aid concentrations charged with polycarbonate. Typically charge development changes as flow aid content changes.
|
SAMPLE
|
CHARGE |
|
No surface treatment
|
-1367 V |
|
0.05% Surface treatment
|
1257 V |
|
0.15% Surface treatment
|
2007 V |
The data above is for a powder with different concentrations of surface treatment liquid charged with glass.
The Revolution Temperature Control option can heat samples from room temperature up to 250 degrees Celsius while running flow tests. Samples can be heated moving constantly, moving intermittently or not moving. Tests can be performed before heating and at temperature intervals.
| Sample | 26C | 110C | 135C |
|---|---|---|---|
| Polymer | Avalanche Angle 51.8 deg | Avalanche Angle 60.1 deg | Avalanche Angle 68.2 deg |
| Density 0.436 g/cm3 | Density 0.379 g/cm3 | Density 0.372 g/cm3 | |
| Polymer Annealed | Avalanche Angle 50.5 deg | Avalanche Angle 58.0 deg | Avalanche Angle 63.3 deg |
| Density 0.438 g/cm3 | Density 0.390 g/cm3 | Density 0.383 g/cm3 |
A polymer was tested at 26C, 110C, and 135C to determine flow changes with temperature between annealed and non-annealed. Increases in temperature caused the powders to flow more poorly and this resulted in a lower powder bed density. In this case the annealed material showed more flow temperature resistance than the non-annealed material.
Each REVOLUTION Powder Analyzer includes:
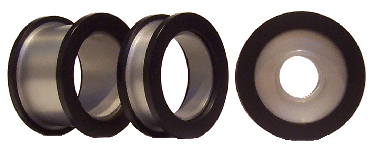
The Following Additional Options are available:
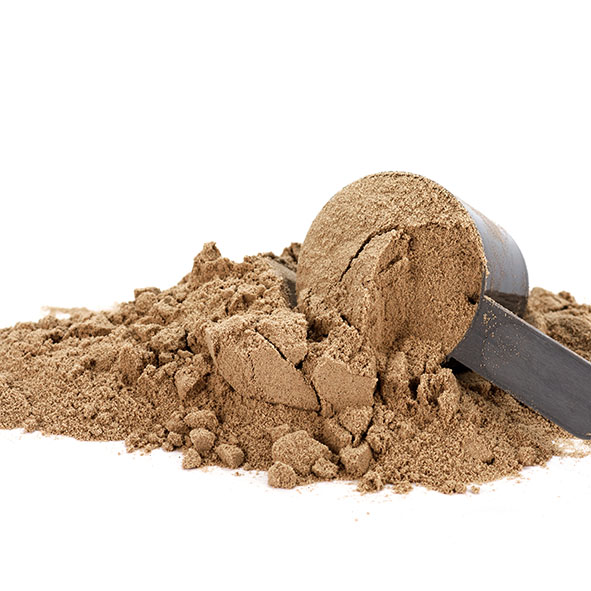

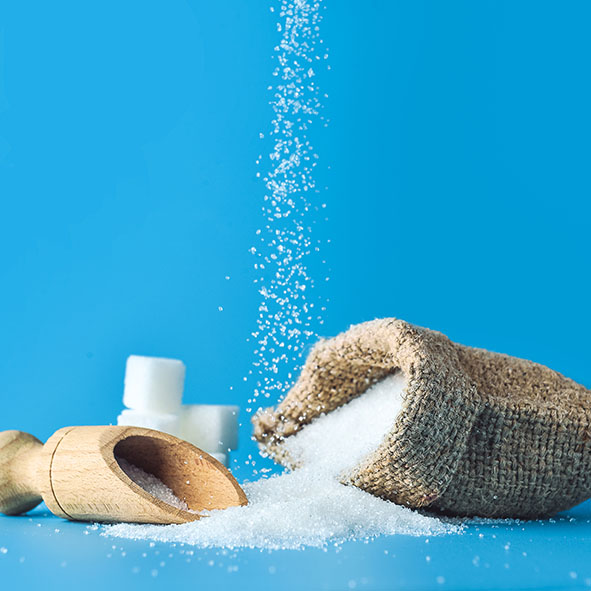


|
Instrument size
|
60 cm x 23 cm x 23 cm |
|
Contact materials
|
Glass and aluminium |
|
Sample size
|
20 to 500ccs |
|
Drum rotation rate
|
0.1 to 200 RPM |
|
Computer connection
|
USB3, Ethernet |
|
Operating system
|
Windows 7, Windows 10, Windows 11 |
|
Power requirements
|
80-230 Volts, 3 amps |

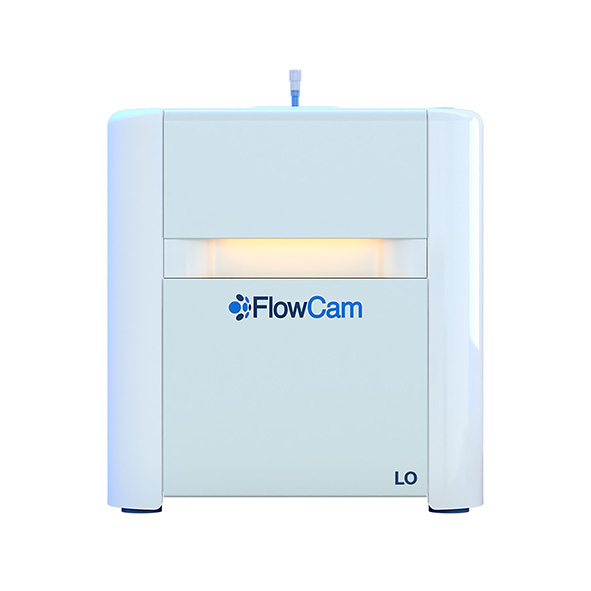
Innovative particle characterisation with FlowCam LO combines flow imaging microscopy (FIM) and light obscuration (LO) into a single analytical solution.
Beyond the compendial light obscuration method to fulfill USP <787> and <788> requirements, flow imaging microscopy provides an orthogonal method for quality control of subvisible particulate matter.
USP <1788> introduces flow imaging as a technique to provide complementary morphology information and to overcome undercounting and undersizing challenges with the light obscuration method when measuring translucent particles such as proteins and other biological drugs.
Obtain light obscuration data to meet USP regulatory guidelines and verify your results with the highest quality images in FlowCam LO – all in a single instrument and single sample run.
|
Size Range
|
2 µm to 70 µm; Flow imaging module: 10x (~100x magnification) |
|
Solvent compatibility:
|
Wide range of aqueous and organic fluids, including high-viscosity solvents and buffers |
|
Minimum sample Volume
|
100 μL |
|
Sample flow rate
|
0.2 mL/minute |
|
Camera type
|
High resolution (1920 x 1200 pixels) CMOS, monochrome |
|
Software
|
Ease of use instrumentation & fully integrated VisualSpreadsheet software with optional VisualAI software module |


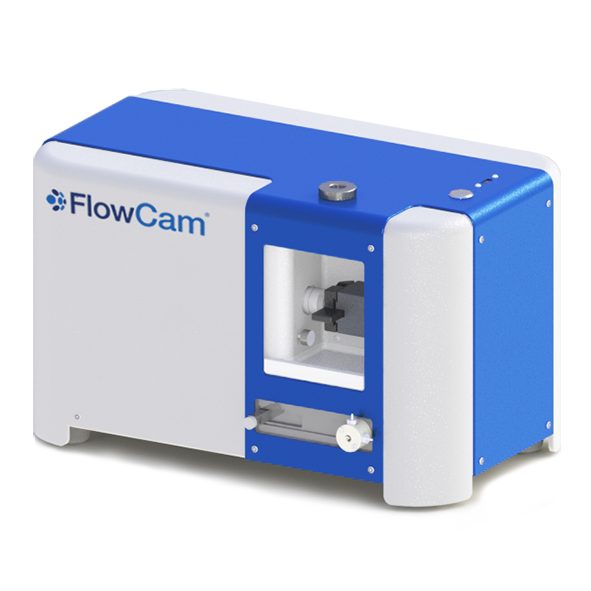
FlowCam 5000 Affordable FIM Analysis – Experience rapid high-resolution imaging, data acquisition, and analysis of microparticles.
FlowCam 5000 flow imaging instrument is an economical, high-value solution for monitoring particles in the 3 μm to 300 μm size range for research, educational, and commercial applications.
FlowCam 5000 is a flow imaging microscopy instrument targeted to your specific needs for a wide range of applications. Its compact footprint allows for flexible use in a variety of settings. Accommodate small to large sample volumes for routine and specialised particle monitoring and research. Experience superior image quality and image-based measurements that yield statistically relevant data.
|
Size Range
|
3 μm to 300 μm |
|
Magnification
|
Single objective (Select 4X or 10X or 20X), manual focus |
|
Minimum sample Volume
|
250 μL |
|
Sample flow rate
|
up to 1 mL/min, configuration specific |
|
Camera type
|
High resolution (1920×1200 pixels) CMOS. Monochrome and color available |
|
Software
|
Easy-to-use instrument with fully integrated VisualSpreadsheet software |

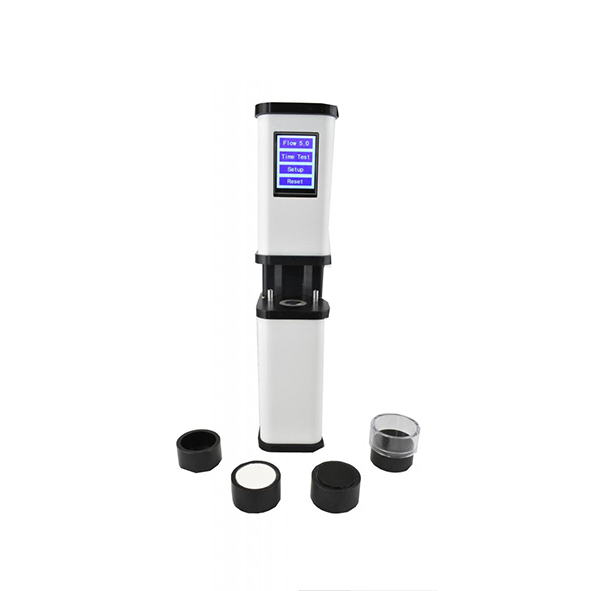
The patented EVOLUTION Powder Tester measures a powder or granular material’s response to environmental stresses. The major stress on a material is pressure. The EPT measures a material’s response to pressure by applying pressure to the material and then measuring its resulting strength. This strength is known as the unconfined yield strength. If a powder is to flow, the force making the powder move must be greater than the unconfined yield strength.
The unconfined yield strength can be measured at one pressure or at many pressures to create what is called a flow function. The flow function presents the material’s gain in strength as more pressure is applied to it.
For most powders and granular materials, the longer the material is exposed to pressure, the higher the unconfined yield strength becomes. Therefore, for powders and granular material that are stored for any length of time, it is essential to study the effects of pressure over time. This is called time unconfined yield strength. In addition, a time flow function can be created. With the EPT, time tests are easy and inexpensive to perform. Time cells consist of sample cells and weights that allow a material to be subjected to various pressures over long periods of time. In addition to pressure, temperature and humidity can affect a material’s strength over time. The EPT time cells are designed so that they can be easily placed in ovens and humidity chambers to study their effects on materials in storage situations. Time is the unmeasured parameter in flow property tests. The reason? Analysis cells for many flow measurement cells are very expensive and do not include the means of applying pressure over long periods.
The EVOLUTION Powder Tester measures the unconfined yield strength and time unconfined yield strength for less than the cost of having 3 or 4 samples tested by independent laboratories.
The unconfined yield strength of a material is the force or stress required to deform or break a material when it is not confined by a container (free unstressed surface). From a testing perspective, the unconfined yield strength can be expressed as the stress required to fail or fracture a consolidated mass of material to initialize flow. The force used to consolidate the mass of material is called the Major Consolidation Stress.
The unconfined yield strength is very important in studying the flowability of materials. The reason is that the force required to get a powder or granular material to flow is directly related to the unconfined yield strength. In simple terms, the powder or granular material will flow if the force acting on it is greater than the unconfined yield strength of the material. A flow factor (ff) is calculated by dividing the major consolidation stress by the unconfined yield strength. This flow factor is used to classify materials into categories such as non-flowing (ff < 1), very cohesive (1 < ff < 2), cohesive ( 2 < ff < 4), easy flowing (4 < ff < 10), and free flowing (ff > 10).
The EVOLUTION Powder Tester measures the unconfined yield strength of a material in a two stage process. First, the material is loaded into a sample cell and compressed by vertical pressure.
The EVOLUTION Powder Tester measures the unconfined yield strength of a material by applying pressure to a sample over time. First, the material is loaded into a sample cell.
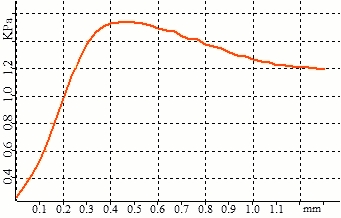
Break Stress Versus Break Strain
The unconfined yield strength of a material typically increases as the pressure on the material increases. A plot of the unconfined yield strength versus the major consolidation stress is called a flow function. The flow function presents the powder or granular material’s response to pressure. Flow functions are very useful for predicting flowability because the forces acting on a material change at various points in a typical process. Therefore, it is important to know how the material responds to these forces.
Flow Function
Flow functions are also very useful for comparing the flow behavior of formulations and blends. As can be seen below, at low pressure the two samples are similar but at higher pressures their behavior diverges dramatically.
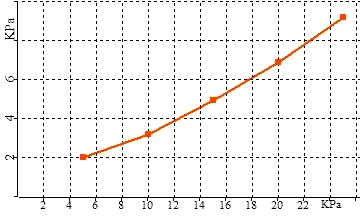
Flow Function Overlay
In addition, the unconfined yield strength of a powder or granular material typically increases the longer it is under the major consolidation stress. For this reason, it is very important to measure the time unconfined yield strength for materials that will be stored for any length of time. A plot of the time unconfined yield strength versus the major consolidation stress is typically called the time flow function.
The unconfined yield strength of a powder or granular material typically increases the longer it is under the major consolidation stress. For this reason, it is very important to measure the time unconfined yield strength for materials that will be stored for any length of time.
The EVOLUTION Powder Tester measures the time unconfined yield strength of a material by applying pressure to a sample over time. First, the material is loaded into a sample cell.
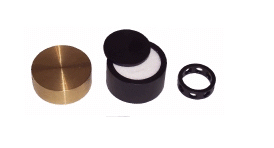
Then, the sample is compressed by vertical pressure applied from a weight or weights. Each weight delivers 2.5 KPa.
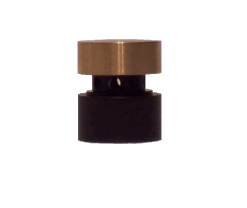
The material is then left for hours or days under controlled conditions to allow the major consolidation stress to act on the material for a specific period of time. These controlled conditions include temperature and humidity. The sample cells are small enough and stable enough to be put in ovens and humidity chambers or simply on laboratory shelves.
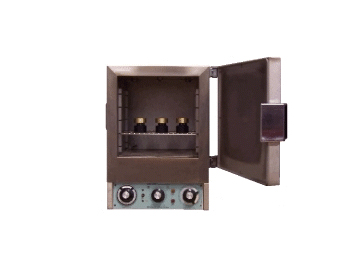
After the material is compressed, the sample is then automatically removed from the sample cell and force is applied to the top of the sample to break or fail the material. The maximum force recorded when breaking the material is the unconfined yield strength.
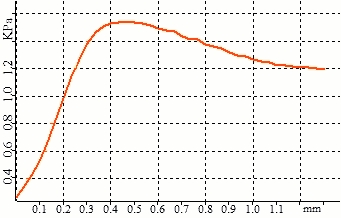
A plot of the time unconfined yield strength versus the major consolidation stress is typically called the time flow function. The time flow function is measured by applying a different number of weights to different sample cells. Each Evolution cell weight corresponds to 5 KPa.
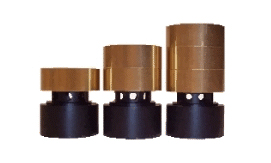
Typically powders and granular materials gain strength as they are exposed to major consolidation stress over time.
Powder flow testers can be difficult to use in quality control or plant settings. The reason is that many testers are difficult to load, time consuming to use, not very precise, and expensive. Not the EVOLUTION Powder Tester. The EPT was designed from the start to be fast, easy to use, precise and inexpensive. In addition, due to its simple design, the EPT requires no routine maintenance. In short, the perfect quality control instrument for measuring flow behavior.
For QC measurements, the EVOLUTION Powder Tester can measure the unconfined yield strength of a sample at one pressure in 3 minutes. Loading the sample into the analysis cell is easy as it is a simple cup. A filling tool is used to overfill the cup and then scrape the top to get the correct amount of sample in the cup. The sample cup it then put on the EPT with the compression top to compress the sample. After compression, the compression top is replaced by the break cap and the unconfined yield strength is measured.
Measuring the unconfined yield strength of a material can provide information as to whether a material is on specification and will handle as expected. Because the test is fast, all shipments or production lots of material can be tested before they are transferred to processes and can create problems.
There are two options for EVOLUTION Powder Tester analysis cells along with time test options for each.
Standard UYS Cell – The patent pending Large UYS Cell is a test cell for measuring the unconfined yield strength of cohesive granular materials. The test volume is 25 cm3
The above cells are sold in sets of five with five weights to allow time tests to be measured.
The Evolution Powder Tester is used to compare the behavior of materials under consolidated load. The only other instruments available for this type of test are powder shear testers. The Evolution was designed specifically as an alternative to shear testers for the following reasons:
1) Shear testers are slow – A typical unconfined yield strength shear test takes 45 minutes. A flow function takes hours. Aside from waiting for data, the slow test time gives the sample material time to changed due to environmental conditions i.e. moisture loss or temperature change. The Evolution requires 3 minutes for an unconfined yield strength test and 15 minutes for a 5 point flow function.
2) Shear testers subject the sample to mechanical stress that causes sample breakdown – The original shear testers used fresh material for every point on the yield locus to ensure that the repeated testing did not change the material. Some instruments use the same material over and over because they are impractical if fresh sample is used each time. This can cause inaccurate strength data due to attrition and prefered particle orientation in the shear zone. This may occur to different degrees in different samples. In addition, a sample should never be exposed to more than one stress level i.e. run a flow function on the same sample. In our experience this causes the flow function to be inaccurate in roughly 80 percent of tested samples. The Evolution uses fresh sample for every test.
3) Shear testers cannot control the stress level on the sample – To compare the unconfined yield strength of samples, it is essential to subject them to exactly the same conditions. This does not happen in shear testers. The major consolidation stress is controlled by the normal load and the shear forces in the sample. The normal load is controlled but the shear stress depends on the sample. This means that flow indexes calculated by shear testers are not performed at the same stress level. This can actually create artificial differences in the measurements between samples. In addition, if one sample tests faster than another, it is exposed to much less mechanical stress. With the Evolution, the stress on the sample is completely controlled and is the same for every sample tested.
4) Time tests are expensive and difficult if impossible with shear testers – Shear test cells are complex which makes them expensive. In addition, they usually have a large lid area which means large forces are needed to keep the sample under pressure for any length of time. These two factors typically preclude time measurements. Some manufacturers claim to run time test by leaving the sample in the instrument for long periods of time. However, this is not practical for two reasons: 1) the instrument cannot be used for other tests during this period; and 2) the sample is not under controlled conditions (unless the whole instrument is put in a glove box – but then temperature and humidity conditions are severely limited). The Evolution was designed for time tests with inexpensive test cells, small lid areas requiring lower forces, and standard weights included. Test time after removal from ovens or humidity chambers is 20 seconds giving the sample no time to change.
The only claim shear tester manufacturers can make against the Evolution is that they are following a standard test for powder strength measurements. However, this is not really true. There are no universally accepted methods or shear cell designs for measuring the true strength of materials. The only real claim shear tester manufacturers can make is that their instruments get the correct strength for the only recognized powder flow standard. This flow standard is BCR limestone. This limestone was a sample that was tested in a round robin method at several European powder flow laboratories using the linear shear cell. The average results of all of the laboratories has become the “standard” value. Therefore, the thinking goes, if an instrument measures the correct value for the limestone then it is accurate for every other sample. The good news is that the Evolution measures the correct values for the limestone standard under all test conditions. We are happy to provide potential customers with a complete report with this data. More good news is that it makes these measurements faster, easier, and less expensively than shear testers.
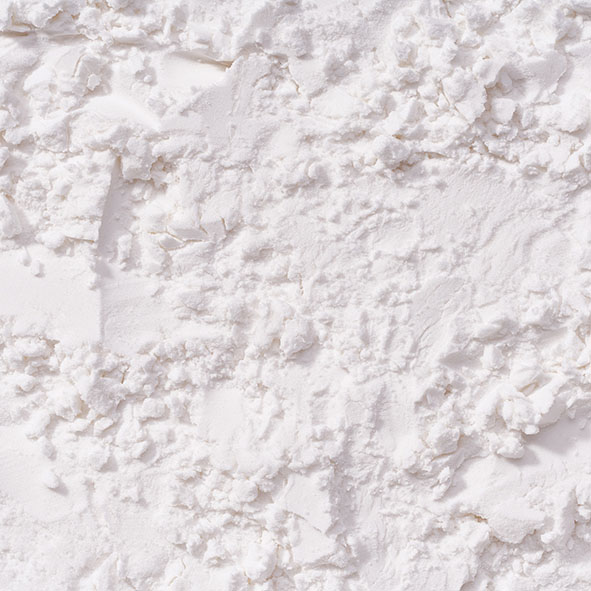

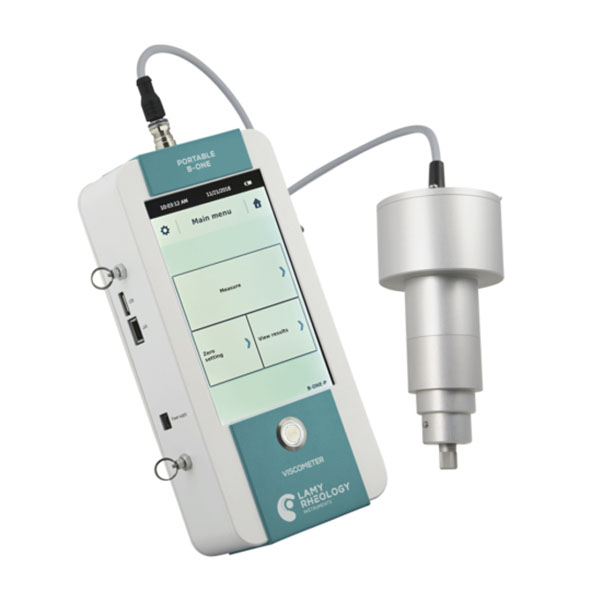
Lamy Rheology is the first French manufacturer of measuring instruments for laboratories, research and industry.
Lamy Rheology is a family-owned and run company that has become the French leader in the rheometer and viscometer market; in 2025, the company is celebrating its 70th birthday. Established by Jean Lamy in 1955, the firm was taken over by his daughter, Danielle Lamy in 1986, then by his grandchildren, Sophie and Eric Martino in 2006, whose takeover marks the completion of a process initiated in the early 90s: for nearly 25 years, Lamy Rheology has been manufacturing its entire range of products in this way.
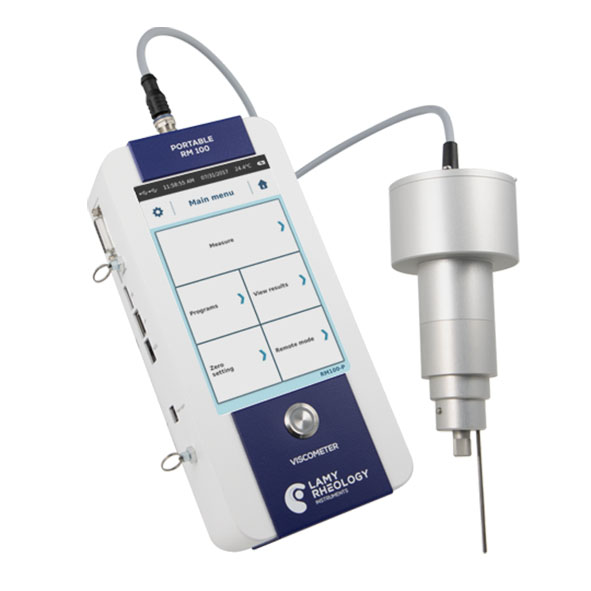
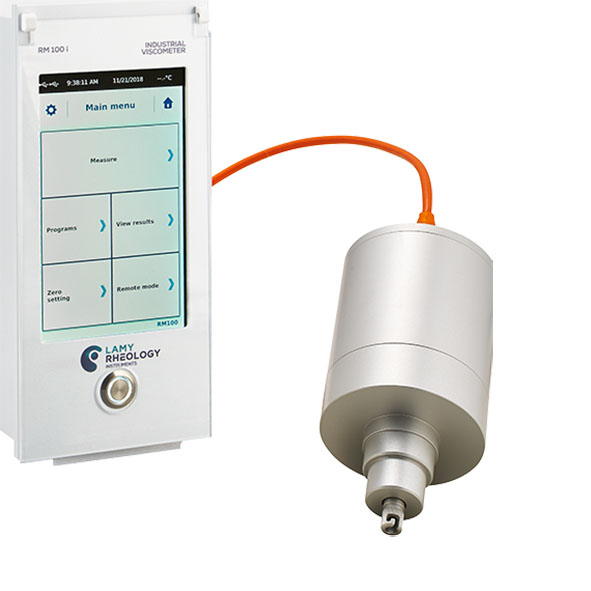
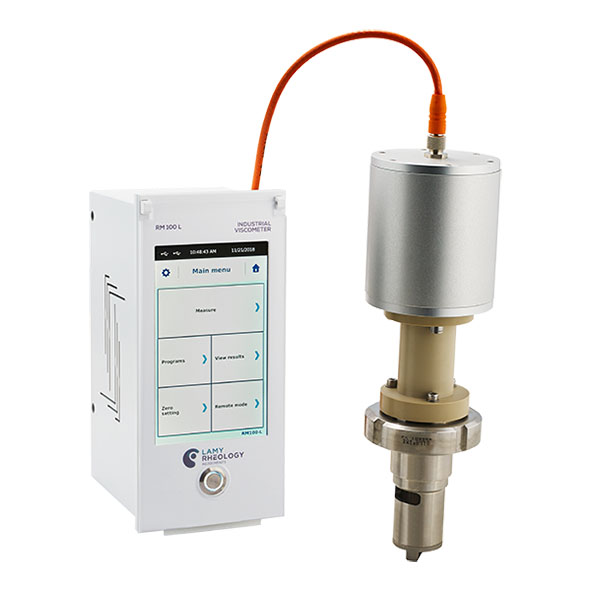
The Multisizer 4e provides accurate particle and cell counting. It is the most accurate and flexible particle characterisation device available, boasting an unparalleled sizing range of 0.2 – 1600 μm. The new 10 μm Aperture allows users to study sub-cellular and micro-particles as small as 200 nm, while the advanced noise reduction system for small apertures improves measurement accuracy.
The Multisizer 4e Coulter Counter is used in a number of different fields for counting and sizing both particles and cells. Applications include: Quality Control, Research and Development, Pharmaceutical Analysis, Biotechnology Applications and Industrial Applications.
|
Particle Sizing Range
|
Diameter: 0.2 – 1,600 µm |
|
Aperture Size
|
10 – 2,000 µm (nominal diameter) |
|
Measurement range
|
Extended: 2 – 80% of aperture size |
|
Measurement linearity
|
Diameter: ± 1% |
|
Dynamic range (accuracy)
|
Diameter: 1 : 40 (extended), 1 :30 (standard), |
|
Processor type
|
High speed signal digitalisation |
|
Number of pulses measured
|
Up to 525,000 per analysis |
|
Resolution
|
User difined |
|
Number of size classes
|
Up to 400 for display of any selected measurement range |
|
Pulse distribution data
|
X axis: time, registration sequence, pulse width |
|
Particle size distribution data
|
X axis: diameter, volume, surface area |
|
Sample registration mode:
total number of particles |
50 – 500,000 counts |
|
Sample registration mode:
number of particles and measurement of parameters |
10 – 100,000 counts |
|
Sample registration mode:
time |
0.1 – 999 seconds with 10 ms increments |
|
Sample registration mode:
volume |
50 – 2,000 µL |
|
Dosage system
|
The dosing pump with even suspension flow across the aperture and volume measurement, error – less than 0.5% |
|
Electrolyte type:
|
Aqueous and non-aqueous electrolyte solutions compatible with glass, fluoropolymers, fluoroelastomers and stainless steel |
|
Aperture current strength range:
|
30 – 6,000 µA with 0.2µA increments |
|
Aperture current stability:
|
± 0.4% of set value |
|
Polarity error
|
Less than 0.5% |
|
Compliance with standards
|
Software is 21 CFR part 11 compliant |
|
Dimensions
|
64 x 61 x 51 cm, weight 45 kg |
|
Power supply requirements
|
230 – 240 V ± 10%, 47 – 63 Hz |
|
Power consumption
|
Less than 55 Watts |
|
Fuses
|
250 V, IEC (5×20 mm) with time delay, 2.0 A |
|
Environmental requirements
|
The instrument is intended for work in enclosed spaces |

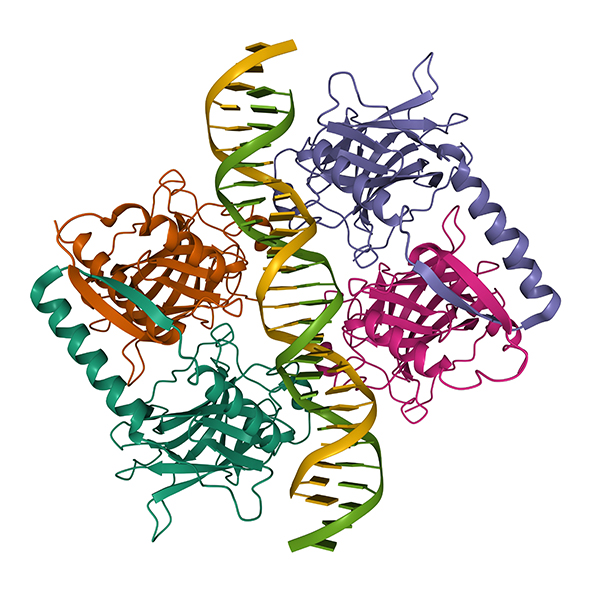
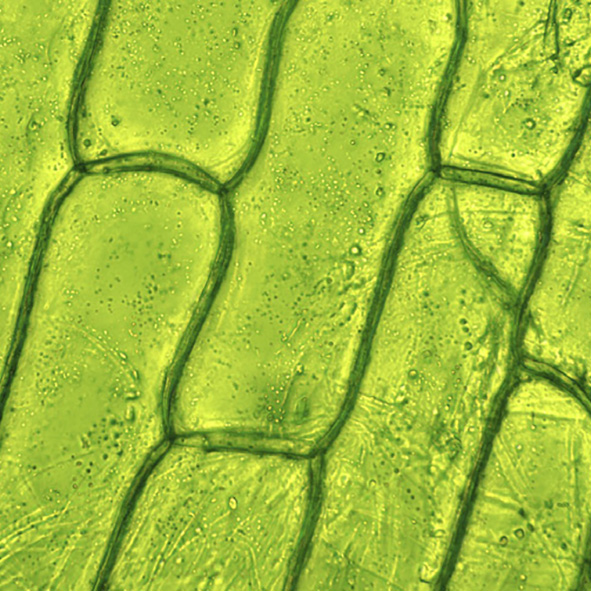

The Multisizer 4e particle sizer and counter is the most accurate and flexible particle characterization device available, boasting an unparalleled sizing range of 0.2 – 1600 μm. The new 10 μm Aperture allows users to study sub-cellular and micro-particles as small as 200 nm, while the advanced noise reduction system for small apertures improves measurement accuracy.
Generated data are processed using patented digital pulse processing technology and can be saved and later re-analyzed. This technology provides ultra high resolution and accuracy unattainable through any other technologies: detection of 1 particle in 1 ml of a sample with the optimal instrument configuration. Analysis results are not dependent on particle shape, structure, or optical properties.
It uses the Coulter principle to detect particles via electrical zone sensing, regardless of the particle’s nature or optical properties. This makes it an ideal tool for detecting and counting a wide variety of particles, such as:

Extend your particle imaging capabilities from 300 μm to 5 mm with FlowCam Macro for environmental research and materials characterisation.
Obtain detailed morphological data along with accurate counting and sizing measurements to enable differentiation of diverse particle types.
FlowCam Macro is the flow imaging microscope of choice for visible particles. Direct, image-based morphological measurements give you details not available with other particle analysis methods.
Monitor the sphericity of manufactured beads, the shape and structure of fibers, polymers, crystals, and powders, or achieve taxonomic identification of zooplankton with superior particle images and image analysis VisualSpreadsheet software.
|
Size Range
|
300 μm to 5 mm |
|
Magnification
|
0.5X |
|
FlowCell
|
High-capacity industrial peristaltic pump, 2 mm (deep) or 5 mm (deep) flow cell |
|
Sample flow rate
|
Up to 750 mL/minute, flow through or recirculating |
|
Camera type
|
High resolution (1920×1200 pixels) CMOS. Monochrome |
|
Software
|
Easy-to-use instrument with fully integrated VisualSpreadsheet software |
The Volution Powder Flow Tester (VFT) measures the flow properties and bulk characteristics of powders and bulk solids. The system uses an annular shear cell to measure a powder’s response to consolidating pressure using the yield locus technique. This allows the system to measure the cohesion and angle of internal friction of the material as well as its unconfined yield strength. The system also measures wall friction and compressibilty. Flow functions can be measured by testing the materials at different pressures.
Powder flowability is defined as the ease with which a powder will flow for a specified set of conditions. Powder is generally defined as a collection of individual solid particles surrounded by gas phases. This includes granular materials, bulk solids, pelletised materials, etc. An accepted method for quantifying powder flowability is the Mohr-Coulomb Model. The Mohr-Coulomb Model is a limit state or “Go/ No Go” model and can be used to accurately predict flow behavior. This model quantifies powder flowability with two measurable parameters, Cohesion and Angle of Internal Friction, and two derived parameters, Unconfined Yield Strength and Major Consolidation Stress.
Cohesion is a measure of particle to particle bonding strength. This bonding strength results from various inter-particle forces generated by electrical charges, van der Waals forces, moisture, etc. The Angle of Internal Friction is a measure of the force required to cause particles to move or slide on each other. Internal friction is influenced by many parameters including particle surface friction, particle shape, hardness, particle size, etc. distribution, etc. Cohesion and Angle of Internal friction are determined by measuring a powder’s yield locus. The Yield Locus is a graph of the shear force require to cause a powder to yield or fail relative to compressive load. Cohesion is the intercept of the yield locus and the angle of internal friction is the slope.
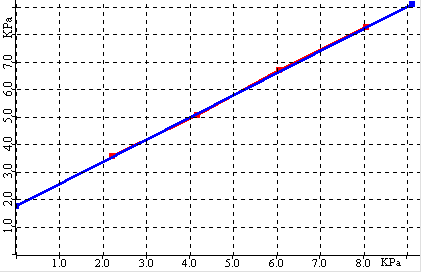
Yield Locus
Shear Stress versus Normal Stress
The Unconfined Yield Strength is the shear stress needed to fail or fracture a consolidated powder mass to initialize flow. The force used to consolidate the powder mass is called the Major Consolidation Stress. In other words, the unconfined yield strength is a measure of the strength of a powder mass when the powder experiences major consolidation stress. The Unconfined Yield Strength is calculated using the below formula:
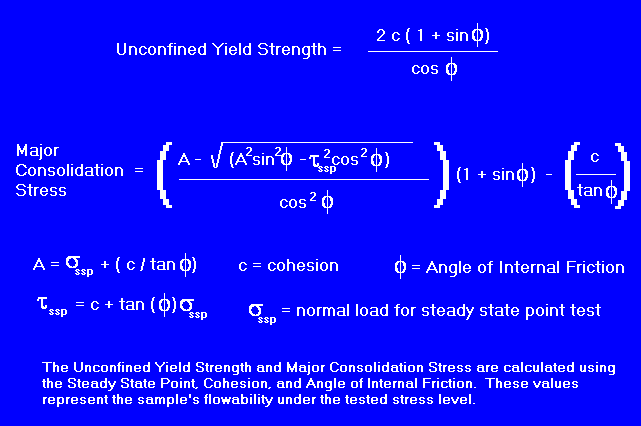
A Flow Function Plot can be generated by plotting a powder’s Unconfined Yield Strength versus Major Consolidation Stress. The flow function plot is a quantitative measure of the flowability of the powder. The inverse of the slope of the flow function plot can be used as a flow index. Generally, the closer a powder’s flow function is to the x-axis, the more easily the powder will flow. The Volution is used to measure a powder’s cohesion and angle of internal friction at various loads to generate its flow function and thus quantify its flow behavior.
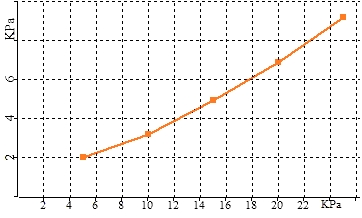
The yield locus analysis is designed to determine the angle of internal friction and cohesion for a sample material and then calculate its overall strength under compressive load.This is achieved by measuring the failure strength of a sample under various loads after consolidation under a preset pre-shear load. Plotting the failure strength of the material under different loads generates a yield locus for the sample under the pre-shear load.
The test consists of three parts for every point on the yield locus: consolidation, steady state and failure analysis. Depending on the type of cell used, failure points can be generated on the same sample or fresh sample can be used for each failure point. Generally 3 to 5 points are used to generate the yield locus due to the time required for each point as well as the wear on the sample. If time consolidation is used, a delay time occurs after the steady state step.
In the consolidation step, the sample in the measurement cell is compressed to the preset normal load.With linear cells, this step includes twisting of the lid to help pack the material in the cell to what is called its “critical consolidation”.Critical consolidation is defined as the sample density at which it will reach a steady shear with minimal shear travel.This state in indicated by constant sample density or by a leveling off of the drop in normal load after each twist of the cell lid.For rotational cells, the consolidation step simply consists of compressing the sample until the normal load is reached.
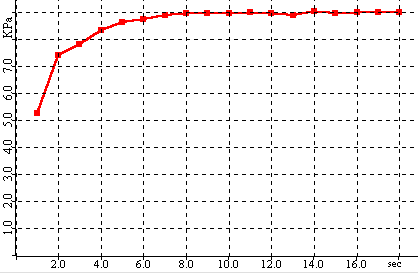
Sample Consolidation
Normal Load versus Time
In the steady state step, shear stress is applied to the sample until the measured shear force and sample volume become stable. With linear cells, the shear stress is applied by moving pushing the lower ring of the cell at a fixed rate relative to the upper ring.For rotational cells, the lid is rotated a fixed rate. The steady state point is the point at which the shear force becomes stable.At the steady state point, the sample has reached a repeatable, stable density relative to the applied compressive load.
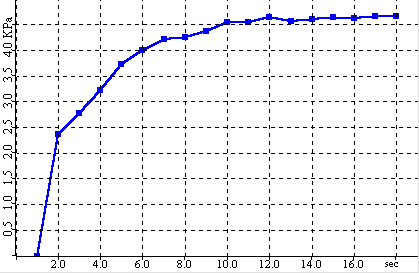
Steady State
Shear Force versus Time
In the analysis step, the shear stress is reduced to zero by reversing the shear stress mechanism.The normal load is then reduced to a predetermined level called the shear load and the shear stress is again applied.The shear forces rises as the sample resists shearing until a maximum shear force is reached.At this point the sample fails and the shear force drops rapidly.The generate yield point consists of the maximum shear force and the shear load.
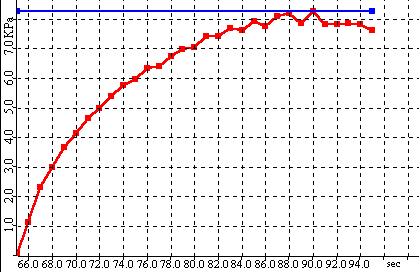
Static Failure Analysis
Shear Force versus Time
By repeating the above sequence 3 to 5 times, a series of yield points are generated from which a yield locus can be plotted.The yield points are selected so that they are in the linear portion of the yield locus.
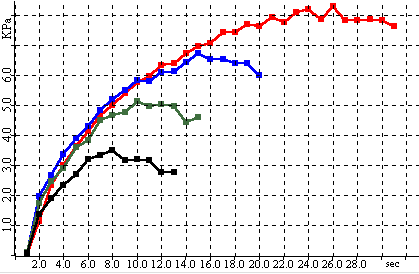
Static Failure Points
Shear Force versus Time
A least squares regression is performed to calculate a linear function for the yield locus.The slope of the calculated line is the angle of internal friction.The intercept of the line is the cohesion.From the cohesion, angle of internal friction and steady state point, the unconfined yield strength and major consolidation stress are calculated using Mohr Coulomb equations.
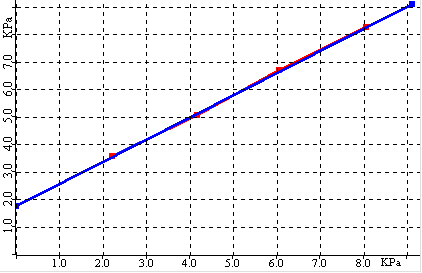
Static Yield Locus
Shear Force versus Normal Load
Because the yield points are generated by measuring several steady states for the same sample, the steady state point used for the strength calculation is the average of all the steady state points.In addition, to account for the effect of the steady state on the measured shear force during failure analysis, the measured shear force can be adjusted based on whether its steady state was higher or lower than the average.This is called prorating and can correct for variations in sample density for each yield point measurement.
Compressibility is calculated using the sample’s initial density and density after the consolidation step.
Static yield analysis generates the strength of a static or not-moving sample.This would be the condition in a silo or chute when the sample is at rest.Therefore, to get the sample to flow, the force used to move the sample must be greater than the static yield strength.
The wall friction analysis is designed to determine the kinematic angle of surface friction for a sample material against a container material. This is achieved by measuring the friction force between the container material and the sample material under different loads to generate a wall yield locus. The analysis consists of three parts: consolidation, steady state and analysis. All parts are automatic.
In the consolidation step, the sample in the measurement cell is compressed to the preset starting load. With linear cells, this step includes twisting of the lid to help pack the material in the cell to what is called its “critical consolidation”. Critical consolidation is defined as the sample density at which it will reach a steady friction with minimal shear travel. This state in indicated by constant sample density or by a leveling off of the drop in normal load after each twist of the cell lid. For rotational cells, the consolidation step simply consists of compressing the sample until the normal load is reached.
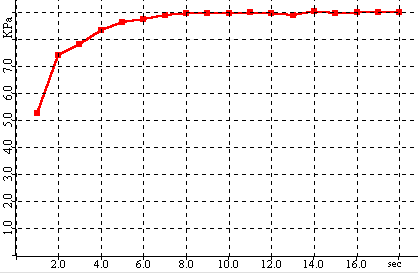
Sample Consolidation
Normal Load versus Time
In the steady state step, shear stress is applied to the sample until the measured friction force and sample volume become stable. With linear cells, the shear stress is applied by moving pushing the container material at a fixed rate relative to the upper ring. For rotational cells, the lid is rotated a fixed rate. The steady state point is the point at which the shear force becomes stable. At the steady state point, the sample has reached a repeatable, stable density relative to the applied compressive load.
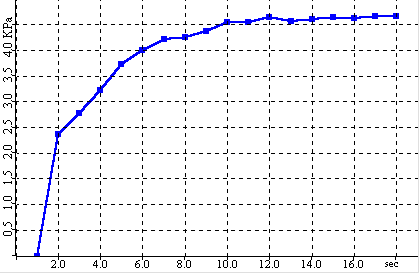
Steady State
Shear Force versus Time
In the analysis step, the friction force under the starting load is maintained until it is stable. The load on the sample is then reduced to a preset level and the friction force is again maintained until it is stable. This is repeated several times to produce a friction value for several applied loads.
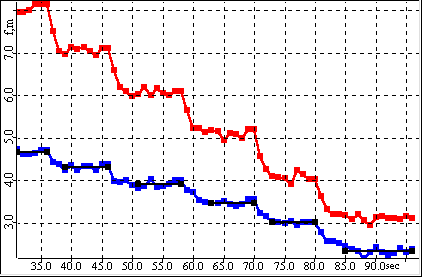
Friction Points
Shear Force and Load vs Time
The shear versus load data is then plotted to create a wall yield locus. A least squares regression is performed to calculate a linear function for the yield locus. The slope of the calculated line is the kinematic angle of surface friction.
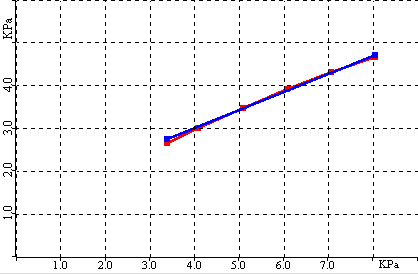
Friction Yield Locus
Shear Force vs Normal Load
If you need a shear tester, the Volution Powder Flow Tester (VFT) is the one to get. The VFT offers the following advantages over other other powder shear testers on the market:
Low Cost: The VFT is very affordable compared to other shear testers. The reason is that we designed the instrument ourselves. We do not pay university licensing fees or royalties because we designed it using our 20 years of experience in the powder flow business. We also did not use external engineering companies which further reduces our costs. These savings are passed on to users.
Large Pressure Range – Due to our heavy duty frame and drive system, the VFT can deliver up to 50 kg of vertical force. That’s about 6 times more than competing instruments.
Automatic Sample Weighing: The VFT weighs the sample automatically during the measurement eliminating the need for an external balance and the time required to weight the sample.
Normal Load Correction Due To Sample Density: The VFT automatically adjusts the normal force applied to the sample lid to correct for the force from the powder mass above the shear zone. This is very important for dense powders. Other systems do not make this adjustment resulting in shear force that are artificially high.
True Time Testing: The analysis cells of the VFT can be removed and kept under load off of the instrument. This means time tests can be performed while other samples are being run on the instrument. Other shear testers have no capability to run time tests or you must leave the sample on the instrument for hours and hours so no other testing can be done.
Can Test Powders and Granular Materials : Due to the geometry of the test cell, the Volution can test both powders and granular materials. Other shear testers cannot. The reason is that the dimensions of the test cells for other instruments are too small to allow large particles to be measured. It is generally recommended that a layer of a minimum of 20 particles separate shear planes from cell edges. Some cells are not deep enough. Other cells have vanes will not allow large particles to enter or will only a thin layer.

Strive for excellence in all you see.
The Bettersizer S3 Plus particle size and shape analyser combines laser diffraction and dynamic image analysis in one instrument. It can measure the size and shape of particles from 0.01 µm to 3500 µm. Its exceptional sensitivity for either ultrafine particles or oversized particles, and unsurpassed resolution, make it the most powerful size and shape analyser for enthusiastic researchers who conduct top scientific research.
The Bettersizer S3 Plus achieves exceptional resolution and sensitivity for particle size measurements. The DLOI system allows the size distributions of polydisperse samples to be determined precisely, and the size changes of products to be detected sensitively.
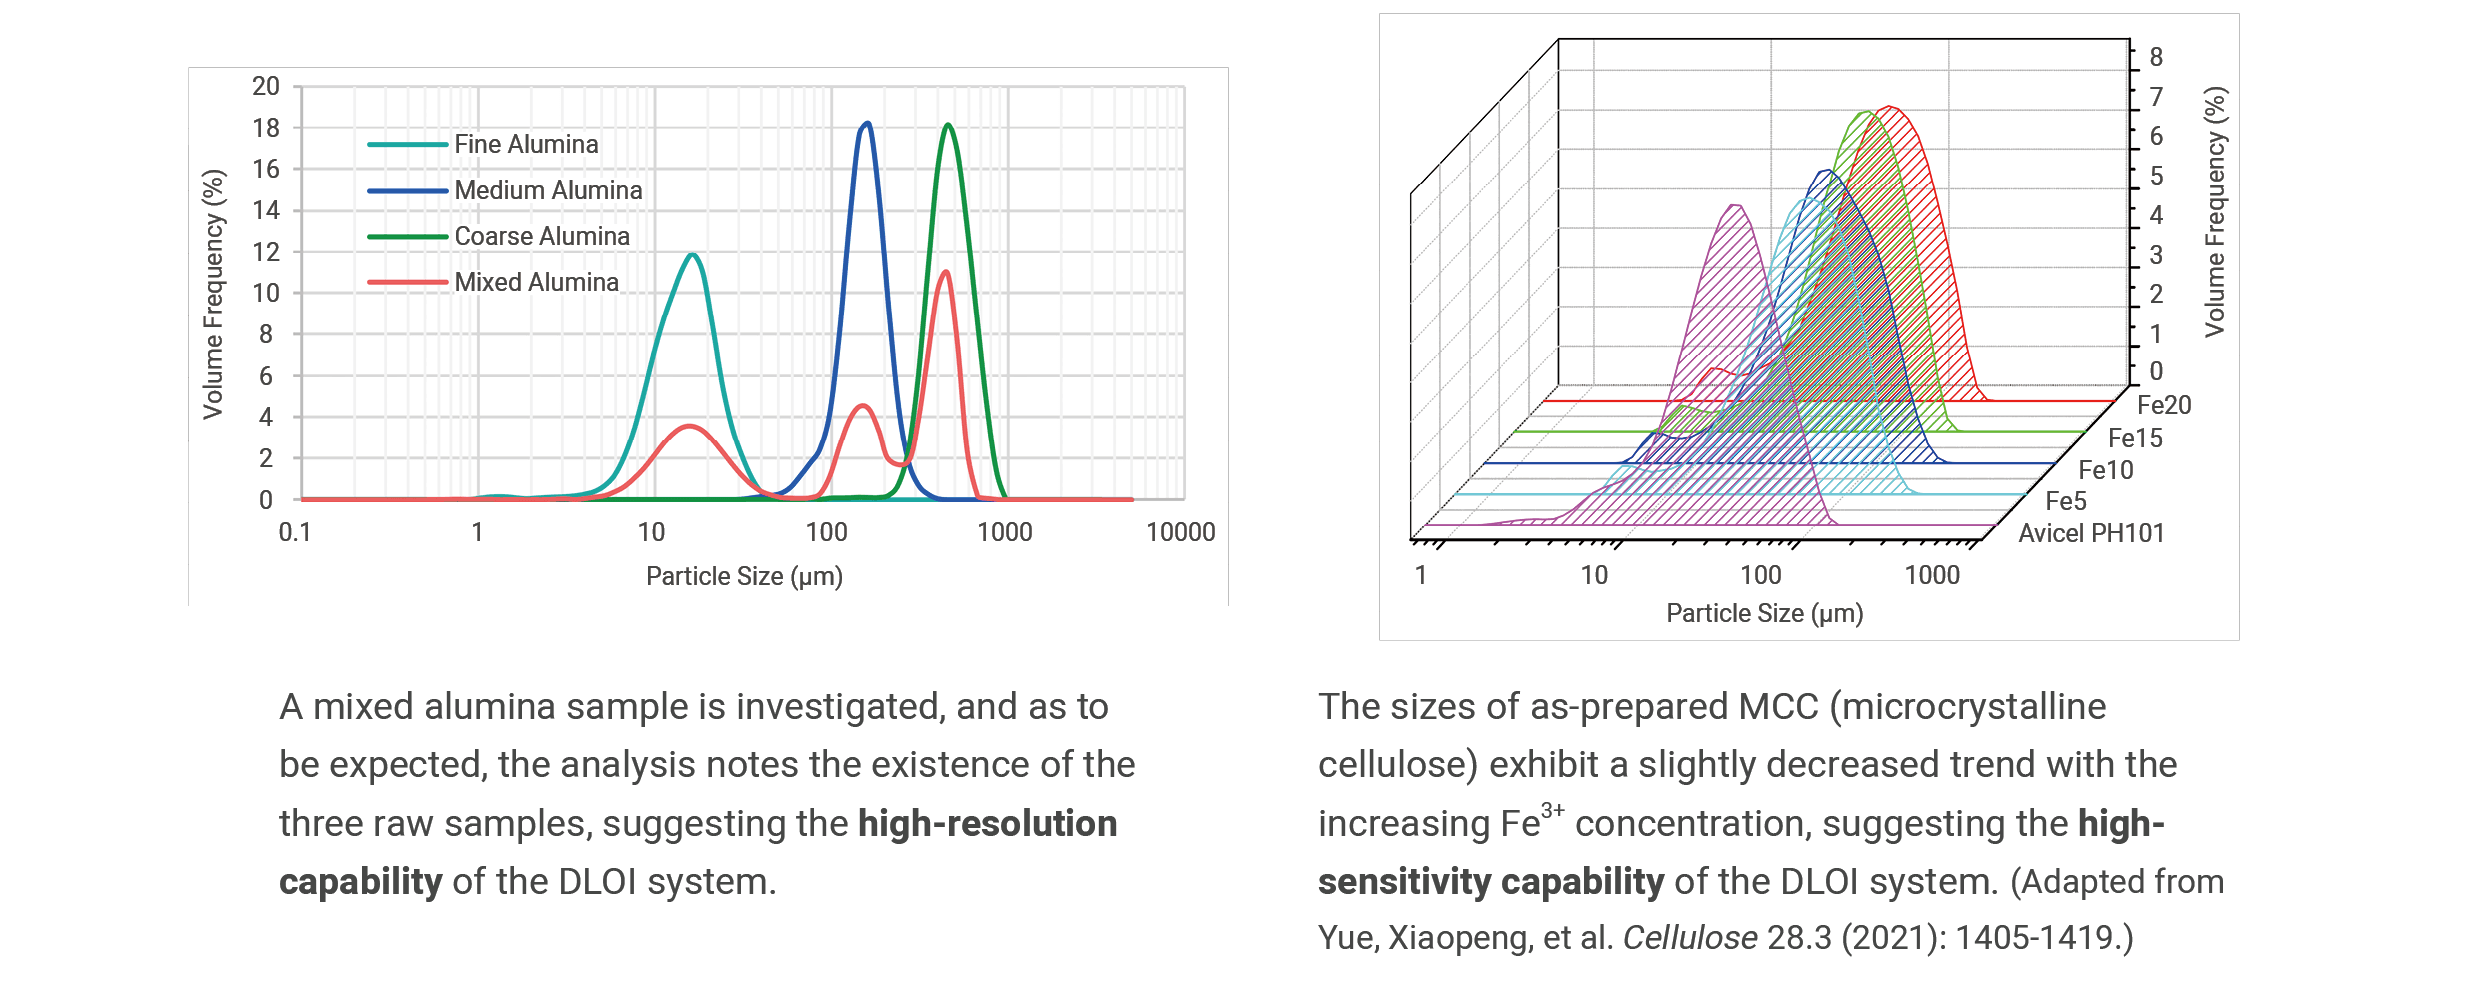
An example of additive manufacturing for shape analysis using the Bettersizer S3 Plus is shown below. A representative number of individual particles are recorded from two AlSi10Mg samples, and the number-weighted aspect ratio and circularity are evaluated in compliance with ISO standards. (Adapted from F. Schleife, C. Oetzel. Chem. Ing. Tech. 93.8 (2021): 1199–1203.)
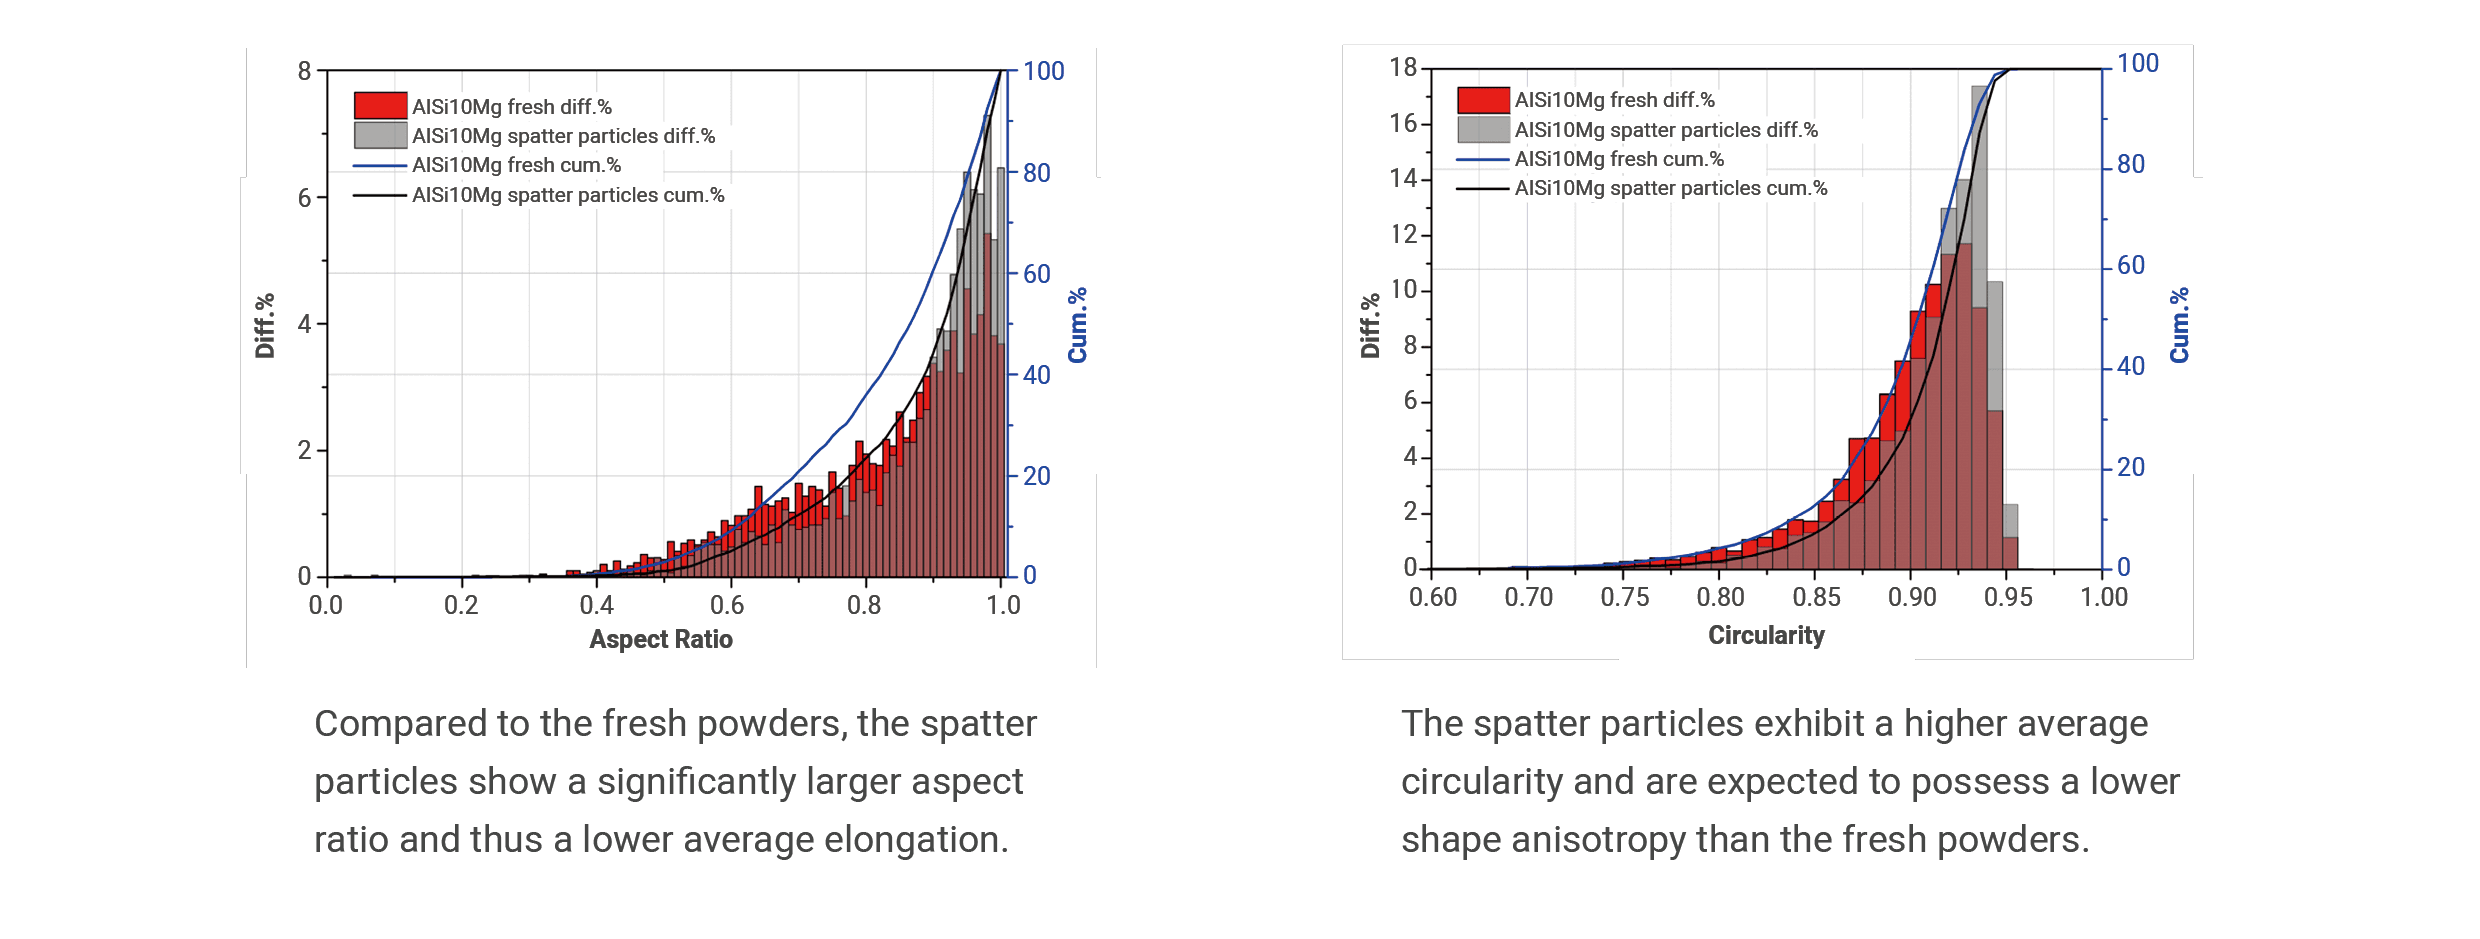
Laser diffraction in combination with image analysis can sensitively detect oversized particles that are statistically underrepresented within a wide-distributed sample, such as oversized grains, agglomerates, air bubbles, etc. An example of an off-specification abrasive is displayed below. The Bettersizer S3 Plus confirms the presence of oversized particles, by showing a size peak at around 120 μm and the images of overly coarse particles.
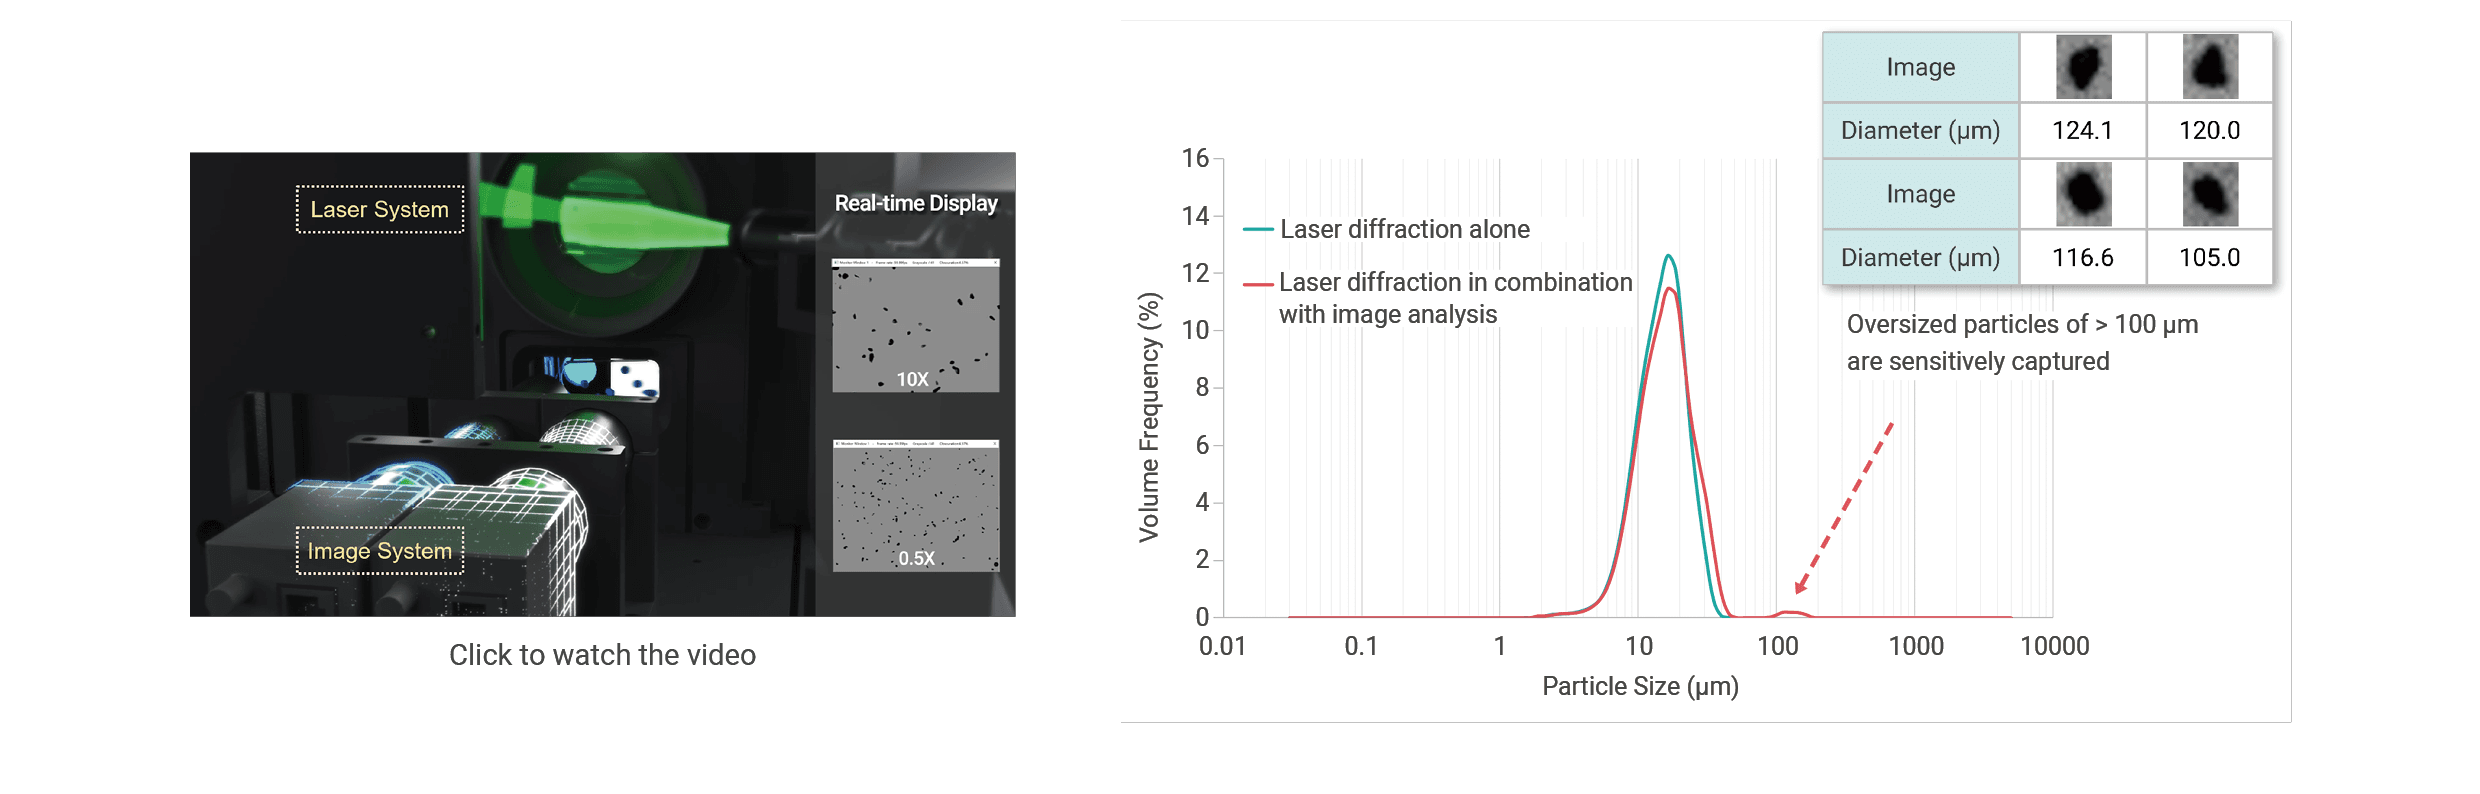
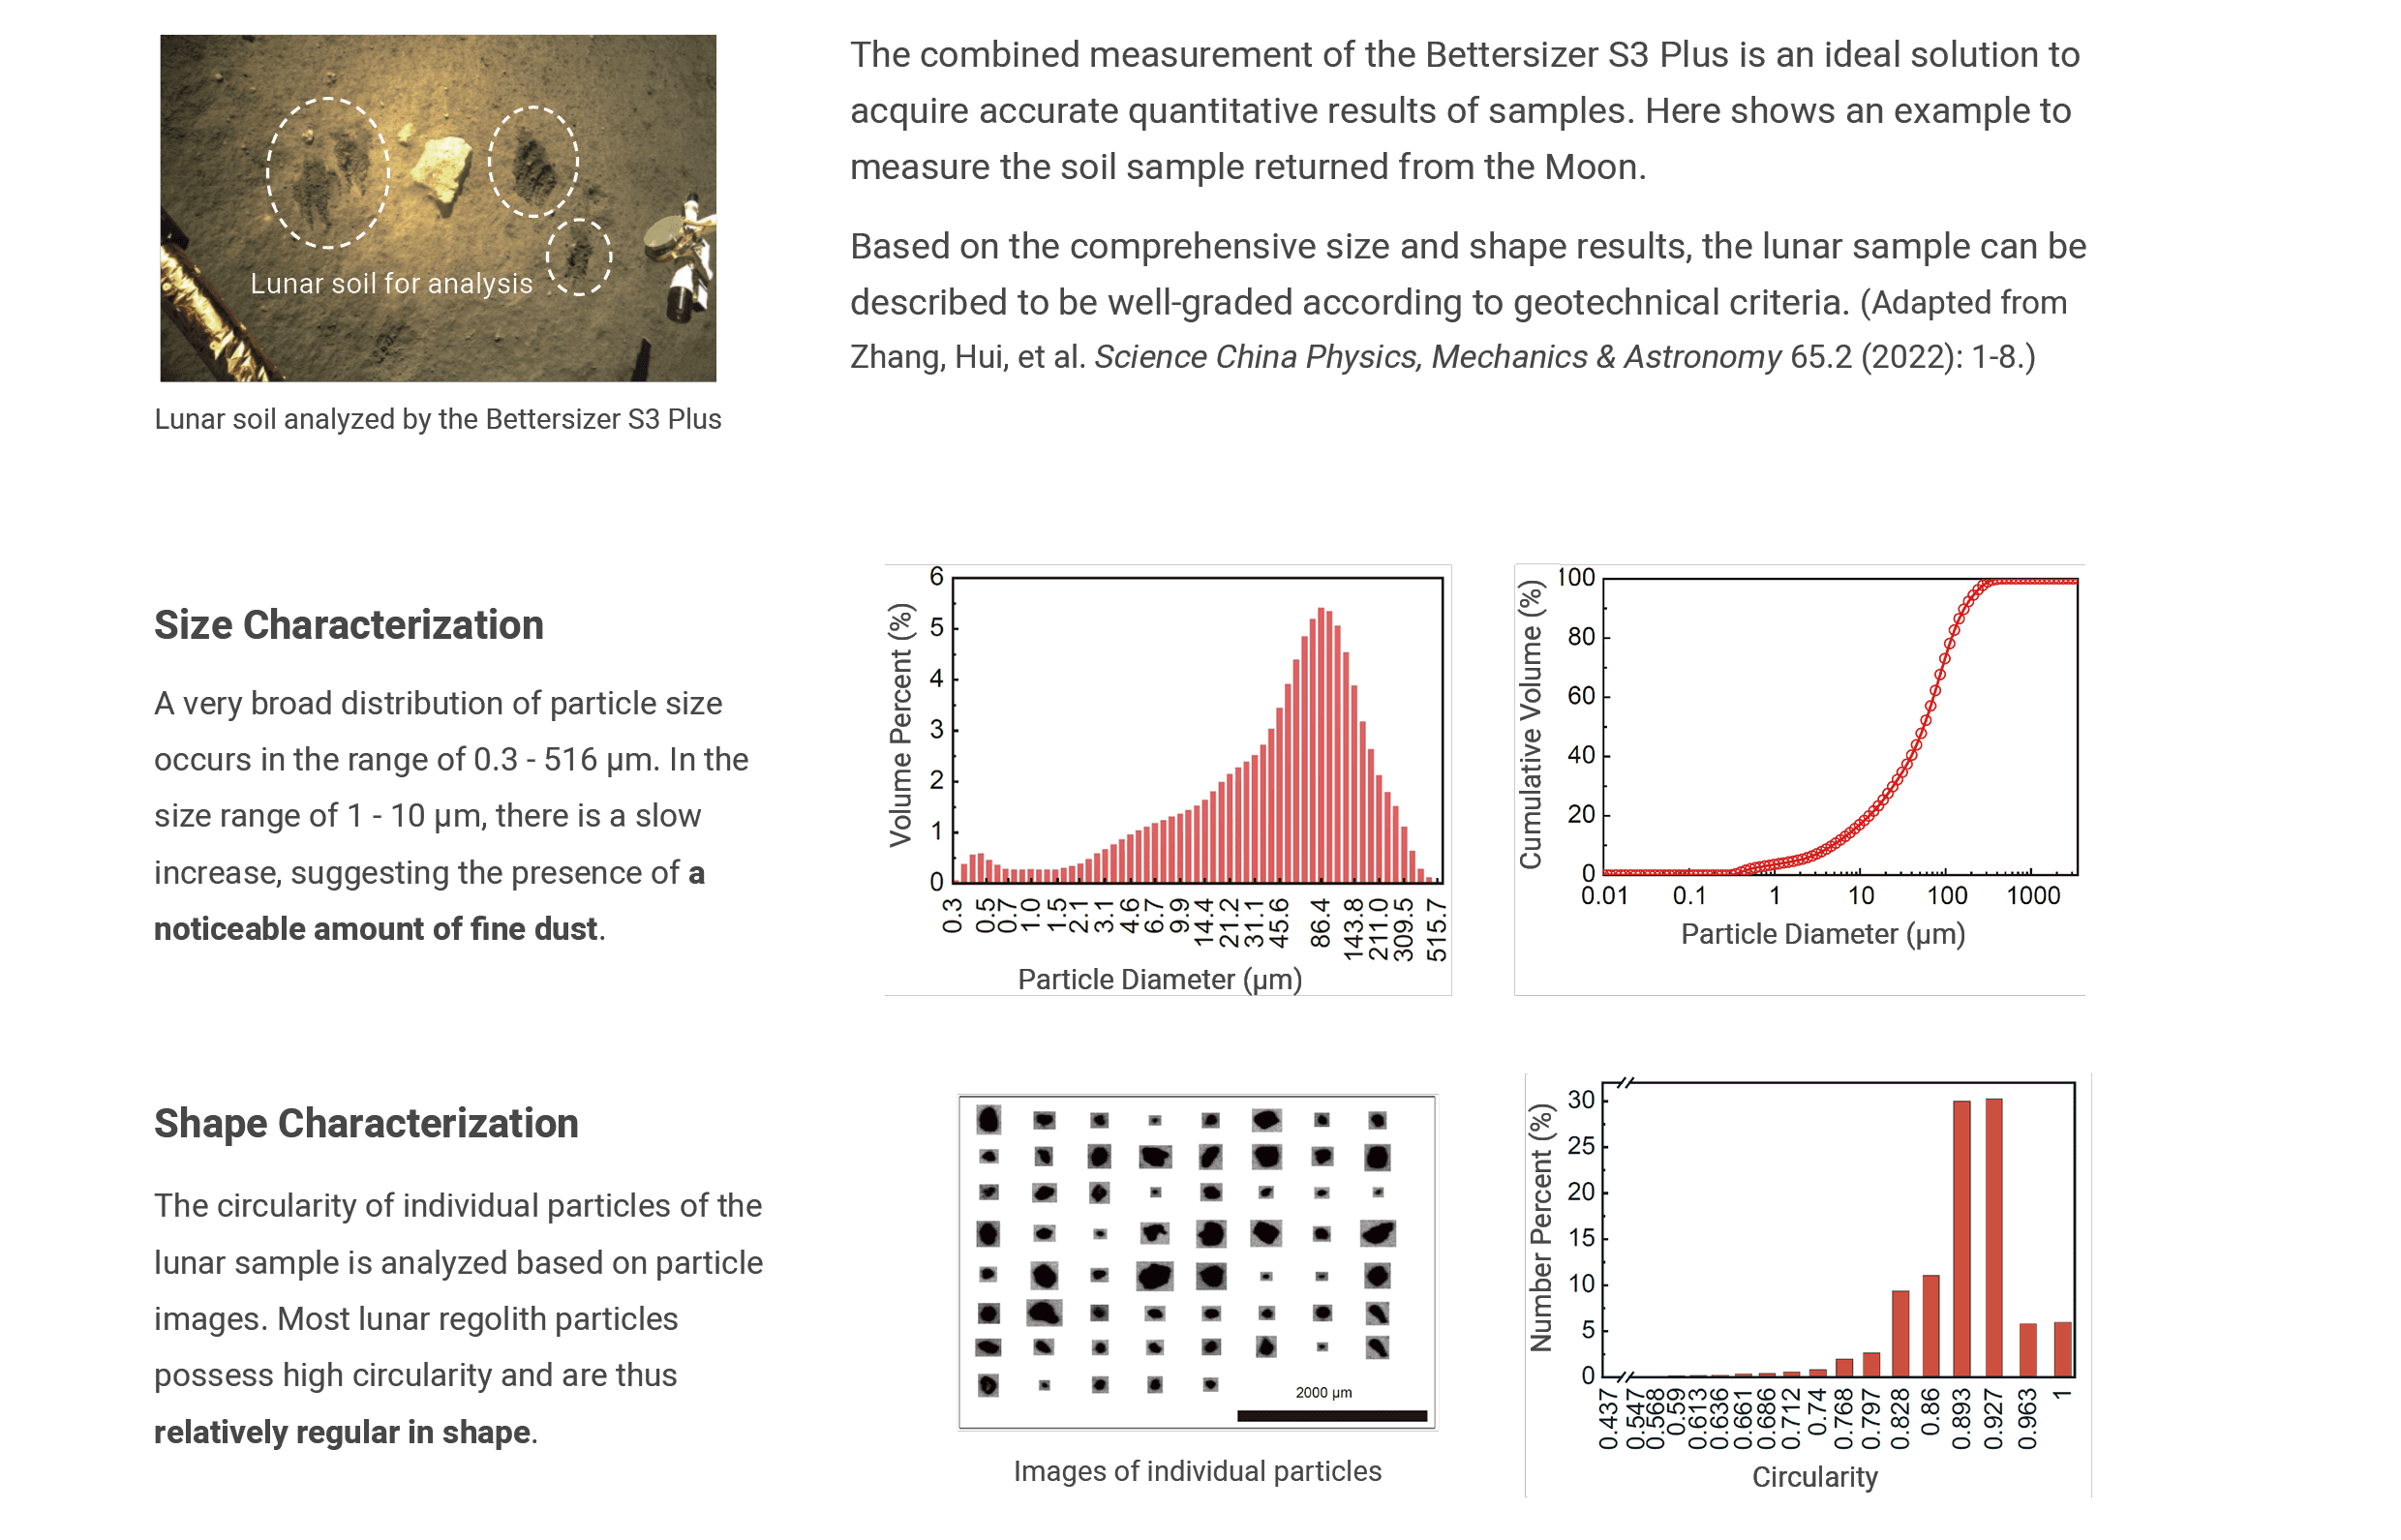
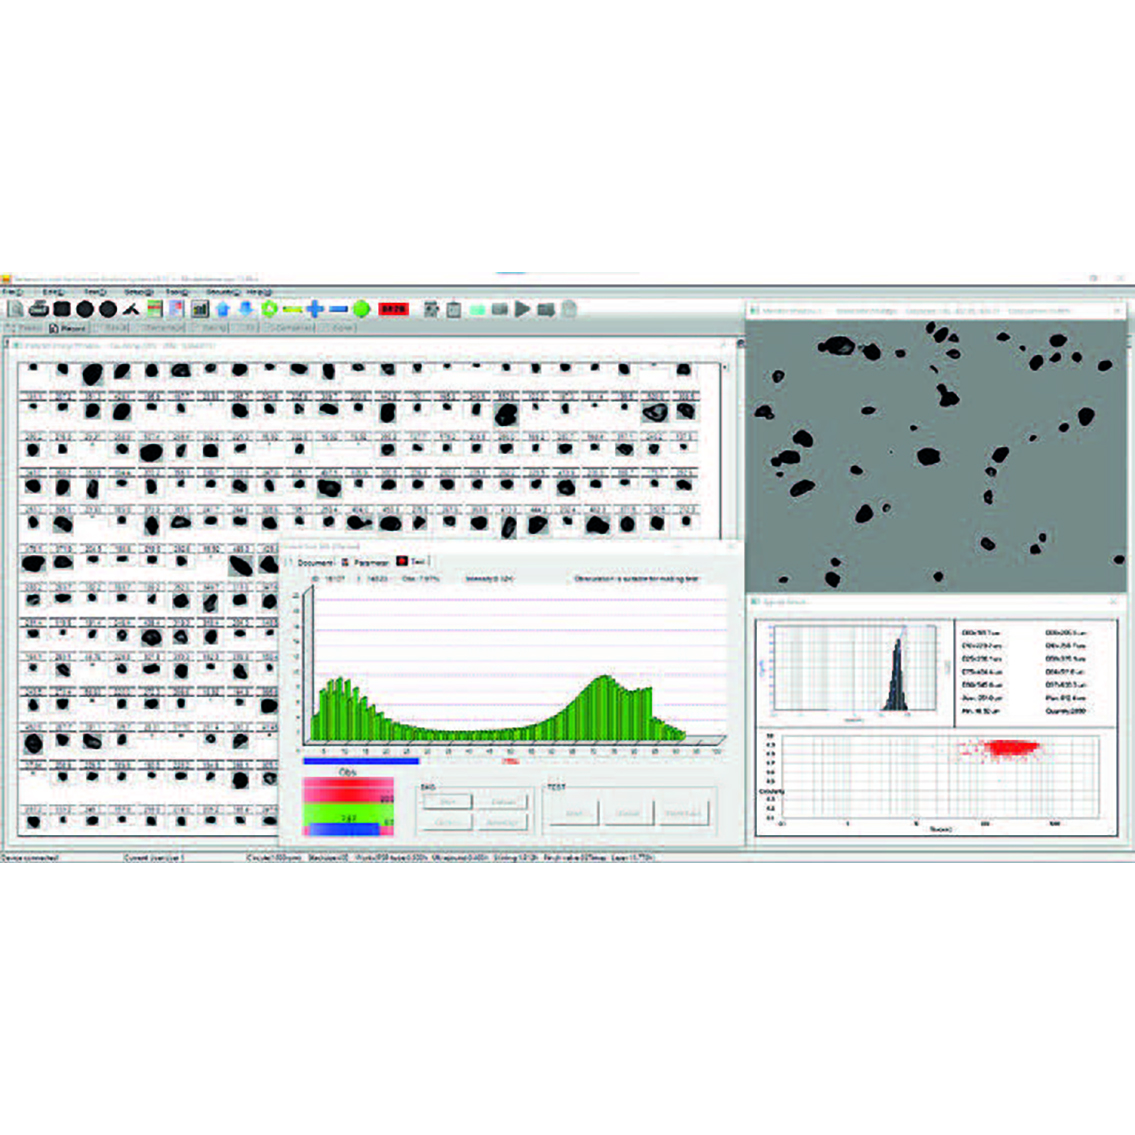
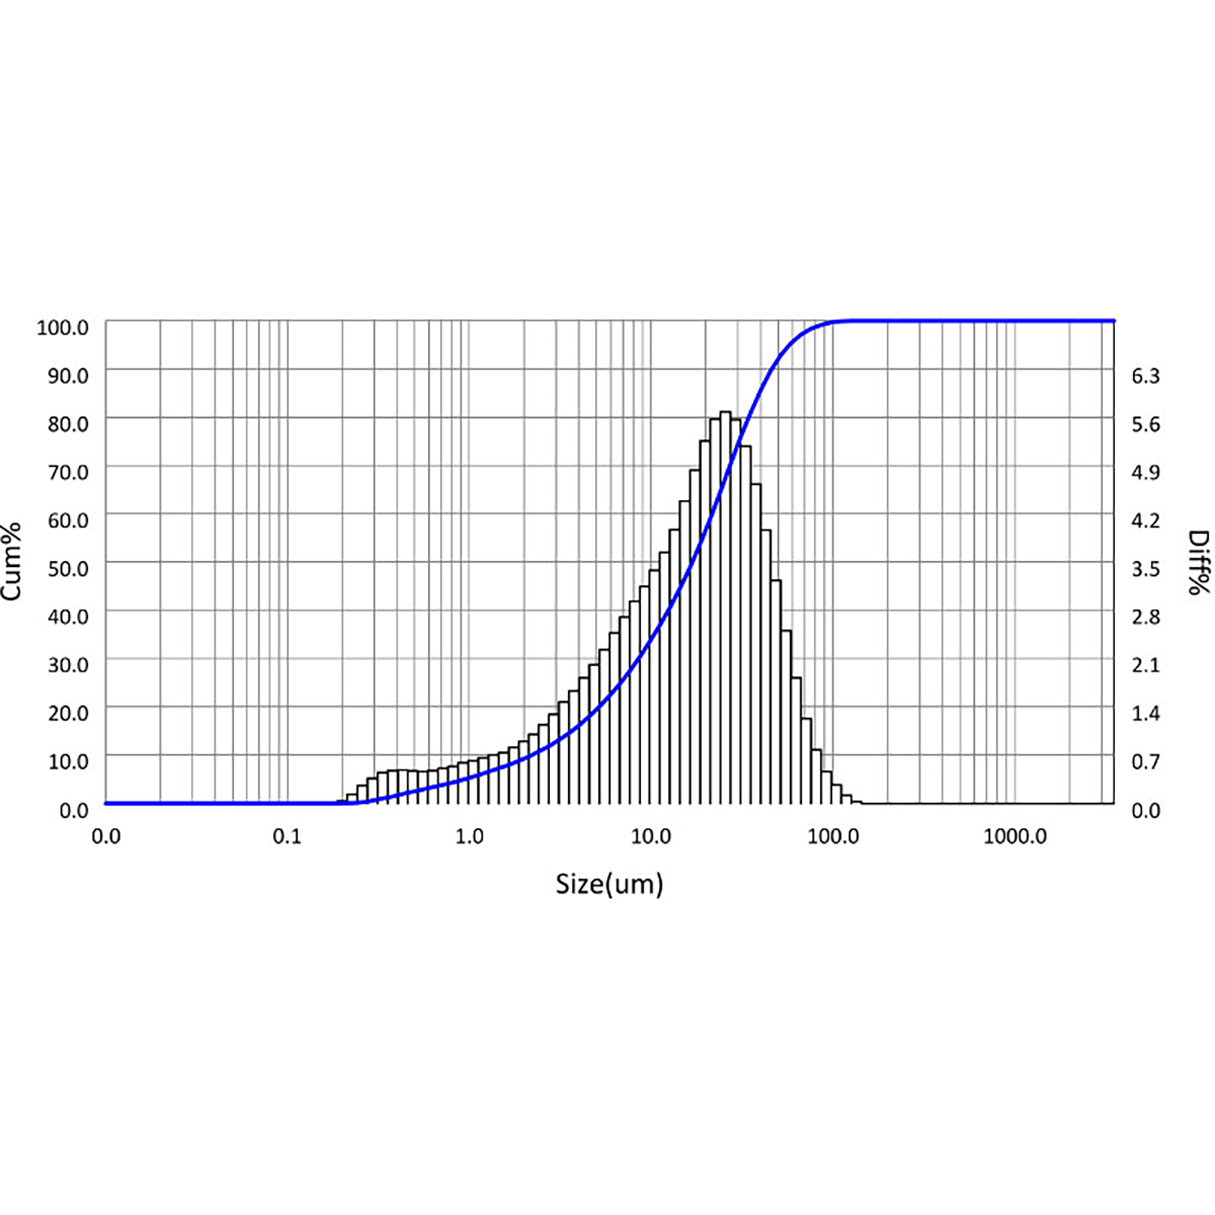
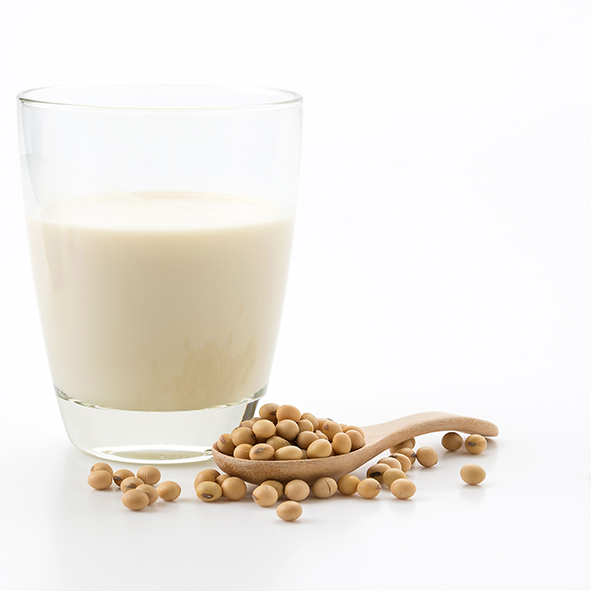
Soy Milk
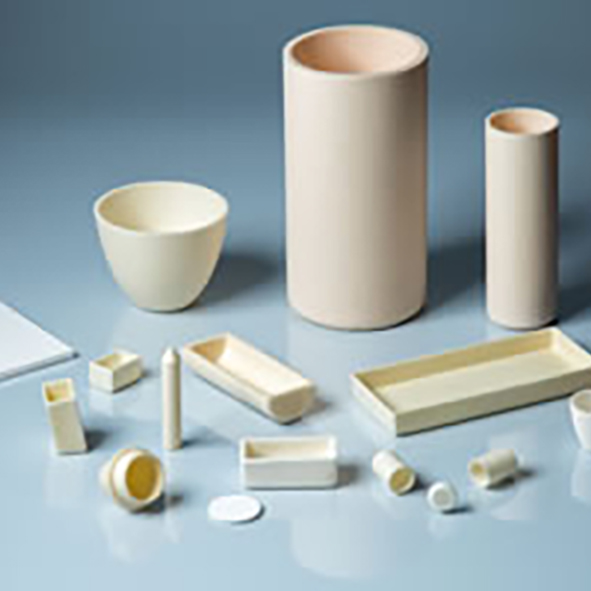
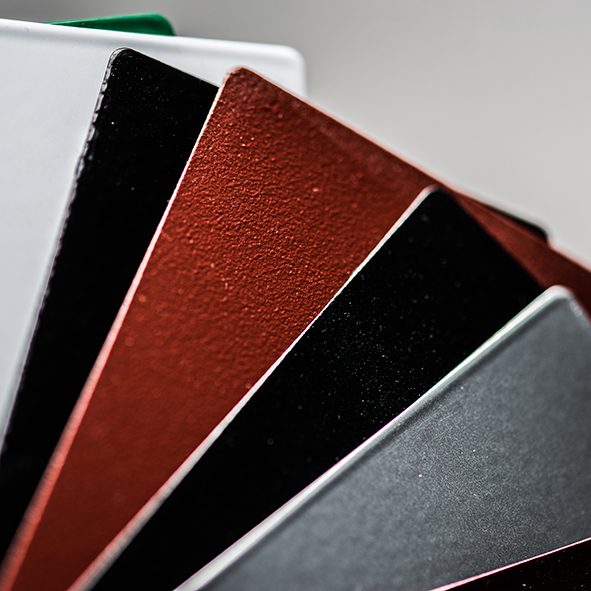
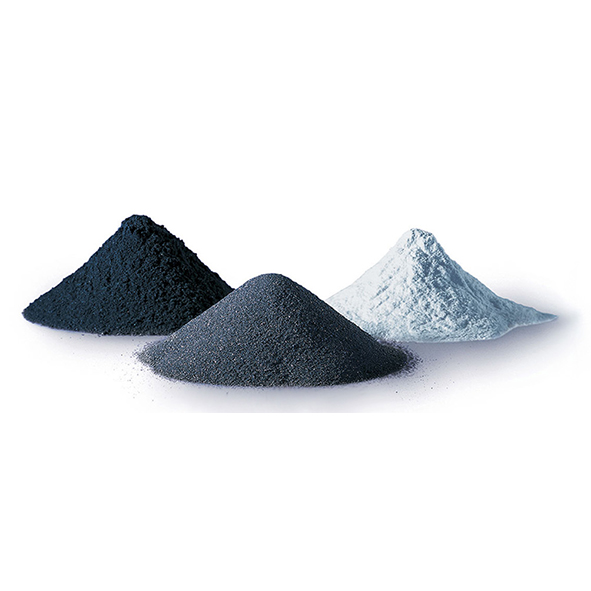


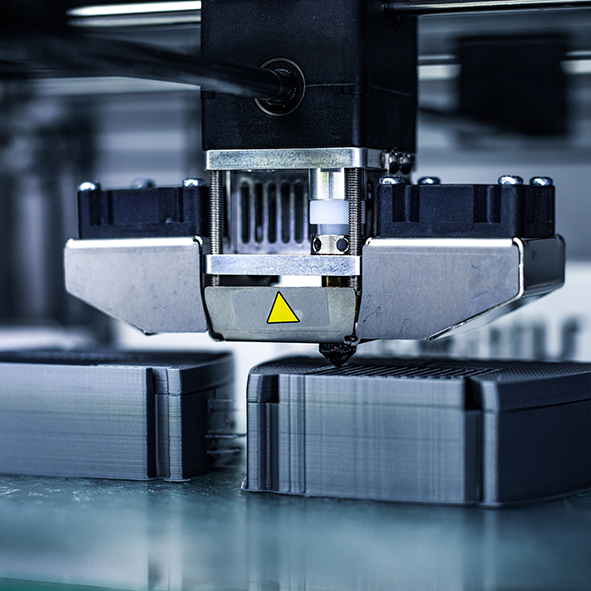
|
Particle size distribution
|
Suspension, emulsion, dry powders |
|
Particle shape
|
Suspension, emulsion, dry powders |
|
Principle
|
Laser diffraction and dynamic image technologies |
|
Analysis
|
Mie scattering theory and Fraunhofer diffraction theory |
|
Typical measurement time
|
Less than 10 seconds |
|
Measuring range
|
0.01 – 3500 μm (Laser System) |
|
Accuracy
|
<0.5% (NIST certified standards) |
|
Repeatability
|
<0.5% (NIST certified standards) |
|
Number of size classes
|
≤100 (adjustable) |
|
Feeding mode
|
Automatic circulation or semi-automatic circulation |
|
Special functions
|
Refractive index measurement, SOP settings |
|
Image recognition
|
Up to 120 fps, up to 10,000 particles per min |
|
Optical system
|
Patented DLOI (Dual Lenses & Oblique Incidence) System |
|
Laser
|
Polarized light-pumped solid-state laser (10 mW / 532 nm) |
|
Detector
|
96 detectors (forward, lateral and backward arrangements) |
|
Measuring angle
|
0.02 – 165° |
|
CDC cameras
|
0.5x and 10x * |
|
Image analysis
|
1.2 megapixels |
|
Circulation speed
|
300 – 2500 r/min |
|
Circulation flow rate
|
3000 – 8000 mL/min |
|
Ultrasonication
|
Dry run protection, Max 50 W (adjustable) |
|
Circulation tank capacity
|
600 mL |
|
Conformity
|
21 CFR Part 11, ISO 13320, ISO 13322, USP <429>, CE |
|
Report
|
Customizable reporting |
|
Dimensions (L x W x H)
|
820 × 610 × 290 mm |
|
Weight
|
48 kg |
|
Voltage
|
DC 24 V, 50 / 60 Hz, 20 W |
|
Computer interface
|
At least one high-speed USB 2.0 or USB 3.0 port required |
|
Operating system
|
Windows 7 / Windows 10 |
|
Hardware specification
|
Intel Core i7, 8GB RAM, 500GB HD, two PCI-E X16 interfaces |
* The Bettersizer S3 Plus is also available in a single camera (0.5x) model. Contact us for more information.
The BT-A60 is a durable, automatic and high-throughput sampling system. It delivers maximum laboratory automation for sample measurements, reducing your labor costs while improving productivity and laboratory efficiency. The compact design saves valuable bench space while allowing up to 60 different samples to be measured in a single run. Compatible with Bettersizer S3 Plus and Bettersizer 2600, the BT-A60 offers 24/7 fully automated sample analysis to meet your various analytical applications.
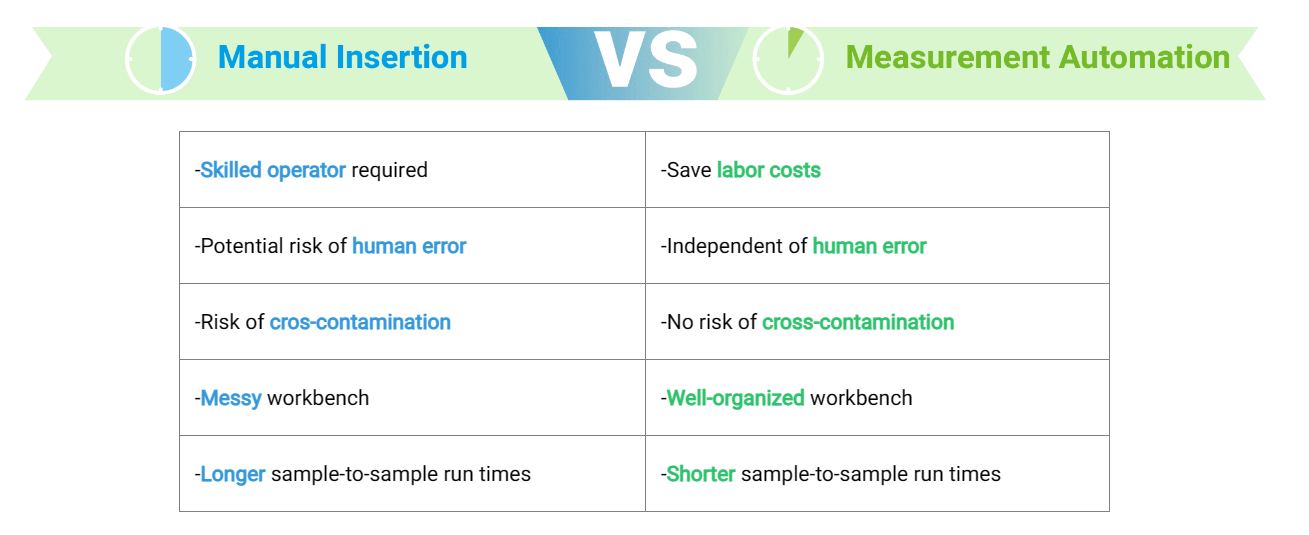

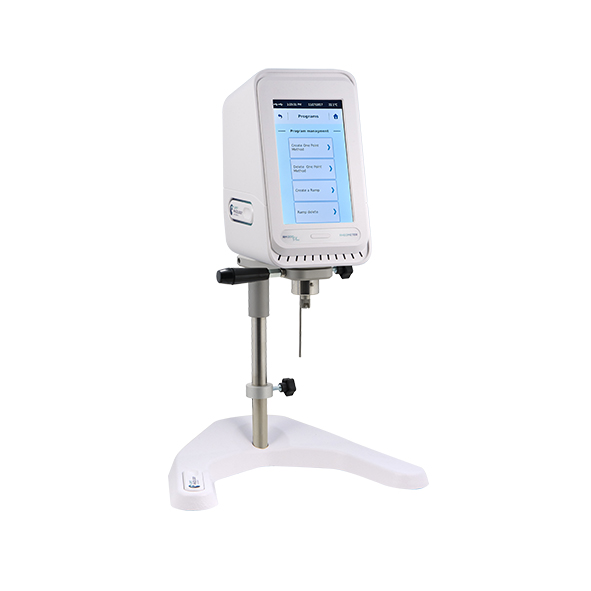
Lamy Rheology is the first French manufacturer of measuring instruments for laboratories, research and industry.
Lamy Rheology is a family-owned and run company that has become the French leader in the rheometer and viscometer market; in 2015, the company is celebrating its 60th birthday. Established by Jean Lamy in 1955, the firm was taken over by his daughter, Danielle Lamy in 1986, then by his grandchildren, Sophie and Eric Martino in 2006, whose takeover marks the completion of a process initiated in the early 90s: for nearly 15 years, Lamy Rheology has been manufacturing its entire range of products in this way.
The firm, from the Rhône-Alpes, is the only French manufacturer of rheometers and viscometers. It takes advantage of being “Made in France”, not for its label, but for its real quality ethics. Generation after generation, it has stayed true to this course of action and because of this the company has established itself as a key player in the industry, recognised for the team’s commitment.
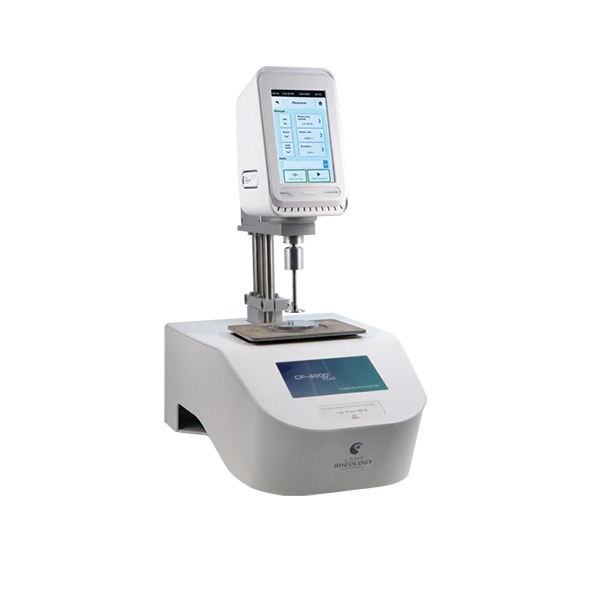
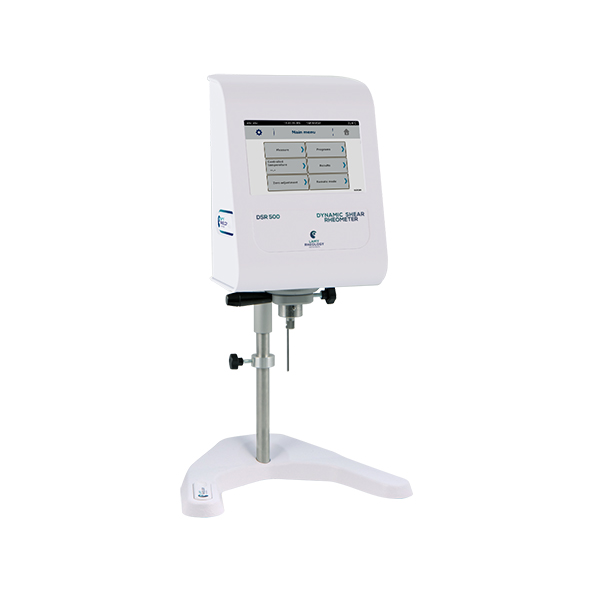
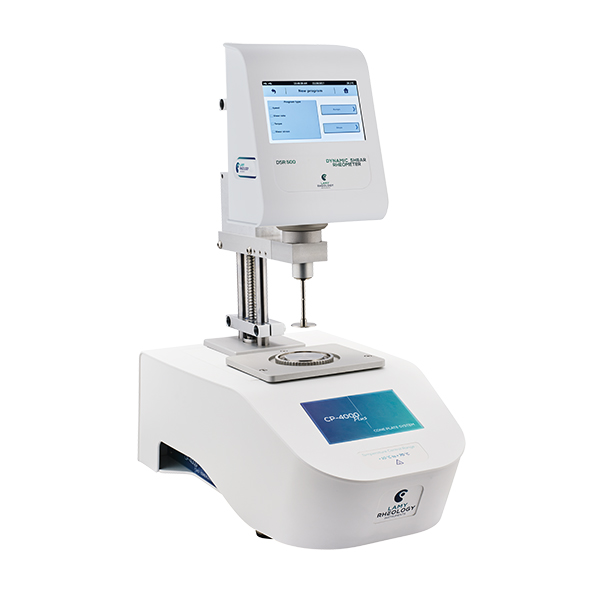


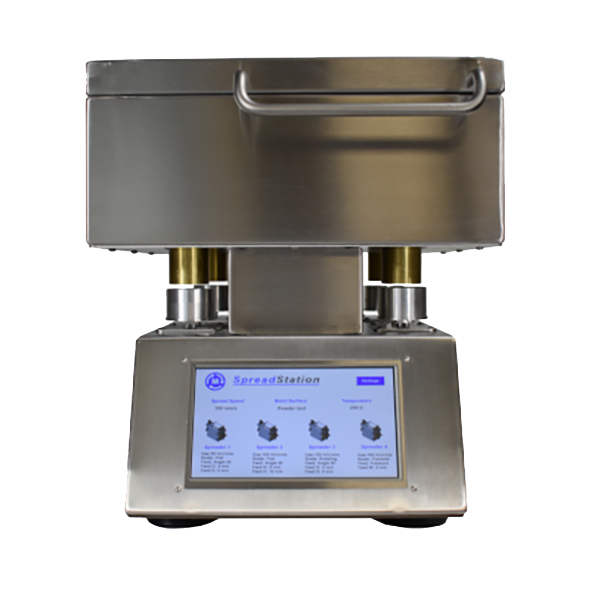
The SpreadStation Powder Spreadability Analyser measures the spreadability of powders by actually spreading powders in a layer and then analysing the properties of the layer.
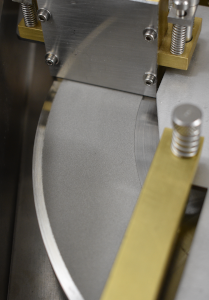
Powder is loaded into a spreading device that includes a feeder and a spreading plate. The spreading device rests on a build plate and has an adjustable gap at the bottom to control the powder layer thickness. The build plate is rotated to create linear motion between the spreading device and the build plate. This linear motion spreads the powder in a layer on the build plate.
Images of the created layer are captured and the thickness of the layer is measured using a laser distance sensor. The layer is then removed from the build plate by a scraping blade and is weighed.
The SpreadStation can be equipped with up to four spreaders and the build plate can be a solid plate or a powder bed. Spreading speed is programmable from 1 to 300 mm/s. Spreading layer thickness can be set from 20 micrometers to 2 millimeters. The build area can be heated to 250C.
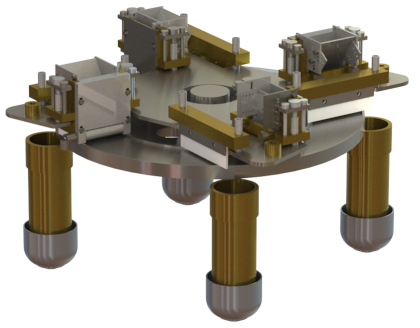
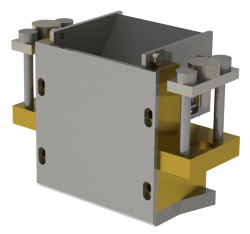
The SpreadStation powder spreadability analyser can be equipped with up to four powder spreading assemblies. Each spreading assembly is set up with a powder feeding system and a powder spreading plate. The feeders and spreading plates can be changed quickly to study different printer parameters and simulate different printer feeding and spreading systems. The spreadering assemblies are removed from the SpreadStation for cleaning between samples. This requires approximately 30 seconds.
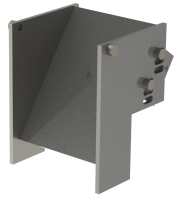
The angle feeder allows the feeding angle of the sample powder to be adjusted as well as the gap at the bottom of the feeder.
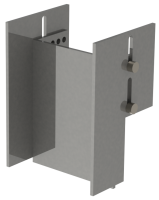
The straight feeder allows the feeding width and the feeding gap from the sample powder to be adjusted.
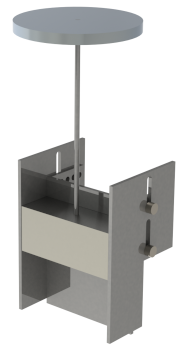
The pressure feeder allows the pressure on the top of the sample powder to be adjusted as well as the feeding width and feeding gap.
The powder feeders deliver sample powder to the spreading zone of the spreading assembly. The feeder can be removed without tools for cleaning and quick changes. The gap that the powder must flow through to reach the spreading zone can be adjusted for all feeders. The height of the exit of the feeder can also be adjusted.
The flat spreading plate has a flat bottom and can be rigid or flexible. The standard plate is made of polished stainless steel but many optional materials are available.
The round spreading plate has a round profile at the bottom.
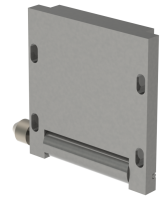
The rotating roller plate uses a rotating roller to spread the test powder. The rotating direction and rotation speed is controlled by software.
The powder spreaders determine how the powder layer is formed when the powder is being spread. The spreading gap (leveling height) is set when installing the spreader on the spreading assembly.
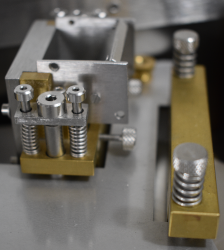
Layers created by the SpreadStation are analysed using three independent measuring systems and produce three independent sets of data. The measuring systems are: 1) weighting system; 2) laser triangulation distance system; and imaging system.
The weighting system measures the mass of powder being spread by the SpreadStation over time. The weighting system uses load cells to measure the powder mass and 24 bit A to D converters to digitize the load cell readings.
The spreading efficiency is the ratio of the spreading density to the material density. A spreading efficiency of 100% means the spread layer is equivalent to a solid layer of material while a spreading efficiency of 0% means there is no powder in the layer.
The density of the layer of the powder, units grams/cm3
The mass of powder exiting the spreader over time, units grams/cm
The uniformity of the layer density from the start of the test to the end of the test, units %
The laser triangulation system measures the thickness of the powder layer created by the SpreadStation.
The thickness of the powder layer measured over time, units micrometres
The uniformity of the powder layer thickness, units %
The imaging system consists of digital cameras and LED lighting that collect images of the powder layers created by the SpreadStation. Image analysis software is then used to extract information about the layer quality.
The area coverage is the ratio of the area in the image covered by powder to the total area of the image, units %
The image analysis software determines if there are any channels is the powder layer and if so the width of the channel, units % channels, width millimetres
The image analysis software determines if there are any waves in the powder layer and their widths, units % waves, width millimetres
|
Spread Speed |
Spread Efficiency |
Layer Density |
Spread Rate |
Layer Thickness |
|---|---|---|---|---|
| 50 mm/s | 49.3% | 3.95 g/cm3 | 206 mg/cm | 158 um |
| 100 mm/s | 38.3% | 3.06 g/cm3 | 157 mg/cm | 117 um |
| 150 mm/s | 31.4% | 2.51 g/cm3 | 129 mg/cm | 100 um |
| 200 mm/s | 22.8% | 1.83 g/cm3 | 94 mg/cm | 72 um |

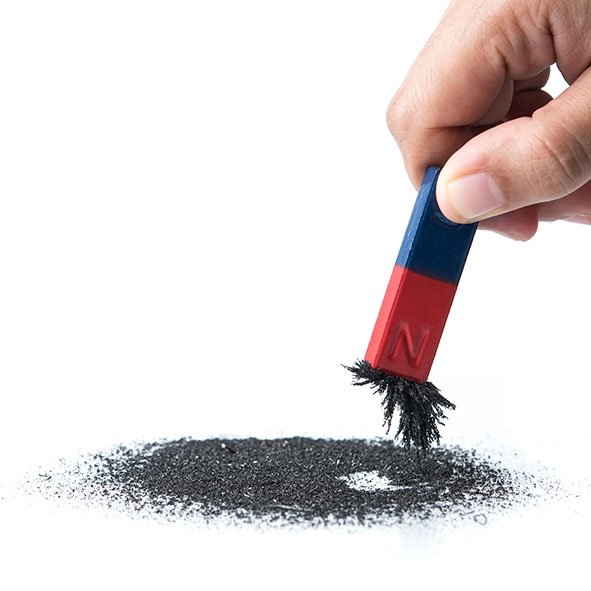
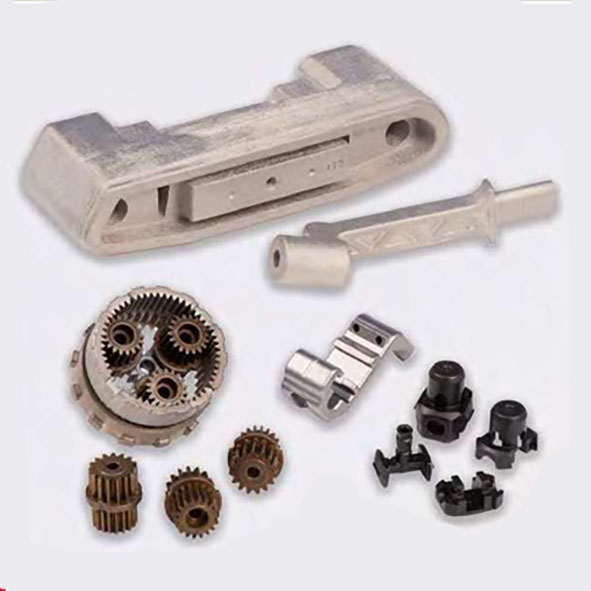
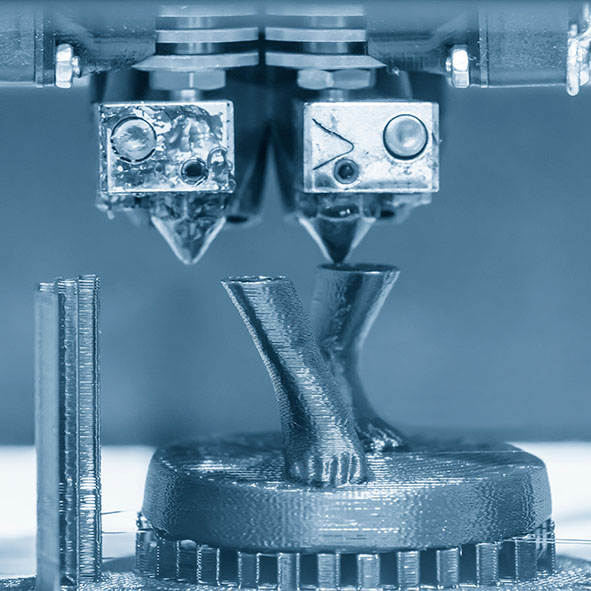
|
Spreading Rate
|
10-300 mm/sec |
|
Levelling Height
|
20-2000 um |
|
Build Plate
|
Solid or powder bed |
|
Sample Size
|
5-25 cm3 |
|
Temperature
|
Ambient to 250C |
|
Travel
|
Unlimited (typical 100 cm) |
|
Simultaneous layers
|
4 |
|
Analysis time
|
2 minutes typical |

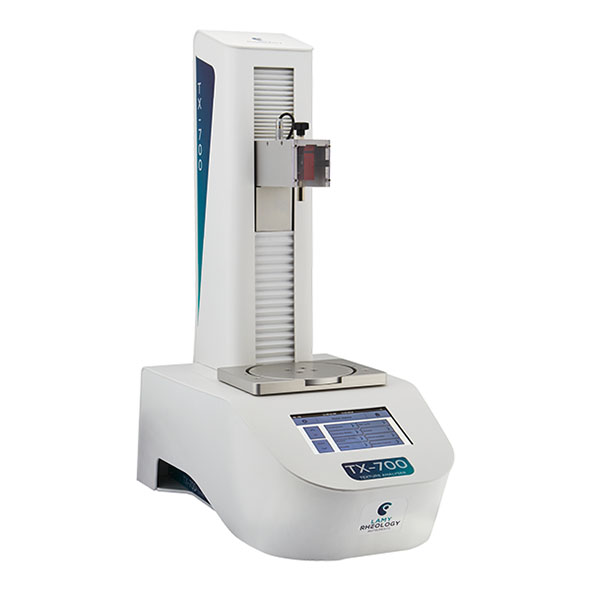
Lamy Rheology is the first French manufacturer of measuring instruments for laboratories, research and industry.
Lamy Rheology is a family-owned and run company that has become the French leader in the rheometer and viscometer market; in 2015, the company is celebrating its 60th birthday. Established by Jean Lamy in 1955, the firm was taken over by his daughter, Danielle Lamy in 1986, then by his grandchildren, Sophie and Eric Martino in 2006, whose takeover marks the completion of a process initiated in the early 90s: for nearly 15 years, LAMY RHEOLOGY has been manufacturing its entire range of products in this way.
Lamy Rheology Texture Analysers provide precise and reliable measurement of material texture, essential for quality control and product development. These advanced texture analysers are designed for diverse applications in industries such as food, cosmetics, pharmaceuticals, and polymers. The instruments evaluate properties like hardness, cohesiveness, adhesiveness, and elasticity, ensuring products meet desired standards. With user-friendly interfaces and automated data collection, Lamy Rheology Texture Analysers offer efficient and accurate texture analysis. Their high sensitivity and versatility make them ideal for research and industrial applications, providing comprehensive insights into material behaviour and performance under various conditions.
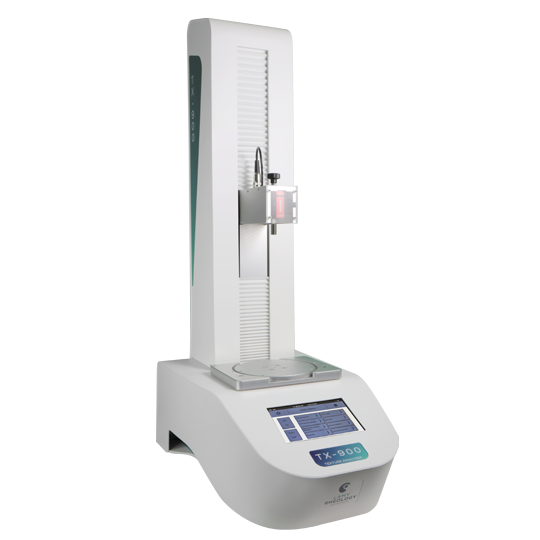




















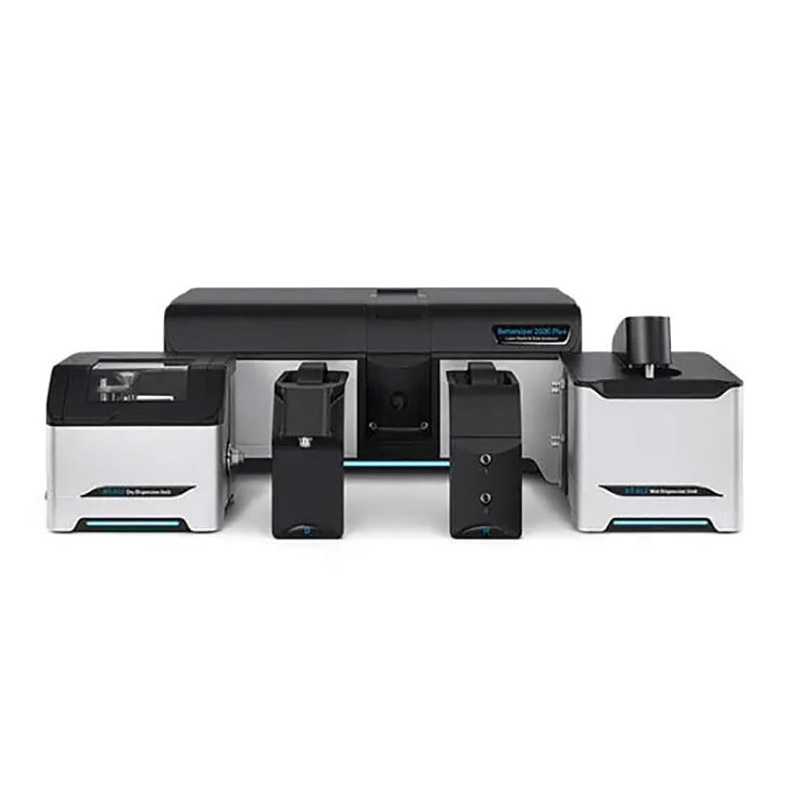
Bettersizer 2600 Plus combines laser diffraction and dual-camera dynamic imaging on one modular platform, delivering size and shape characterization across 0.02–3500 μm. Laser diffraction provides fast, repeatable particle size distributions using a 92-detector array and Mie/Fraunhofer models. Dynamic imaging captures high-speed particle images to quantify size and shape, with visual evidence for agglomerates, irregular particles, and oversized tails. With a modular design, Bettersizer 2600 Plus supports a broad selection of wet and dry dispersion units. This enables flexible setups for different sample types, volumes, and solvents, so one instrument can meet diverse applications and industries
|
Principle
|
Laser Diffraction technology, Dynamic Image Analysis |
|
Analysis
|
Mie scattering theory, Fraunhofer diffraction theory, Dynamic image analysis |
|
Data acquisition rate
|
11 kHz |
|
Typical measurement time
|
Less than 10 seconds |
|
Measurement range
|
0.02–2,600 μm (wet); 0.1 – 2,600 μm (dry); 2-3,500 μm (dynamic image) |
|
Acuracy
|
≤ 0.5% |
|
Repeatability
|
≤ 0.5% |
|
Number of size classes
|
100 (adjustable) |
|
Optical System
|
Laser Diffraction System |
|
Laser
|
10 mW, 635 nm |
|
Detector
|
92 detectors |
|
Measuring angle
|
0.016-165° |
|
Alignment
|
Automatic |
|
Optical System
|
Dynamic imaging system |
|
CMOS Camera
|
0.5x and 10x |
|
Measuring range
|
2-3,500 μm |
|
Frame rate
|
70 fps at 5 MP |
|
Laser
|
Class 1 (IEC60825-1 and 21CFR1040.10) |
|
Regulatory
|
RoHS, CE |
|
Standards
|
ISO 13320, ISO 13322-2, USP <429> |
|
Software
|
21 CFR Part 11 |
|
Supply voltage
|
100-240 VAC, 50/60 Hz |
|
Dimensions (LxWxH)
|
745 × 305 × 305 mm |
|
Weight
|
33 kg |
|
Computer interface
|
At least two high-speed USB 2.0 and two USB 3.0 port required |
|
Operating system
|
Windows 10 or higher |
|
Hardware specification (recommended)
|
Intel Core i5 Processor, 16 GB RAM, 512 GB SSD, 1920 × 1080 (Full HD) |
|
Wet dispersion introduces the sample into a selected liquid medium, such as water or a compatible organic solvent, to form a stable suspension. A controlled workflow, typically defined by automated SOPs, keeps dispersion conditions consistent.
Continuous circulation and stirring maintain homogeneity, integrated ultrasonic breaks agglomerates and helps release entrapped air, and the suspension passes through the optical measurement zone and is recirculated for repeatable analysis. Automated surfactant addition further improves wetting and suspension stability, reducing re-agglomeration and supporting reliable, operator-independent results.
|
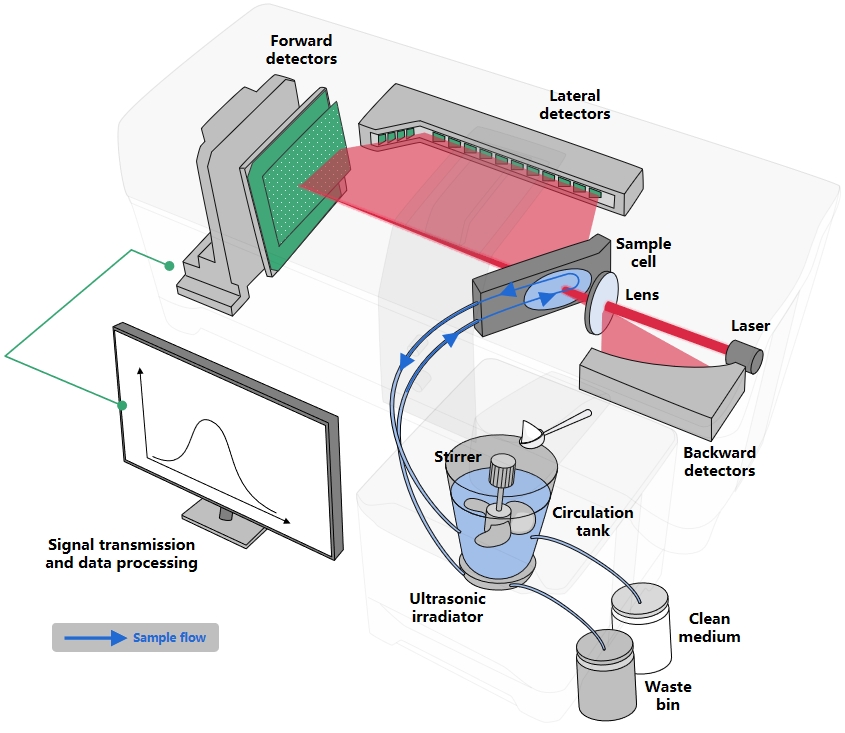 |
Core Functions Across Wet Dispersion Units
| Stirring and circulation: | Ultrasonic energy: | Surfactant addition: |
| maintain uniformity and reduce settling | deagglomerate particles and help remove trapped air | improve wetting and stabilize the suspension |
 |
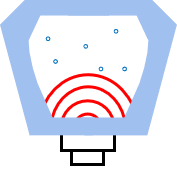 |
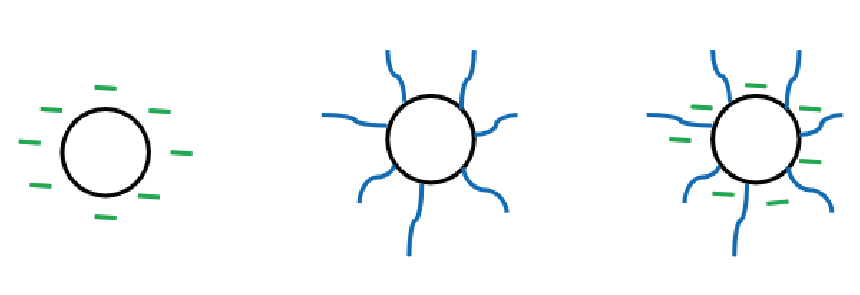 |
| BT-812 Automatic Wet Dispersion Unit |
Most routine samples can be dispersed in water, so water-based wet dispersion is the most common workflow. For these applications, BT-812 is the primary wet dispersion unit for Bettersizer 2600 Plus, combining controlled circulation, ultrasonics, and automated liquid handling to deliver repeatable measurements. | |
| • High-capacity circulation tank, maximum volume is 500 mL • Centrifugal circulation pump with adjustable speed • 50 W adjustable ultrasonic dispersion with dry-run protection • Fully automated liquid handling system, including level monitoring and automatic dispersant addition • Full software control for dispersion, measurement, and cleaning workflows |
||
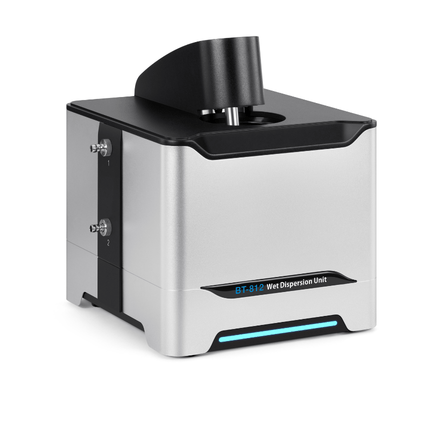 |
Parameter | Specification |
| Measurement range* | 0.02 – 2,600 μm | |
| Stirring speed | 300 – 2,500 rpm | |
| Ultrasonic power | 50 W max | |
| Volume | 500 mL max | |
| Medium | Water | |
| SOP | Yes | |
| Dimensions (LxWxH) | 257 x 275 x 308 mm (LxWxH) | |
| Weight | 11.5 kg | |
| Component | ABS housing 304 stainless steel tank Silicone tubing Centrifugal pump Peristaltic pump Ultrasonic disperser Quartz sample cell Pinch valve |
|
| * Sample and sample preparation dependent | ||
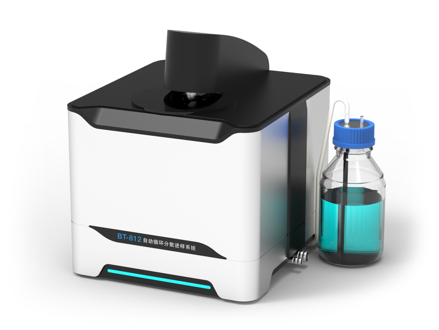 |
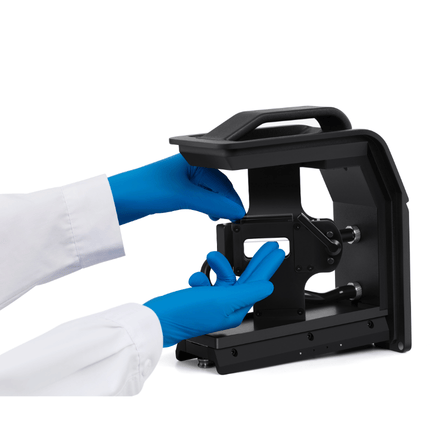 |
| Automatic Surfactant Addition | Easy-to-Remove Wet Sample Cell |
|
|
| BT-80N Pro Automatic Anti-Corrosive Wet Dispersion Unit |
BT-80N Pro is designed for wet dispersion workflows that require organic solvents or corrosive media.To meet these applications, key components are built with corrosion-resistant materials, improving long-term compatibility and reliability. | |
|
||
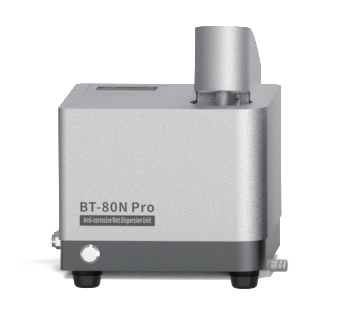 |
Parameter | Specification |
| Measurement range* | 0.02 – 2,600 μm | |
| Stirring speed | 300 – 2,500 rpm | |
| Ultrasonic power | 50 W max | |
| Volume | 80 – 200 mL | |
| Medium** | Water, organic solvent | |
| SOP | Yes | |
| Dimensions (LxWxH) | 240 × 220 × 290 mm (LxWxH) | |
| Weight | 9 kg | |
| Key Component | 316L Stainless-steel housing PTFE tubing 316 Stainless-steel diaphragm pump 316L Stainless-steel tank Quartz sample cell Ultrasonic disperser |
|
| * Sample and sample preparation dependent ** Compatibility depends on the wetted materials. Please contact Bettersize to confirm compatibility with your solvent. |
||
| BT-80N Anti-Corrosive Wet Dispersion Unit |
The BT-80N is a cost-effective, entry-level solution that provides essential solvent compatibility for routine measurements. | |
|
||
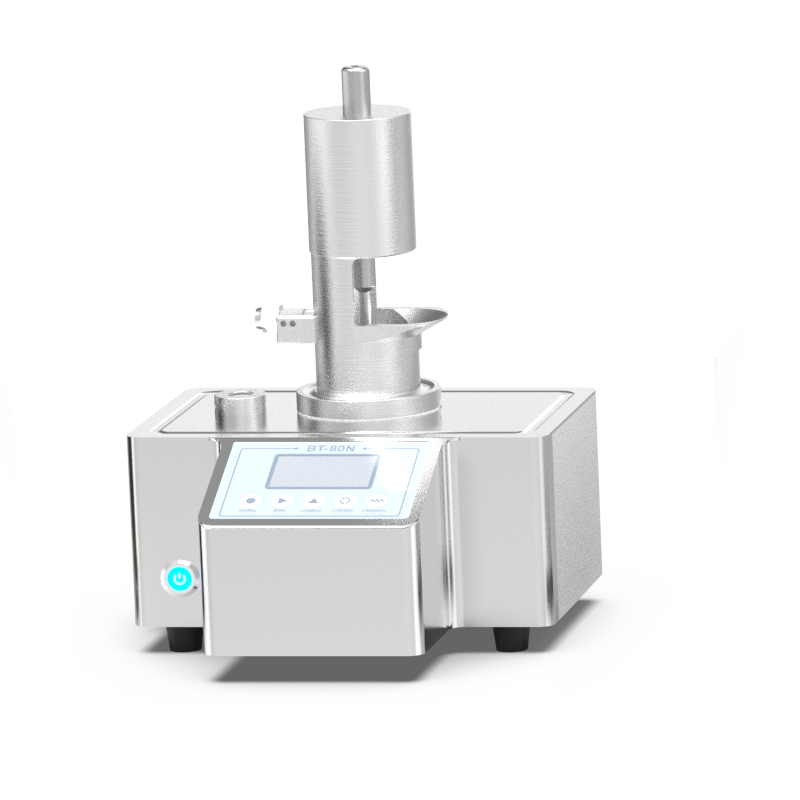 |
Parameter | Specification |
| Measurement range | 0.02 – 2,600 μm | |
| Stirring speed | 300 – 3,000 rpm | |
| Ultrasonic power | 50 W max | |
| Volume | 50 – 80 mL | |
| Medium | Water, organic solvent | |
| SOP | No | |
| Dimensions (LxWxH) | 290 × 210 × 375 mm (LxWxH) | |
| Weight | 11 kg | |
| Key Component | 316L Stainless-steel housing PTFE tubing 316L Stainless-steel tank Quartz sample cell Ultrasonic disperser |
|
| BT-814 Small-Volume Wet Dispersion Unit |
The BT-814 is specifically designed for measurements where sample availability is limited or material value is high. It supports dispersion in both water-based and organic solvents, providing maximum flexibility across a wide range of applications. | |
|
||
 |
Parameter | Specification |
| Measurement range* | 0.02 – 2,600 μm | |
| Volume | 8 mL | |
| Medium | Water or organic solvent | |
| SOP | No | |
| Dimensions | / | |
| Weight | / | |
| Key component | ABS housing Quartz sample cell 316L Stainless-steel stirrer |
|
| * Sample and sample preparation dependent | ||
Dry Dispersion Units
Controlled Deagglomeration for Repeatable Results
|
Dry dispersion introduces powder samples into the system with gases as media. The sample is delivered into the disperser by controlled vibration.
Inside the disperser, particles are accelerated by a precisely controlled high-pressure gas stream through a Venturi device. Shear forces, interparticle collisions, and particle–wall collisions break down agglomerates before measurement.
The dispersed particle stream then passes through the laser diffraction measurement zone for analysis, and is safely evacuated and collected by a vacuum unit. |
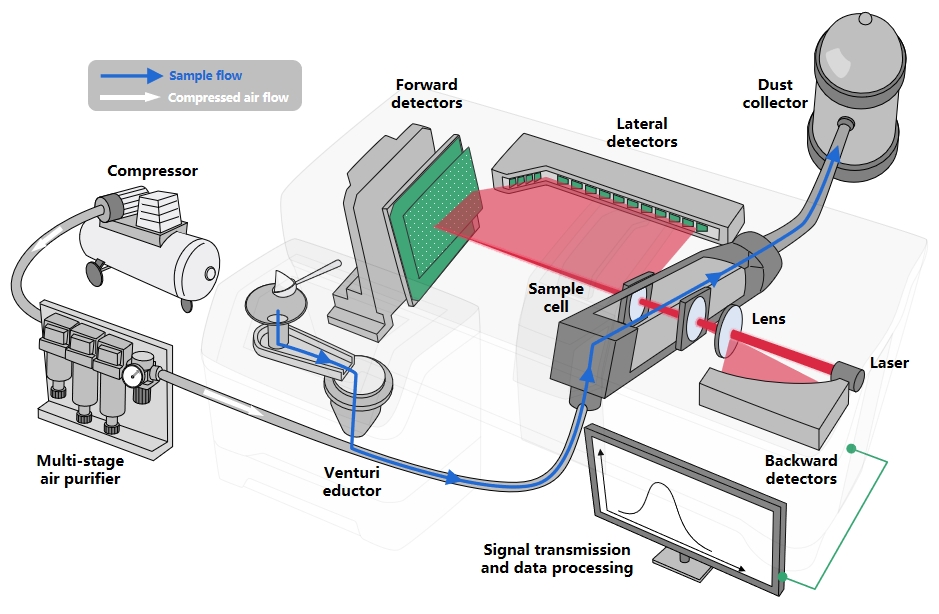 |
|
|
Shear forces |
 |
|
|
Inter-particle collisions: |
 |
|
|
Particle–wall impacts: |
 |
|
| BT-912 Automatic Dry Dispersion Unit |
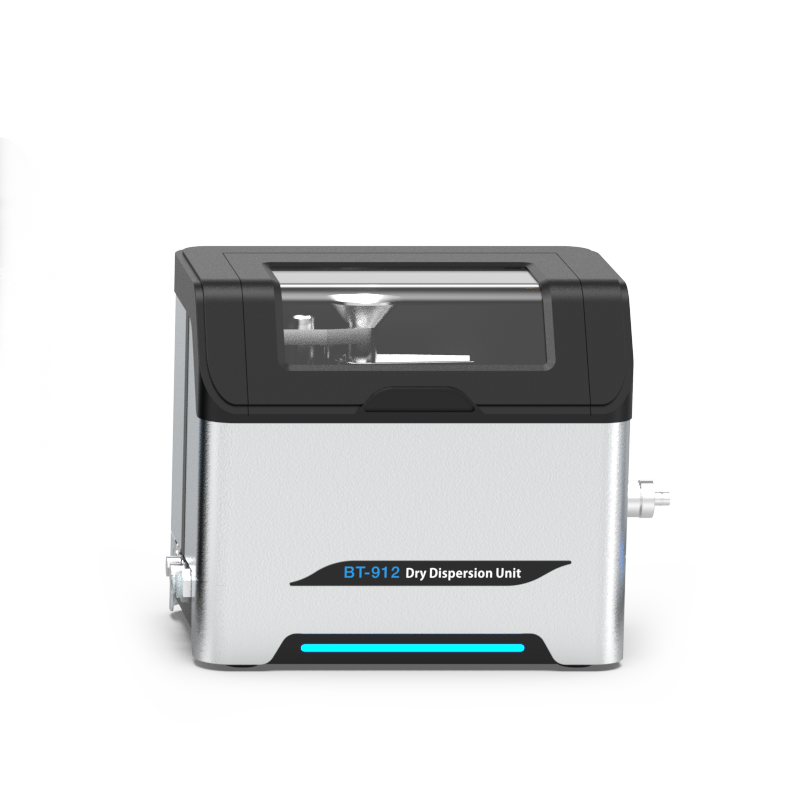 |
||
| The BT-912 is the primary dry dispersion unit for routine powder dispersion using compressed gas. It supports a wide range of powders, including friable and cohesive powders. | Parameter | Specification | |
| Measurement range* | 0.1 – 2,600 μm | ||
| Powder mass | 0.2 – 10 g | ||
| Gas pressure | 0.1 – 0.8 MPa | ||
|
Funnel height | 0.7 – 2.9 mm | |
| Medium | Air, nitrogen or noble gases | ||
| SOP | Yes | ||
| Dimensions | 276 x 189 x 243 mm | ||
| Weight | 8 kg | ||
| Key Component | 304 Stainless-steel funnel 304 stainless-steel feeder Venturi disperser Vacuum cleaner (optional) Air Compressor (optional) |
||
| * Sample and sample preparation dependent | |||
| BT-903 Small-Volume Dry Dispersion Unit |
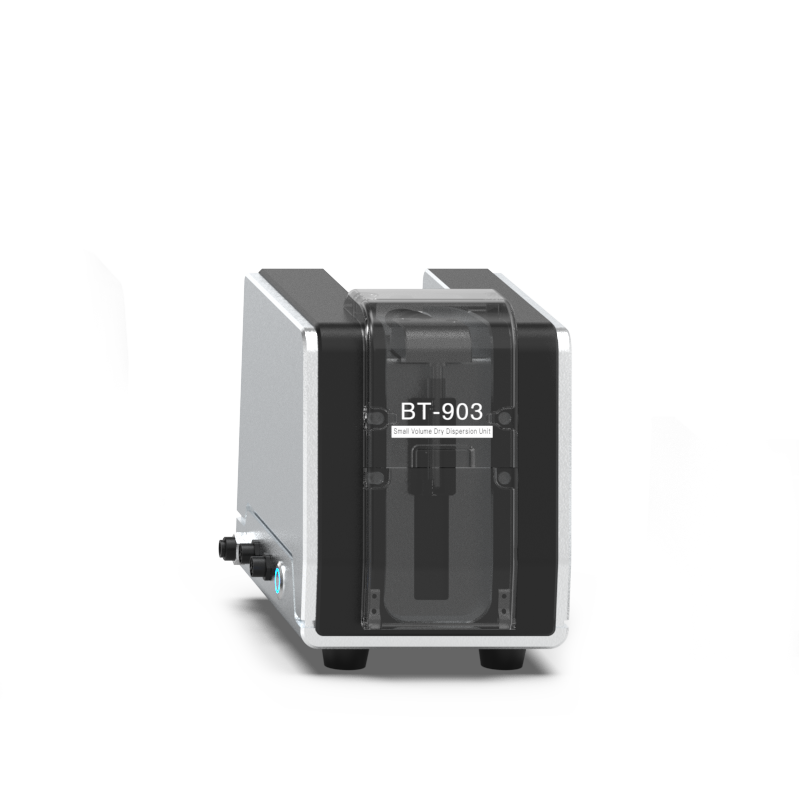 |
||
| BT-903 is the small-volume dry dispersion unit, designed for powder measurements when sample amount is limited. Samples are preloaded in a tube and introduced into the disperser by controlled gas flow and negative-pressure suction, enabling stable and repeatable sampling. | Parameter | Specification | |
| Measurement range* | 0.1 – 2,600 μm | ||
| Powder mass | 0.02 – 1 g | ||
|
Tube volume | 5 mL max | |
| Gas pressure | 0.1 – 0.8 MPa | ||
| Medium | Air, nitrogen or noble gases | ||
| SOP | Yes | ||
| Dimensions | 195 × 260 × 245 mm | ||
| Weight | 5 kg | ||
| Key Component | Plastic sample tube 316 Stainless-steel tubing Silicon tubing Venturi disperser Vacuum cleaner (optional) * Sample and sample preparation dependent Air Compressor (optional) |
||
The Bettersizer 2600 Plus features both wet and dry dispersion units for effective particle dispersion, along with a dynamic imaging module to expand the measurement range and perform particle shape analysis. Our decision tree* for module selection helps users choose the right dispersion unit and determine if the dynamic imaging module is necessary.
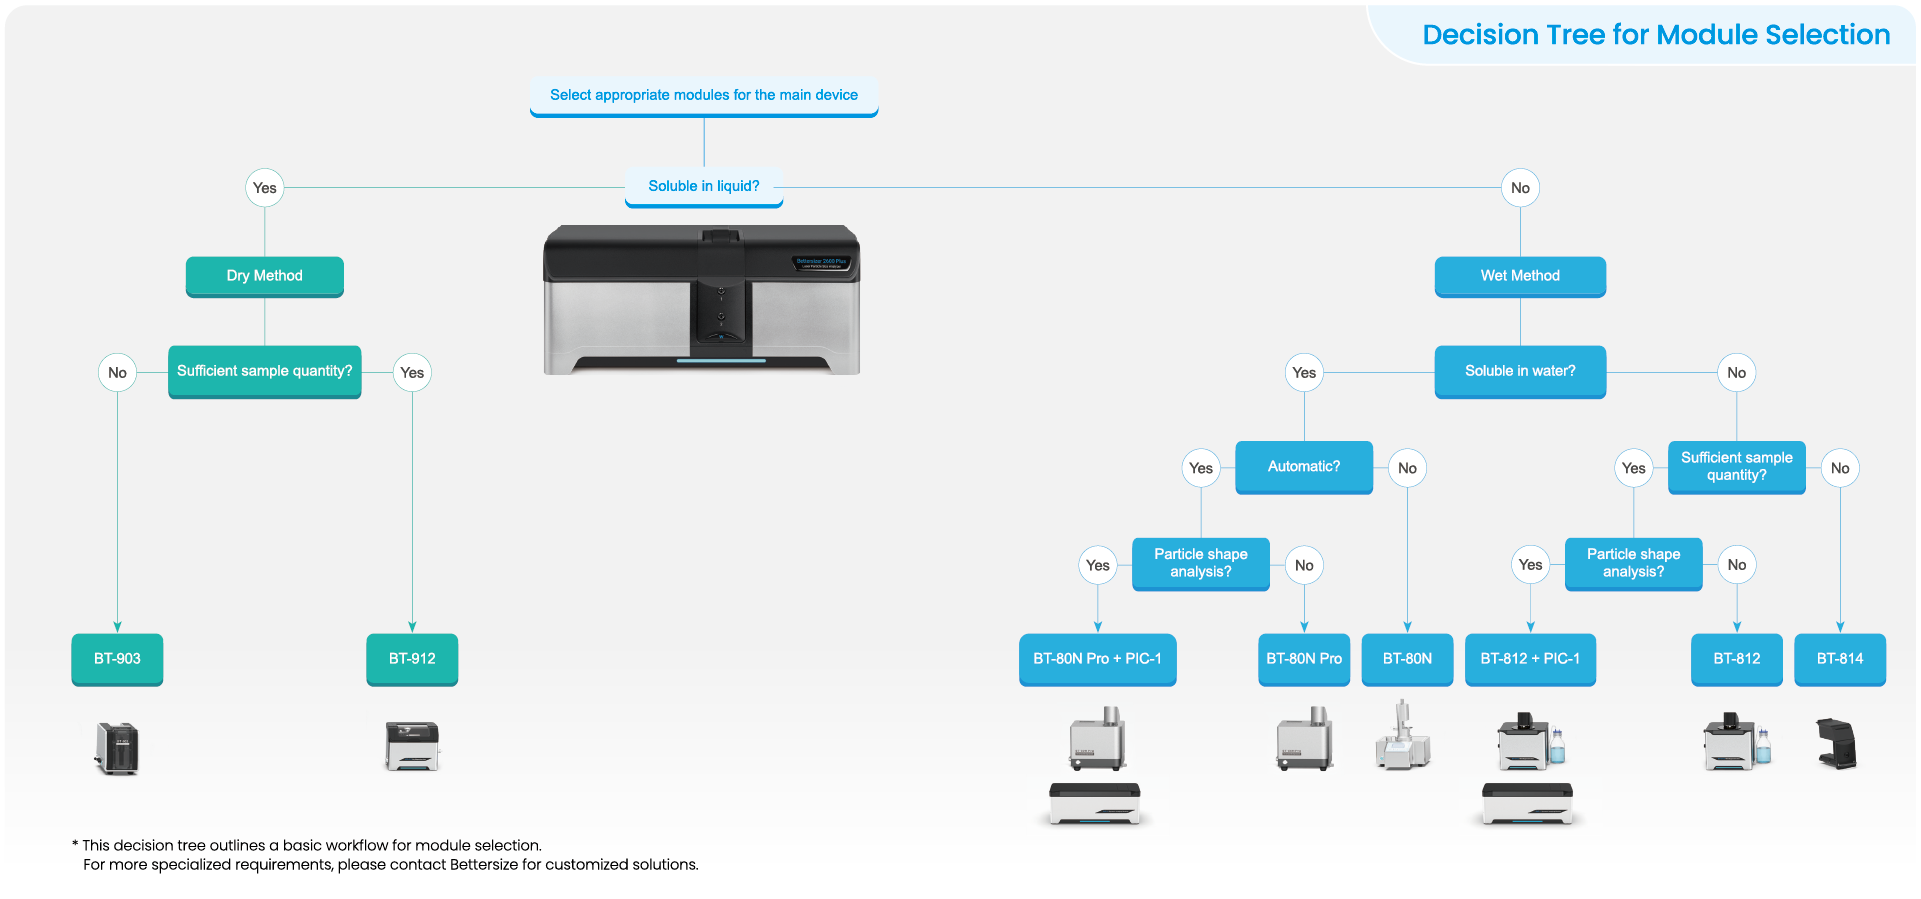






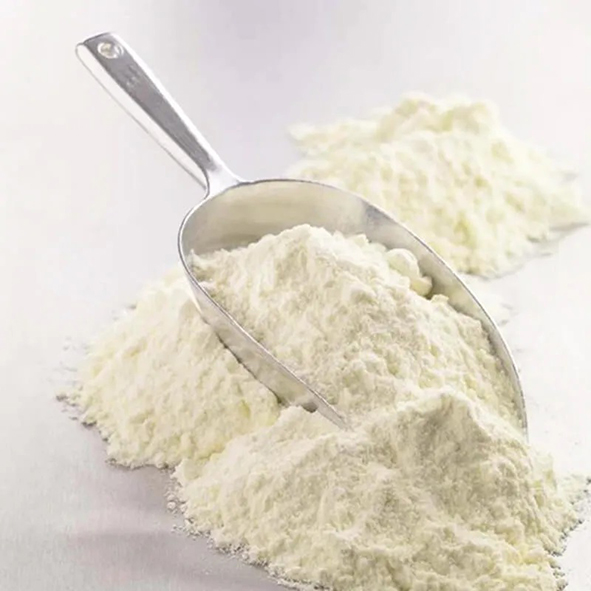

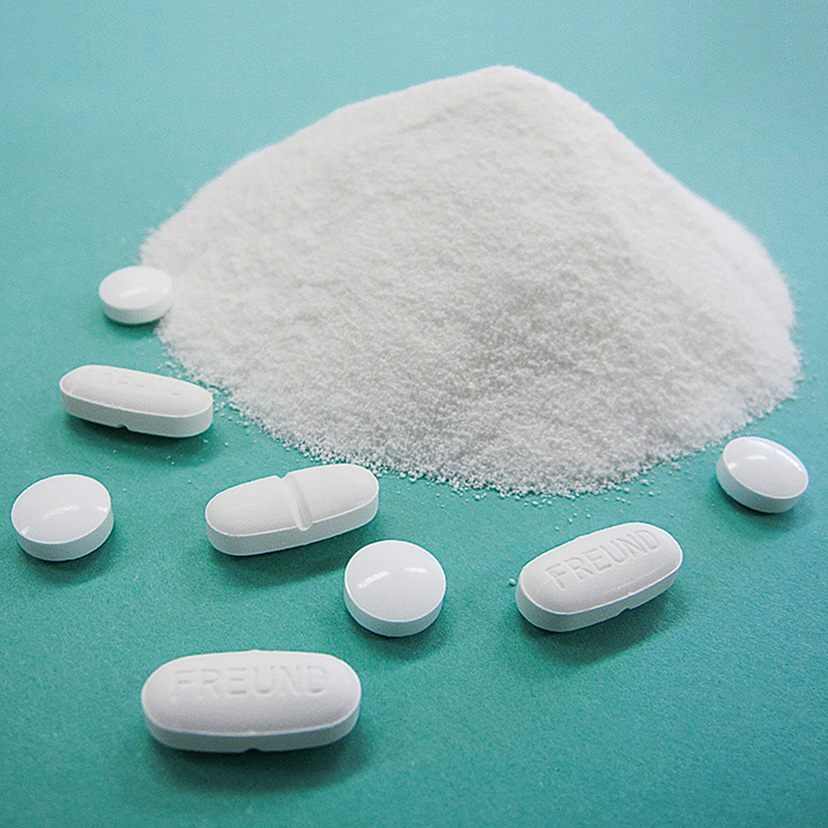


Bettersizer Software is designed to optimize the entire particle size measurement workflow, covering every stage from sample preparation and measurement control to data analysis and report generation. Seamlessly integrated with the Bettersizer 2600 Plus, it streamlines routine operations through a high level of automation, reducing manual intervention while improving efficiency and result consistency.
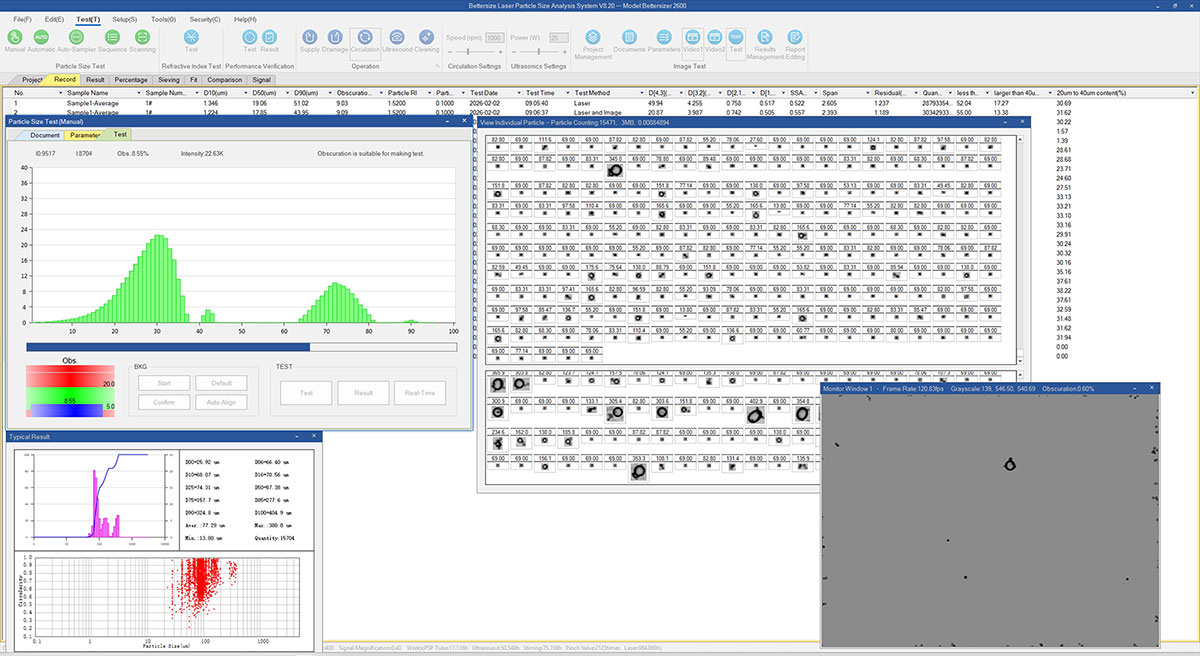
| Smart Dispersion Control | SOP-Based Automation | Flexible Measurement Modes |
|
“Auto Dispersion Setting” automatically determines the optimal dispersion time based on real-time repeatability. It stops when the user-defined repeatability target is met, or selects the best-repeatability interval at the maximum time. |
SOPs standardize the full workflow beyond basic stirring, ultrasonics, and circulation. Automated functions can include auto dilution to maintain target obscuration, automatic dispersant addition, and report generation/printing, improving consistency across operators and laboratories. |
Users can select laser diffraction, dynamic imaging, or combined LD and imaging modes to match sample characteristics and reporting needs, enabling both particle size and shape characterization within a unified workflow. |
Software Features Across the Testing Workflow
| 1. Automatic Pre-processing | 2. Automated System Preparation | 3. Real-time Testing | 4. Data Evaluation and Reporting |
|
Users can easily create new tests based on laser diffraction and dynamic image analysis methods. The software supports both automated and manual control, providing flexibility for various sample types and testing conditions. The SOP offers a streamlined solution for standardized and automatic testing, ensuring operator-independent results that are consistent and reliable. |
The Bettersizer software significantly enhances data quality by automating critical instrument functions like system cleaning, optical alignment, and sample dispersion. These automated processes ensure optimal instrument performance, leading to increased precision, accuracy, and reproducibility of results. | During the testing process, Bettersizer software delivers real-time insights into particle size distribution and shape. These immediate results provide valuable information on test progress and outcomes, enabling precise adjustments to achieve optimal results. | The Bettersizer software excels in delivering comprehensive data analysis and report generation capabilities. The software allows users to customize and edit reports to meet specific requirements, including various data points, charts, and graphical representations, to create clear and informative reports. The data evaluation tools can help in assessing the result quality. |
Combined Test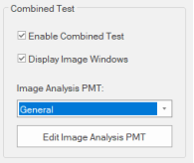 |
Automatic Dispersion Settings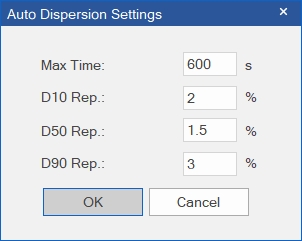 |
Imaging Analysis Window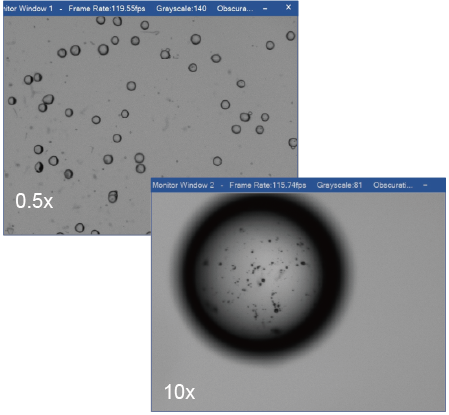 |
Data Interface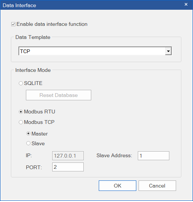 |
New SOP Screen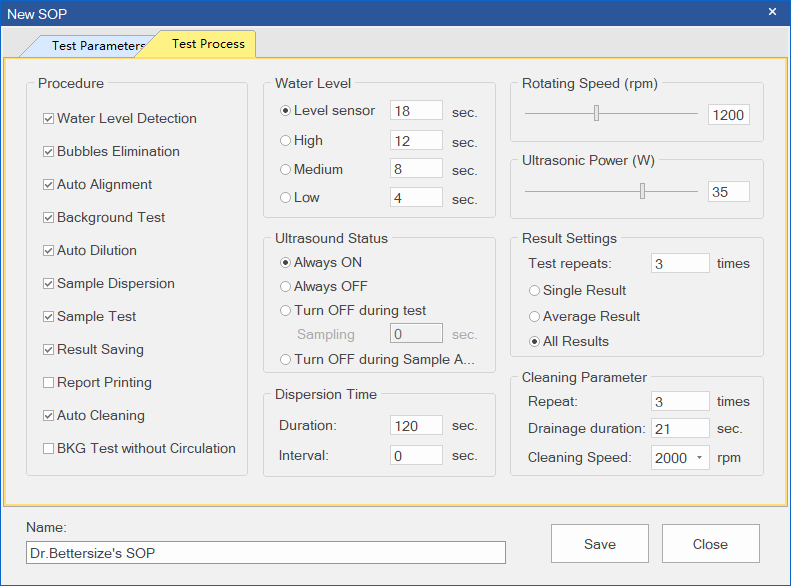 |
Auto-alignment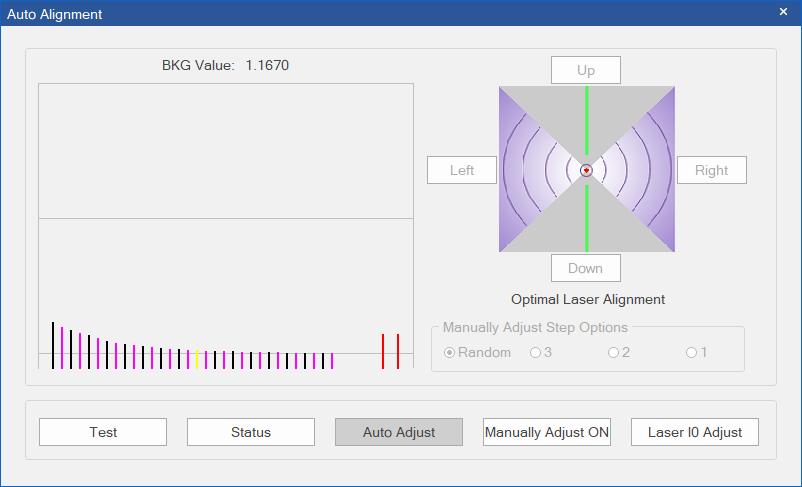 |
Laser Diffraction Analysis Window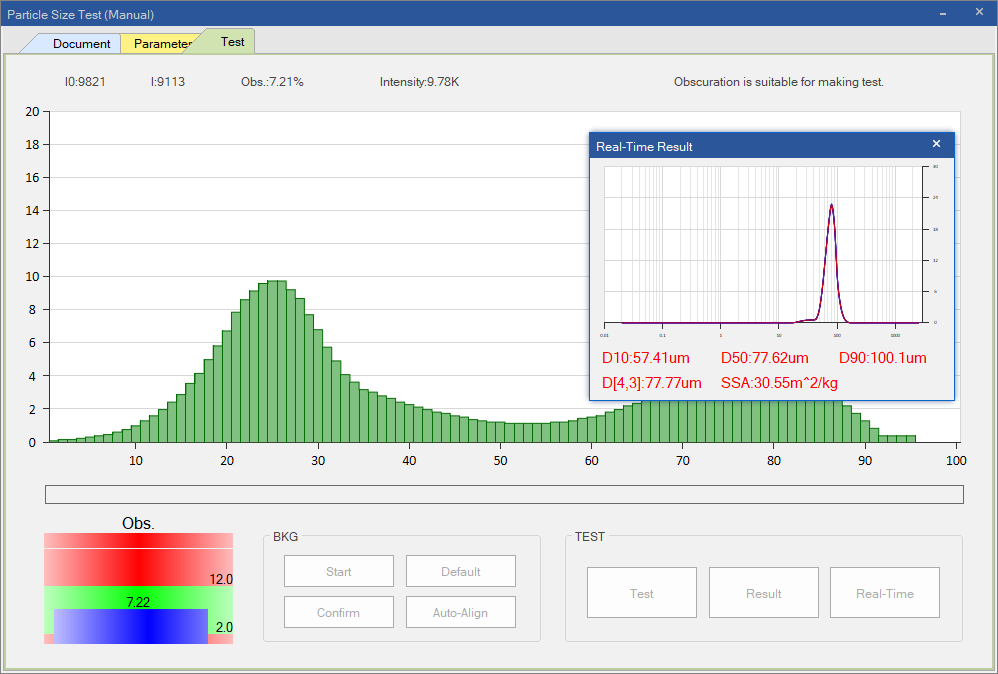 |
Data Evaluation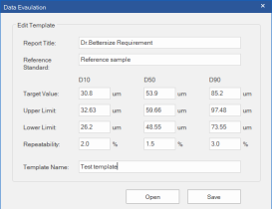 |
Reporting and Data Export
Highly Customizable Report
● Complete and detailed data: Frequency and cumulative distribution curves, simplified and complete distribution table, etc.
● Editability: Users can easily edit the reports and change the font, layout, format, etc.
● Convertibility: Users can switch the formats of reports freely among PDF, Excel, Text, etc.
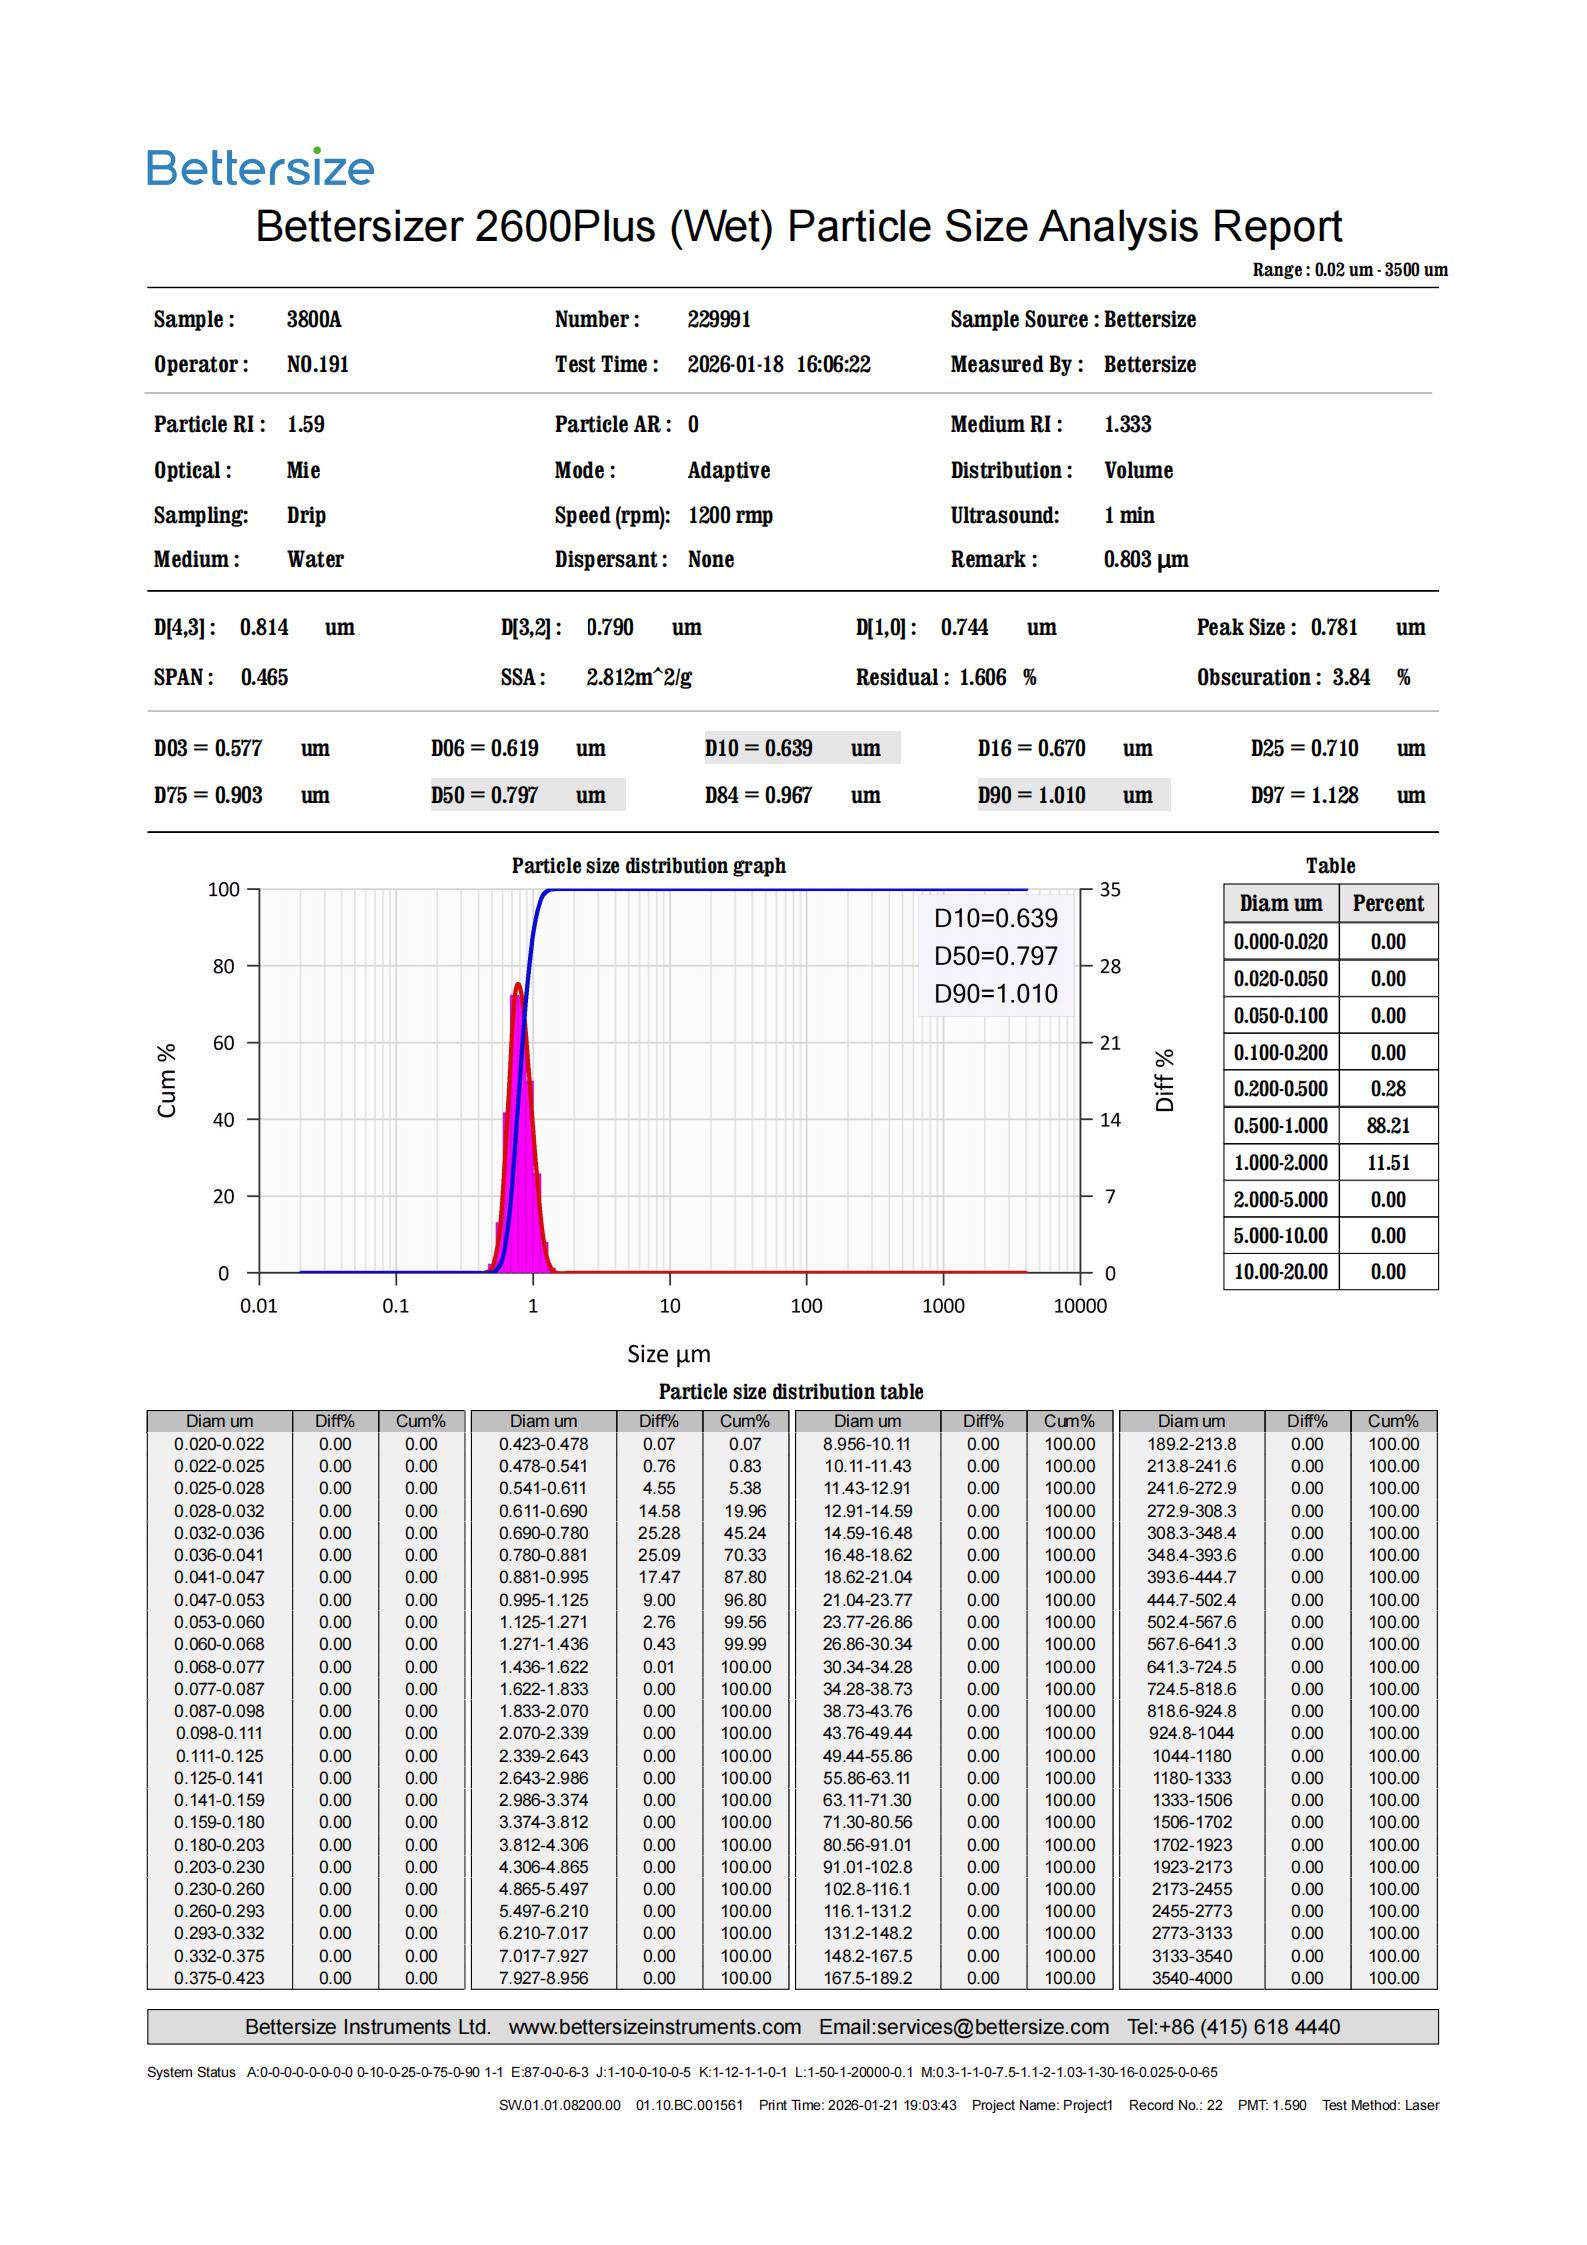

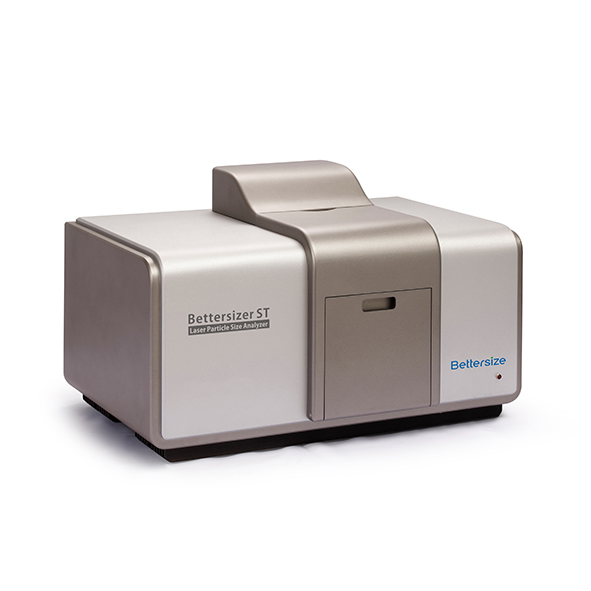
The Bettersizer ST is a fully automated and integrated particle size analyser with a smart operation system by wet dispersing. Optimised for the industrial quality control process, the Bettersizer ST provides stable and reliable testing results with minimum user intervention. The compact footprint saves valuable workspace for factories and laboratories.
The Bettersize Bettersizer ST Particle Size Analyser ensures reliable wet analysis for quality control processes. Utilising laser diffraction, it provides accurate and reproducible measurements. Ideal for various industries, the Bettersizer ST guarantees precise particle size distribution, enhancing product consistency and quality assurance
|
Particle Size Distribution
|
Suspensions, emulsions, dry powders |
|
LPrinciple
|
Laser diffraction technology |
|
Analysis
|
Mie scattering theory and Fraunhofer diffraction theory |
|
Typical measurement time
|
Less than 10 seconds |
|
Measurement range
|
0.1 µm – 1000 µm |
|
Accuracy error
|
≤1% (NIST certified standards) |
|
Repeatability error
|
≤1% (NIST certified standards) |
|
Number of size classes
|
≤100 (adjustable) |
|
FOptical system
|
Patented DLOS (Dual Lens Optical Systems) |
|
Laser
|
High-power fiber semiconductor laser (10 mW/635 nm) |
|
Detector
|
86 photodetectors (forward, lateral and backward arrangements)F |
|
Measuring angle
|
0.031 – 159° |
|
Circulation speed
|
300 – 2500 r/min |
|
Circulation flow rate
|
3,000 – 8,000 mL/min |
|
Ultrasonication
|
Dry run protection, Max 50 W (adjustable) |
|
Circulation tank capacity
|
600 mL |
|
Conformity
|
21 CFR Part 11, ISO 13320, CE |
|
Reports
|
Customizable reporting |
|
Dimensions (L x W x H)
|
660 x 420 x 320 mm |
|
Weight
|
38 KG |
|
Voltage
|
DC 24V, 221 W |
|
Computer interface
|
At least one high-speed USB 2.0 or USB 3.0 port required |
|
Operating system
|
Windows 7 or higher |
|
Hardware specification
|
Intel Core I5, 4GB RAM, 250GB HD |



The BeDensi T Pro series is a reliable tapped density analyser that excels at intuitive operation while complying with the USP, EP, ASTM, and ISO standards. It can measure the bulk density and tapped density with less than 1% repeatability variation to help users to understand the flowability of a wide variety of powder materials.
Meeting the USP, EP, ASTM and ISO standards to provide informative results.
The single tapped density analyser with up to 3 workstations to meet different measurement needs and scale up your productivity even further.
Own a reliable tapped density tester at an affordable price.
Powder characterization includes flow measurements, morphology, particle size distribution, density, and chemical composition. Bettersize PowderPro Series instruments are mainly used for the analysis of the powder physical properties by testing items such as angle of repose and fall, angle of spatula (flat plate angle), bulk and tapped density, dispersibility, voidage and cohesion, angle of difference, compressibility, uniformity, flowability Index, floodability index, sieve size, angle of slide, etc.
Bulk density: fill the powder sample into a measuring cup, and flatten the top, the ratio of the powder mass to the volume of the cup is defined as bulk density. It indicates the mass of the powder that can be added into the vessel per volume under normal conditions.
Tapped density: fill the powder sample into a measuring cup; vibrate the cup at a certain amplitude and frequency to remove air from the powders. After reaching the required vibration time, flatten the sample. The ratio of the powder mass to the volume of the cup is defined as tapped density. Tapped density indicates the mass of powders filled into the vessel per volume after excluding air from the powders. The data of bulk density and tapped density are often used for the design of vessels, bags, and tanks for powder storage.
Compressibility: it is the ratio of the difference between tapped density and bulk density to tap density. It shows the degree of volume reduction from bulk to tap state.
Flowability Index: is a set of numerical values obtained by the weighted summation of angle of repose, Compressibility, angle of spatula, uniformity, and cohesion. It is used to comprehensively evaluate the flowability of the powder. The Flowability Index is mainly used to describe powder flowability under gravity.
Angle of repose: Under the static balance, the angle between the slope of a powder pile and the horizontal plane is angle of repose. It is measured when the powders fall to a surface via gravity and form a cone. It indicates the flowability of the powders. The smaller the angle of repose is, the better the flowability of the powders.
Angle of fall: After measuring the angle of repose, apply an external force to the powder pile to collapse it. The angle between the slope of the collapsed pile and the horizontal plane is defined as angle of fall.
Angle of difference: It means the difference between the angle of repose and the angle of collapse. The larger the angle of difference is, the better flowability of the powders.
Flat plate angle: immerse a plane in the powder pile; pull up the plane vertically, and one angle is formed between the slope of the powders on the plane and the plane. Apply an external force to obtain another angle. The average of these two angles is flat plate angle. The smaller the flat plate angle is, the better the flowability of the powders. The flat plate angle is usually larger than the angle of repose.
According to ISO4490, the flowability of metal powders is usually measured with a Hall flow meter.
The measurement process is:
The standard funnel of the Hall flowmeter needs to be calibrated by a standard sample with a flow speed of 40 + 0.5s/50g.
| BeDensi T Pro Series |
||
| Test Workstation | Up to 3 | |
| Compliance | USP<616> | |
| EP 2.9.34 | ||
| ASTM D7481 | ||
| ASTM B527 | ||
| ISO 787-11 | ||
| User defined | ||
| Taps | 1 to 99999 | |
| 100 to 300 taps/min (adjustable) | ||
| Drop Height | 3 ± 0.2 mm | For nominally 250 + 15 taps/min |
| 14 ± 2 mm | For nominally 300 + 15 taps/min | |
| Graduated Cylinder | 25 ml | Readable to 0.2 ml |
| 100 ml | Readable to 1 ml | |
| 250 ml | Readable to 2 ml | |
| Repeatability | ≤1% | |
| Power | 100-240VAC/50-60 Hz/ 50 W | |
| Dimensions | Width | 260 mm |
| Depth | 410 mm | |
| Height | 245 mm | |
| Weight | T1 | 16 kg |
| T2 | 18.2 kg | |
| T3 | 21 kg | |

The BeNano Series is the latest generation of nanoparticle size and zeta potential analysers designed by Bettersize Instruments. Dynamic light scattering (DLS), electrophoretic light scattering (ELS), and static light scattering (SLS) are integrated into the system to provide accurate measurements of particle size, zeta potential, and molecular weight. The BeNano Series is widely applied in academic and manufacturing processes of various fields including but not limited to: chemical engineering, pharmaceuticals, food and beverage, inks and pigments, and life science, etc.
The BeNano series comprises seven models and represents a state-of-the-art generation of nanoparticle analysers that integrate light scattering and transmission techniques.
| Features | BeNano 180 Zeta Max | BeNano 180 Zeta Pro |
BeNano 180 Zeta |
BeNano 90 Zeta |
BeNano Zeta |
BeNano 180 |
BeNano 90 |
| Particle Size – 90° DLS | √ | √ | × | √ | × | × | √ |
| Particle Size – 173° DLS | √ | √ | √ | × | × | √ | × |
| Zeta Potential | √ | √ | √ | √ | √ | × | × |
| Molecular Weight | √ | √ | √ | √ | × | √ | √ |
| Microrheology | √ | √ | √ | √ | × | √ | √ |
| Refractive Index | √ | × | √★ | √★ | × | √★ | √★ |
| Concentration | √ | × | √★ | √★ | × | √★ | √★ |
| Sedimentation | √ | × | √★ | √★ | × | √★ | √★ |
| Transmittance | √ | × | √★ | √★ | × | √★ | √★ |
| Temperature Trend | √ | √ | √ | √ | √ | √ | √ |
| VV Polarizer | √★ | √★ | √★ | √★ | × | √★ | √★ |
| VH Polarizer | √★ | √★ | × | √★ | × | × | √★ |
| Fluorescence Filter | √★ | √★ | √★ | √★ | × | √★ | √★ |
| Flow Mode | √★ | √★ | √★ | √★ | × | √★ | √★ |
| Autotitration | √★ | √★ | √★ | √★ | √★ | × | × |
| ★ Optional |
|||||||
If you’re not sure which model is right for you, feel free to contact us here.
Dynamic Light Scattering (DLS), also known as Photon Correlation Spectroscopy (PCS) or Quasi-Elastic Light Scattering (QELS), is a technique used to determine particle size by analysing the Brownian motion of particles in a dispersion. DLS is based on the principle of Brownian motion, which relates particle size to velocity—smaller particles diffuse more rapidly, while larger particles move more slowly. The scattering intensities of the particles are detected by an avalanche photodiode (APD) and then converted into a correlation function. From this correlation function, a mathematical algorithm can be applied to obtain the diffusion coefficient (D). The hydrodynamic diameter (DH) and its distribution can be calculated using the Stokes-Einstein equation, which relates the diffusion coefficient to the particle size.
Using backscattering optics, the analyser automatically identifies the best detection position by evaluating the sample’s size, concentration, and scattering characteristics. This ensures maximum measurement accuracy while offering the adaptability needed to evaluate a wide range of samples with varying properties.
Features
In aqueous systems, charged particles are surrounded by counter-ions that form an inner Stern layer and an outer shear layer. Zeta potential is the electrical potential at the interface of the shear layer. A higher zeta potential indicates greater stability and less aggregation of the suspension system. Electrophoretic light scattering (ELS) measures electrophoretic mobility via Doppler shifts of scattered light, which can be used to determine the zeta potential of a sample by Henry’s equation.
Colloidal Stability
| Stable particle system | Unstable particle system |
|
|
PALS is a more advanced technique than traditional ELS, which has been further developed by Bettersize to measure the zeta potential.
Features and Benefits
Static light scattering (SLS) is a technique that measures scattering intensities to calculate the weight-average molecular weight (Mw) and the second virial coefficient (A2) of a sample using the Rayleigh equation.
where c is the sample concentration, θ is the detection angle, Rθ is the Rayleigh ratio used to characterise the intensity ratio between the scattered light and the incident light at the angle of θ, Mw is the sample’s weight-average molecular weight, A2 is the second virial coefficient, and K is a constant related to (dn/dc)2.
|
Features & Benefits
|
Debye Plot |
Dynamic Light Scattering Microrheology (DLS Microrheology) is an economical and efficient technique that utilizes dynamic light scattering to determine rheological properties. By analyzing the Brownian motion of colloidal tracer particles, information about the viscoelastic properties of the system, such as viscoelastic modulus, complex viscosity and creep compliance, can be obtained with the generalized Stokes-Einstein equation.
Features & Benefits
DLS flow mode provides a high-resolution size result of a complex, polydisperse system. When combined with front-end separation equipment such as GPC/SEC or FFF, particles are separated into monodisperse fractions and flow through the BeNano in sequence by size. The size of each fraction is continuously measured and summed into a high-resolution size distribution.
BeNano can acquire RI or UV signals, offering a more accurate volume and number distributions independent of the algorithm compared to a batch-mode measurement.
Features & Benefits
Features & Benefits
Features & Benefits
The BeNano Series can determine the refractive index (RI) measurement of liquids with outstanding precision. A patented wedge-shaped cuvette holds the liquid sample while the CMOS detector measures the deflection of the light path after it traverses the liquid to calculate the RI.
Features & Benefits
The BeNano measures particle volume fraction and number concentrations in particles per milliliter (particles/mL) for each population through the patented LEDLS technique. The incident light passes through the sample and reaches a photodiode detector, which records the transmitted intensity. By comparing it with that of a blank solution and combining the data with the particle size distribution from dynamic light scattering, the particle concentration is determined.
Features & Benefits
The BeNano Series provides particle size results based on the sedimentation method. The sedimentation rate of particles is directly related to their size, with larger particles settling faster. The PD detector monitors the changes in transmitted intensity over time, enabling the determination of particle size and distribution for particles up to 50 microns.
Schematic of the sedimentation method
Features & Benefits
The BAT-1 + Degasser units integrate seamlessly with the BeNano Series for automatic acid-base titration and isoelectric point (IEP) determination. The system automatically enables sample flow during measurement, ensuring high efficiency and consistent, operator-independent results, as well as precise titration.
An optional degasser is available to remove dissolved gases from titrants. Preventing bubbles improves the accuracy of zeta potential measurements.
Features & Benefits
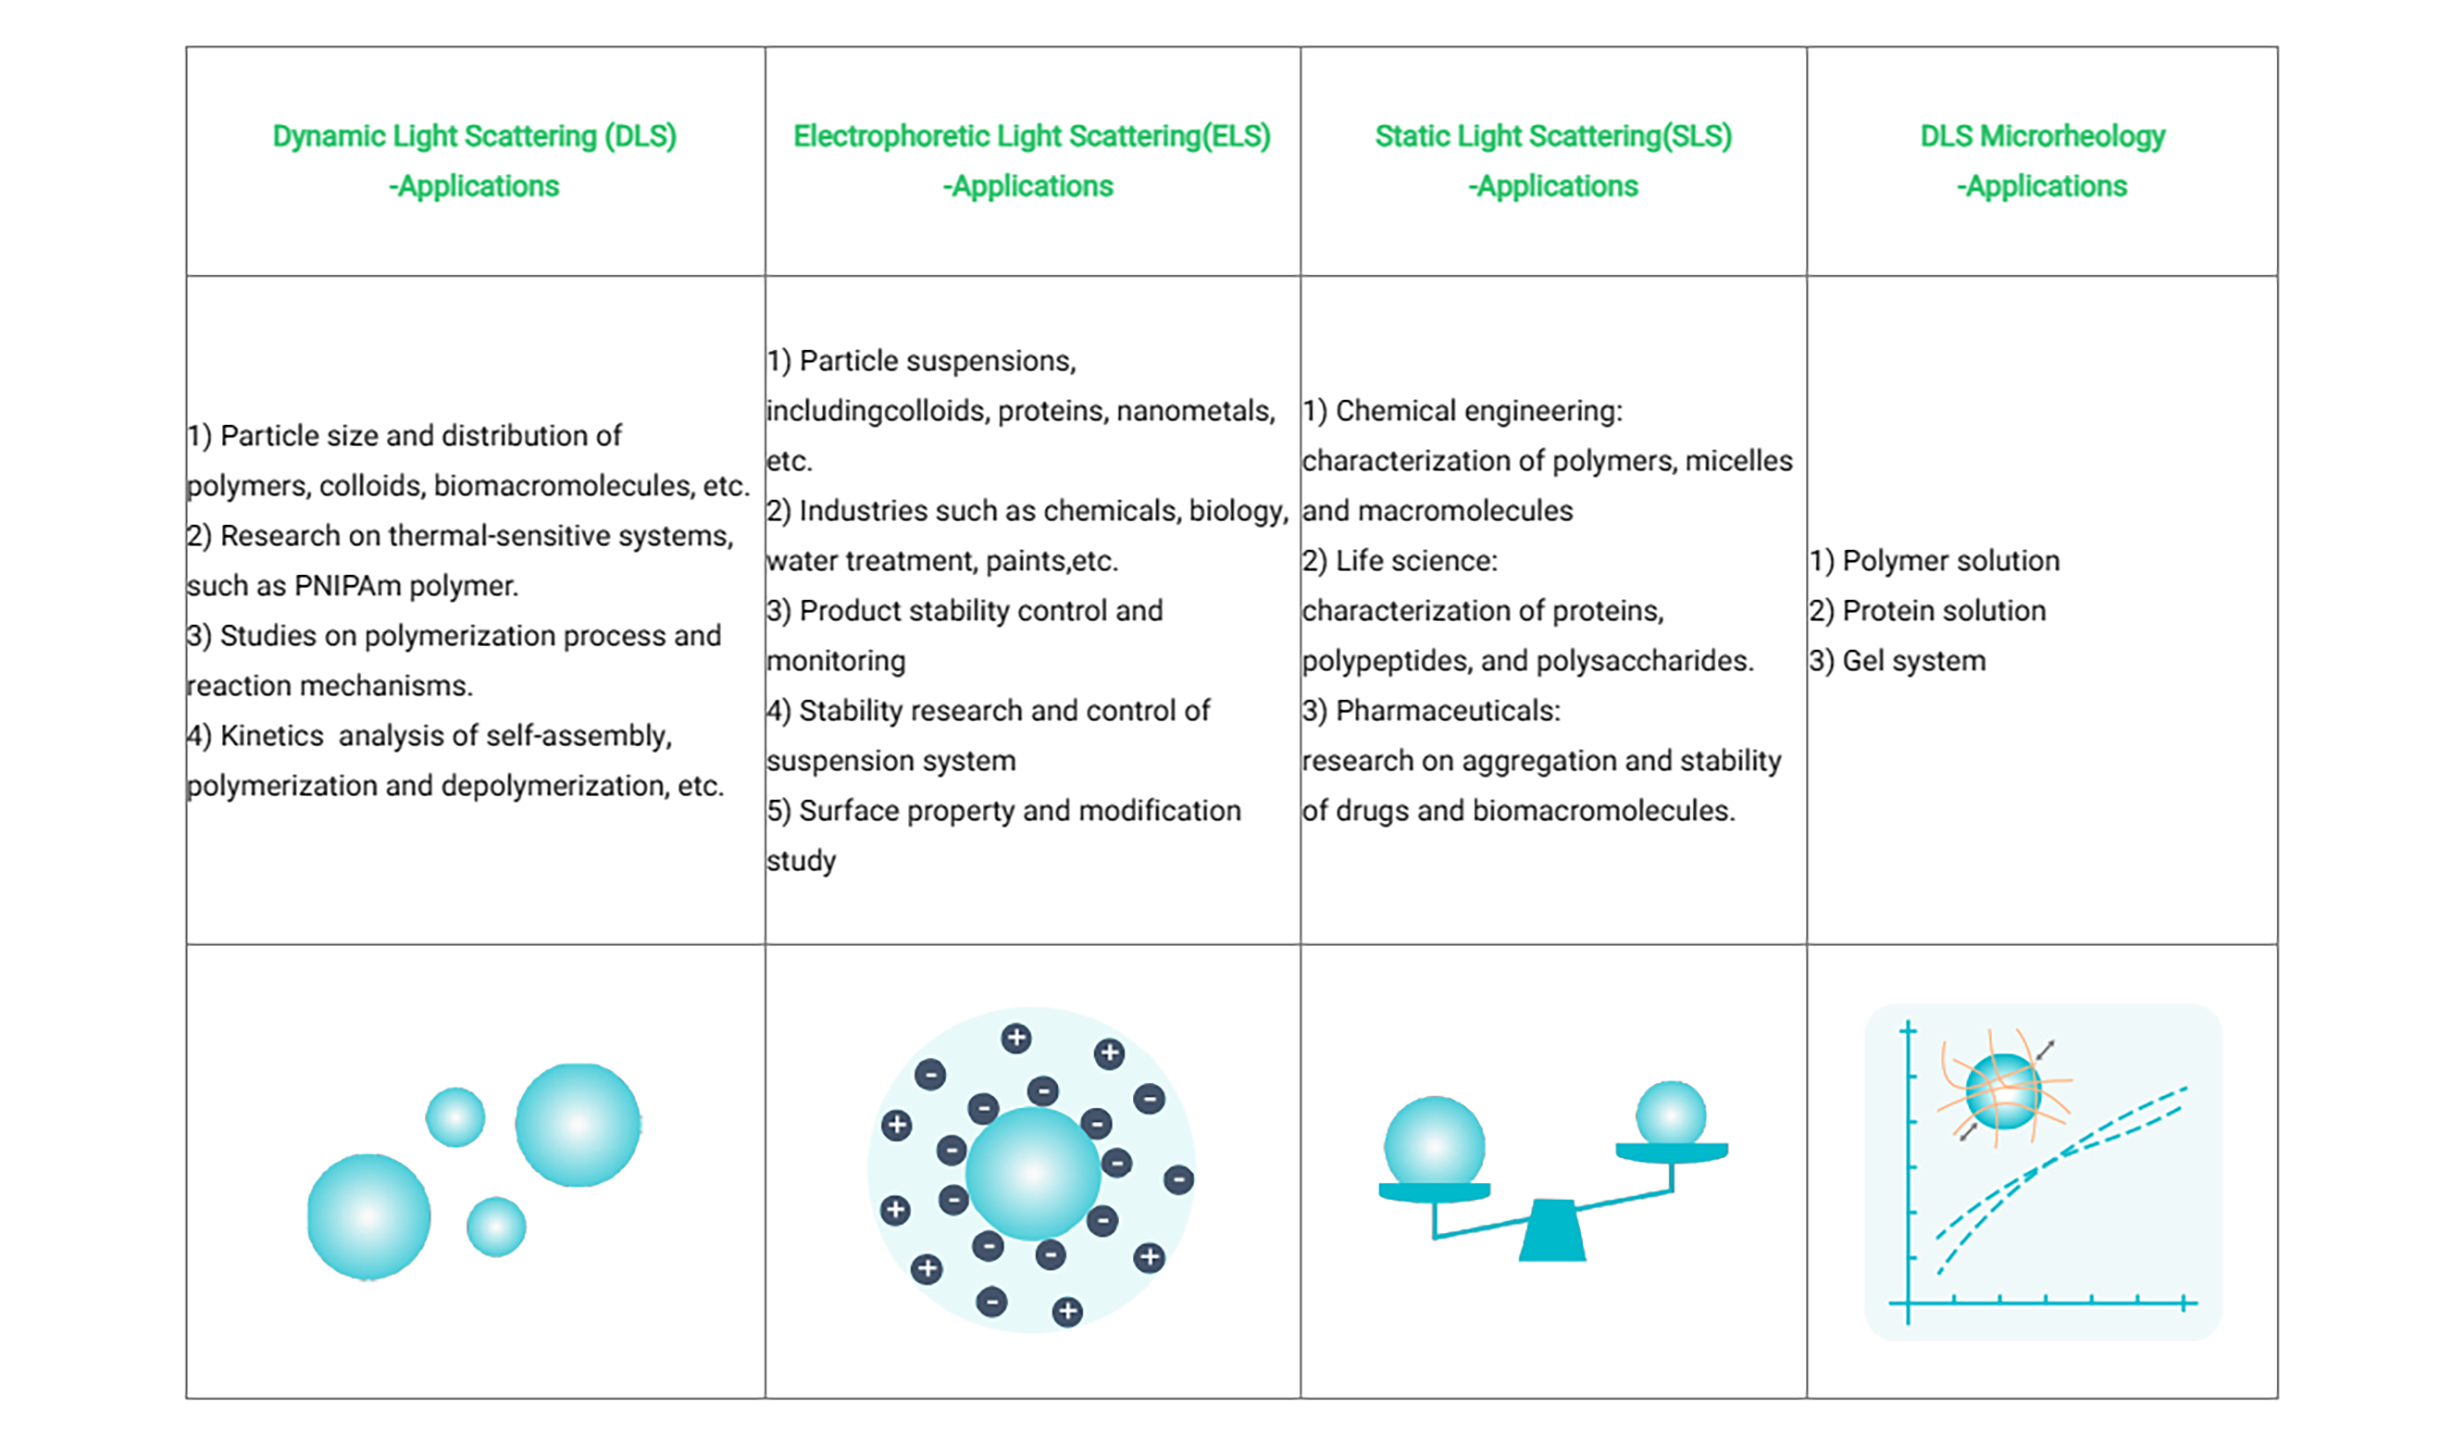
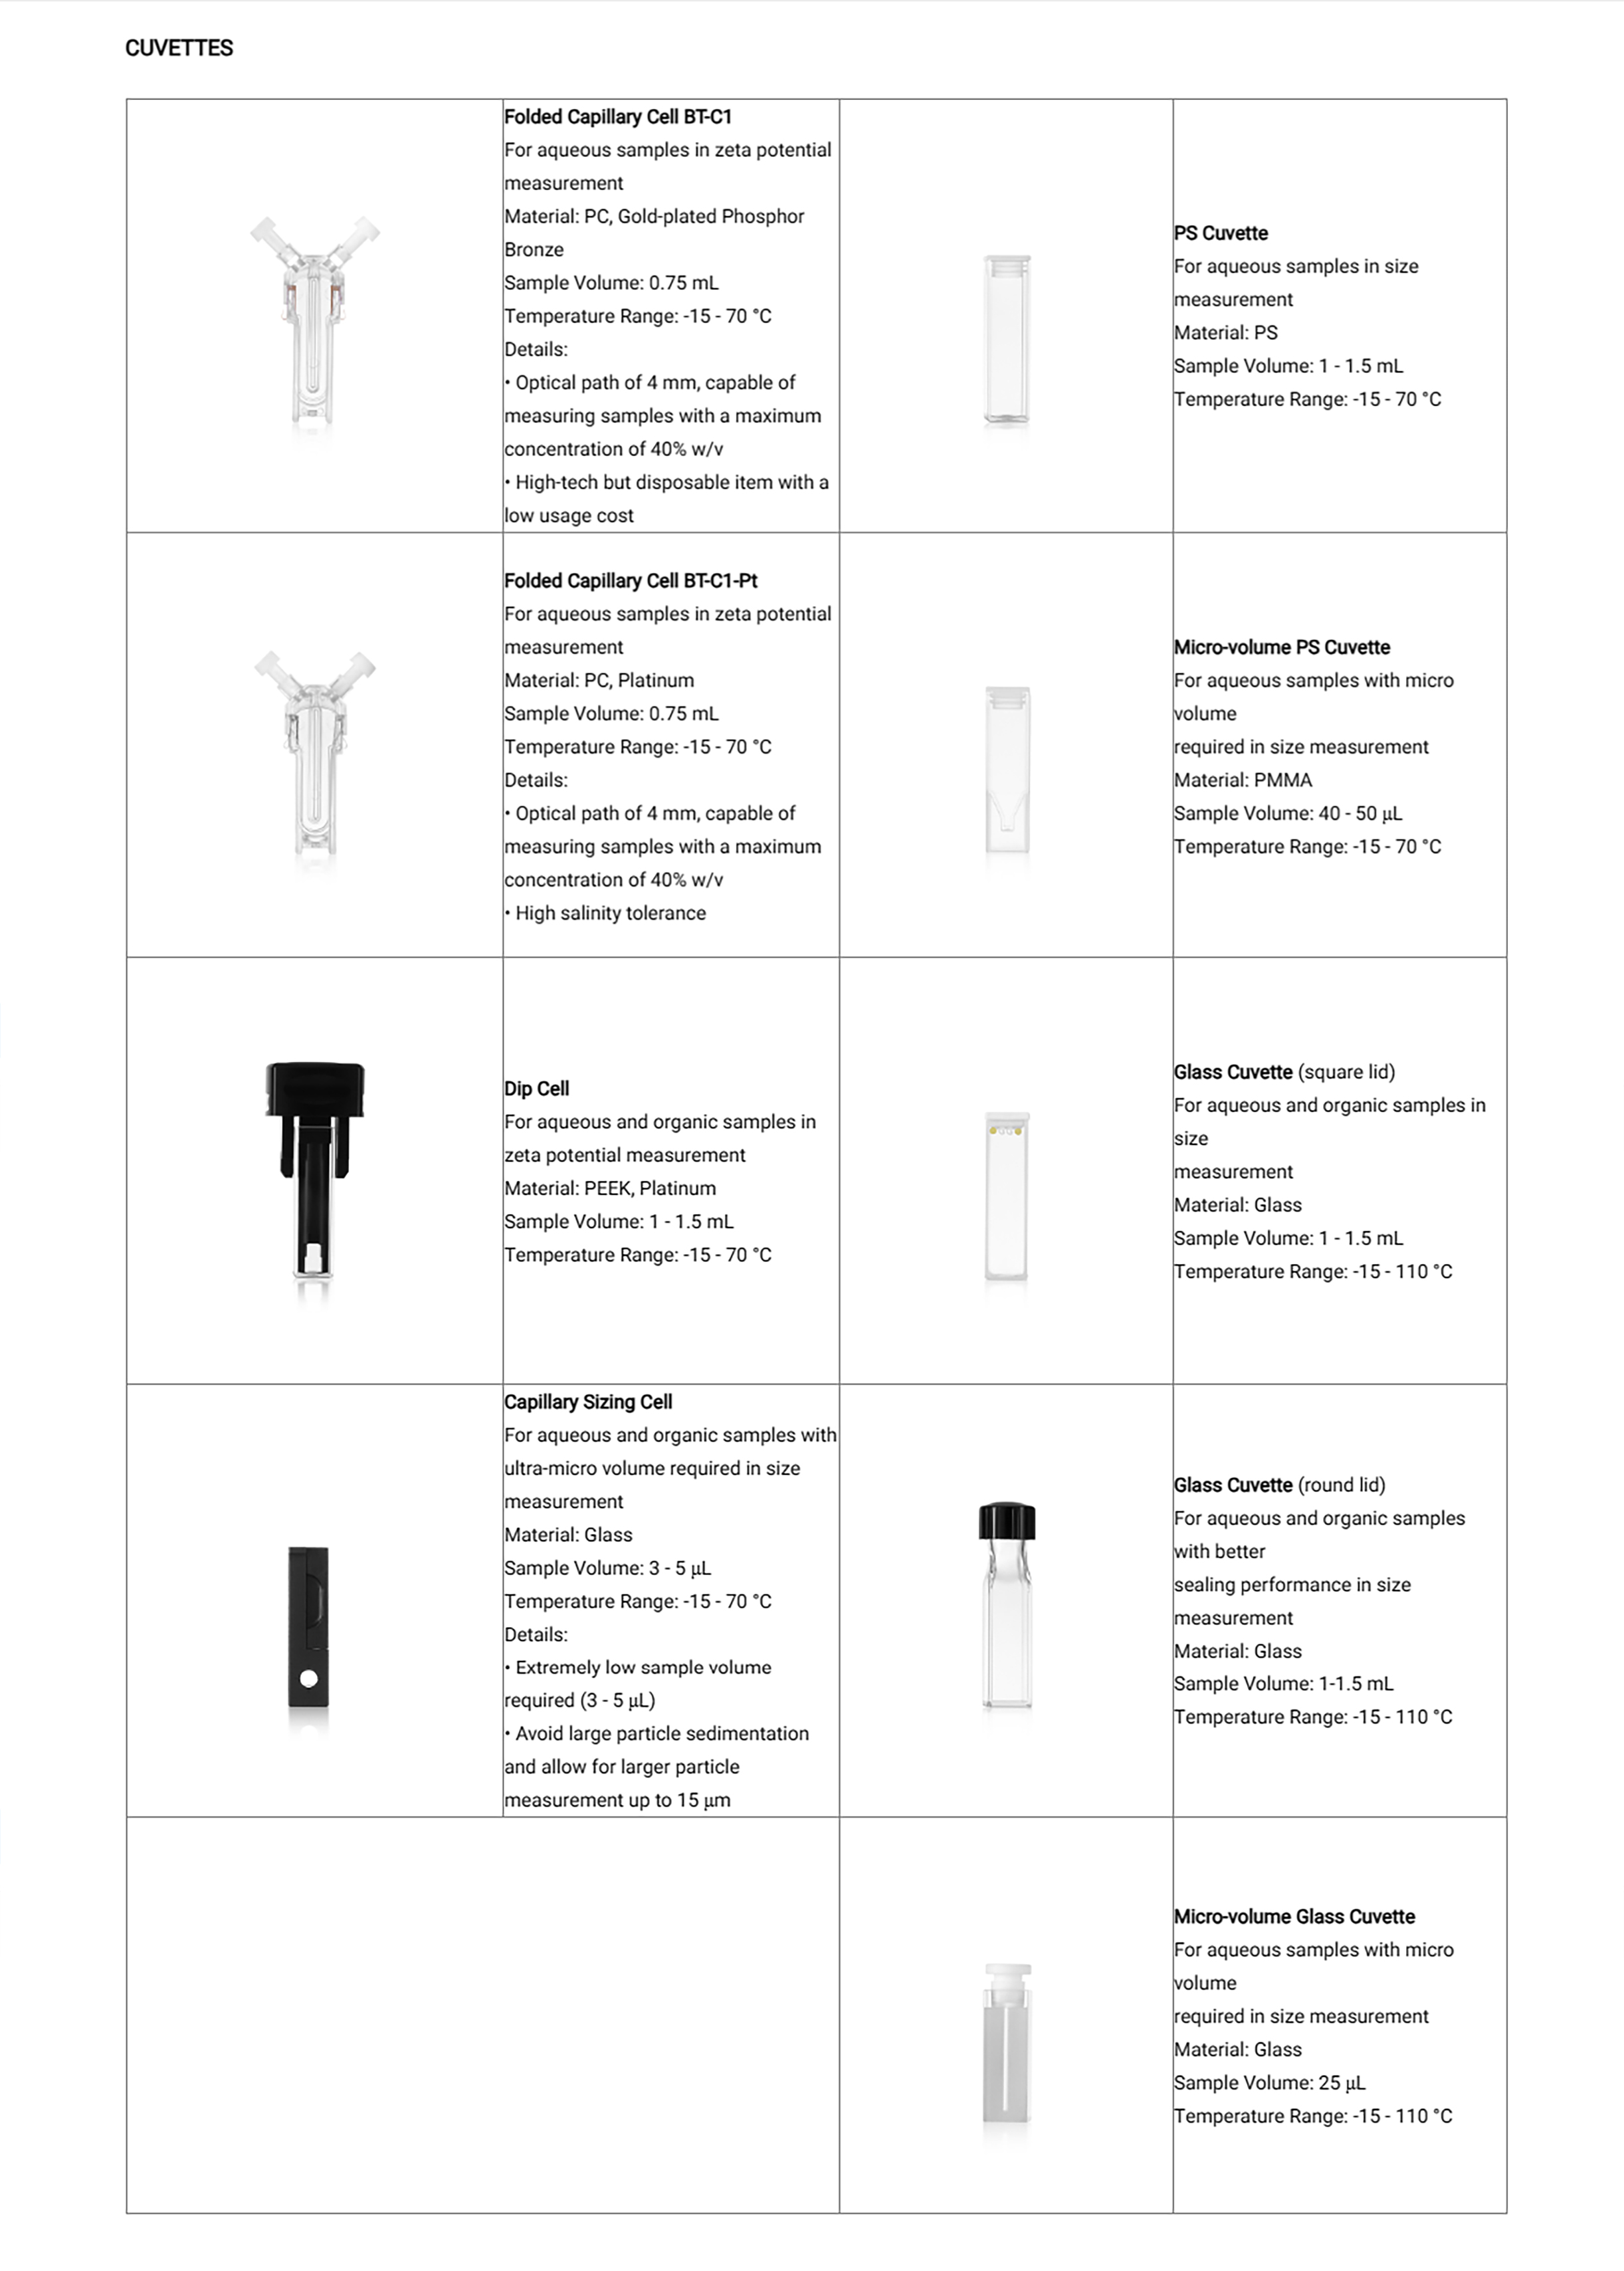
The BAT-1 Autotitrator is equipped with three high-precision titration pumps (with precision of 0.28 μL), and a magnetic stirrer, and is in combination with the BeNano series nanoparticle size and zeta potential analyzer for automatic acid-base titration and determination of isoelectric point (IEP). The pinch valve can close the circuit of the sample during the measurement, leading to high efficiency, accurate titration, good repeatability and the results being independent of operators. The disposable sample container can avoid the sample cross-contamination.
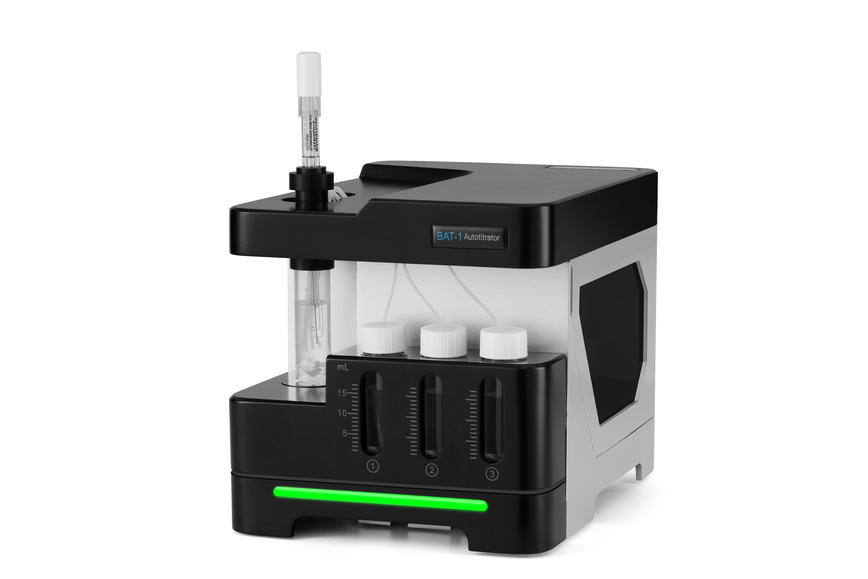
The BAT-1 Autotitrator is designed to be used with the BeNano series for the measurement of zeta potential over a wide pH range, providing the information of zeta potentials and the stability of samples in different conditions. The operation flow is as follows:
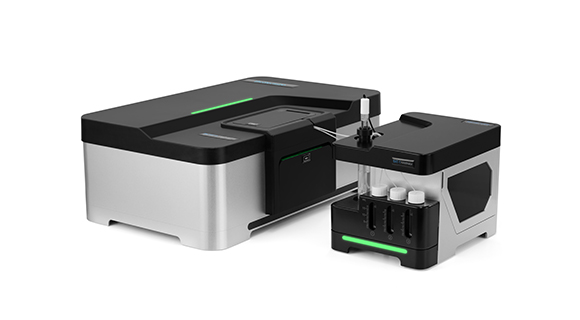




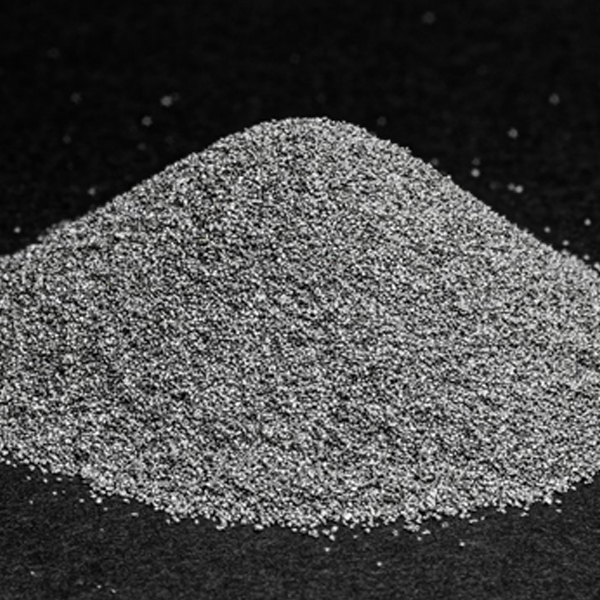
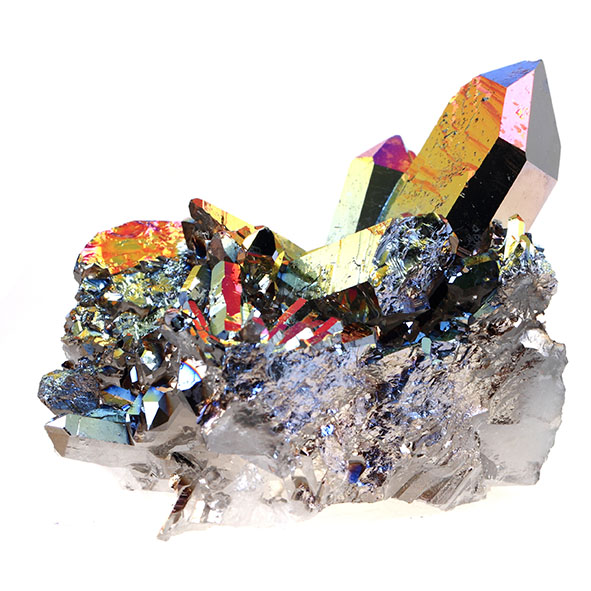
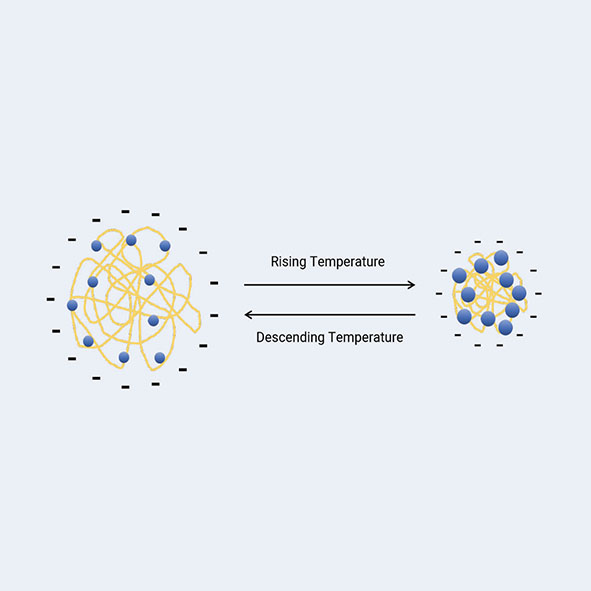

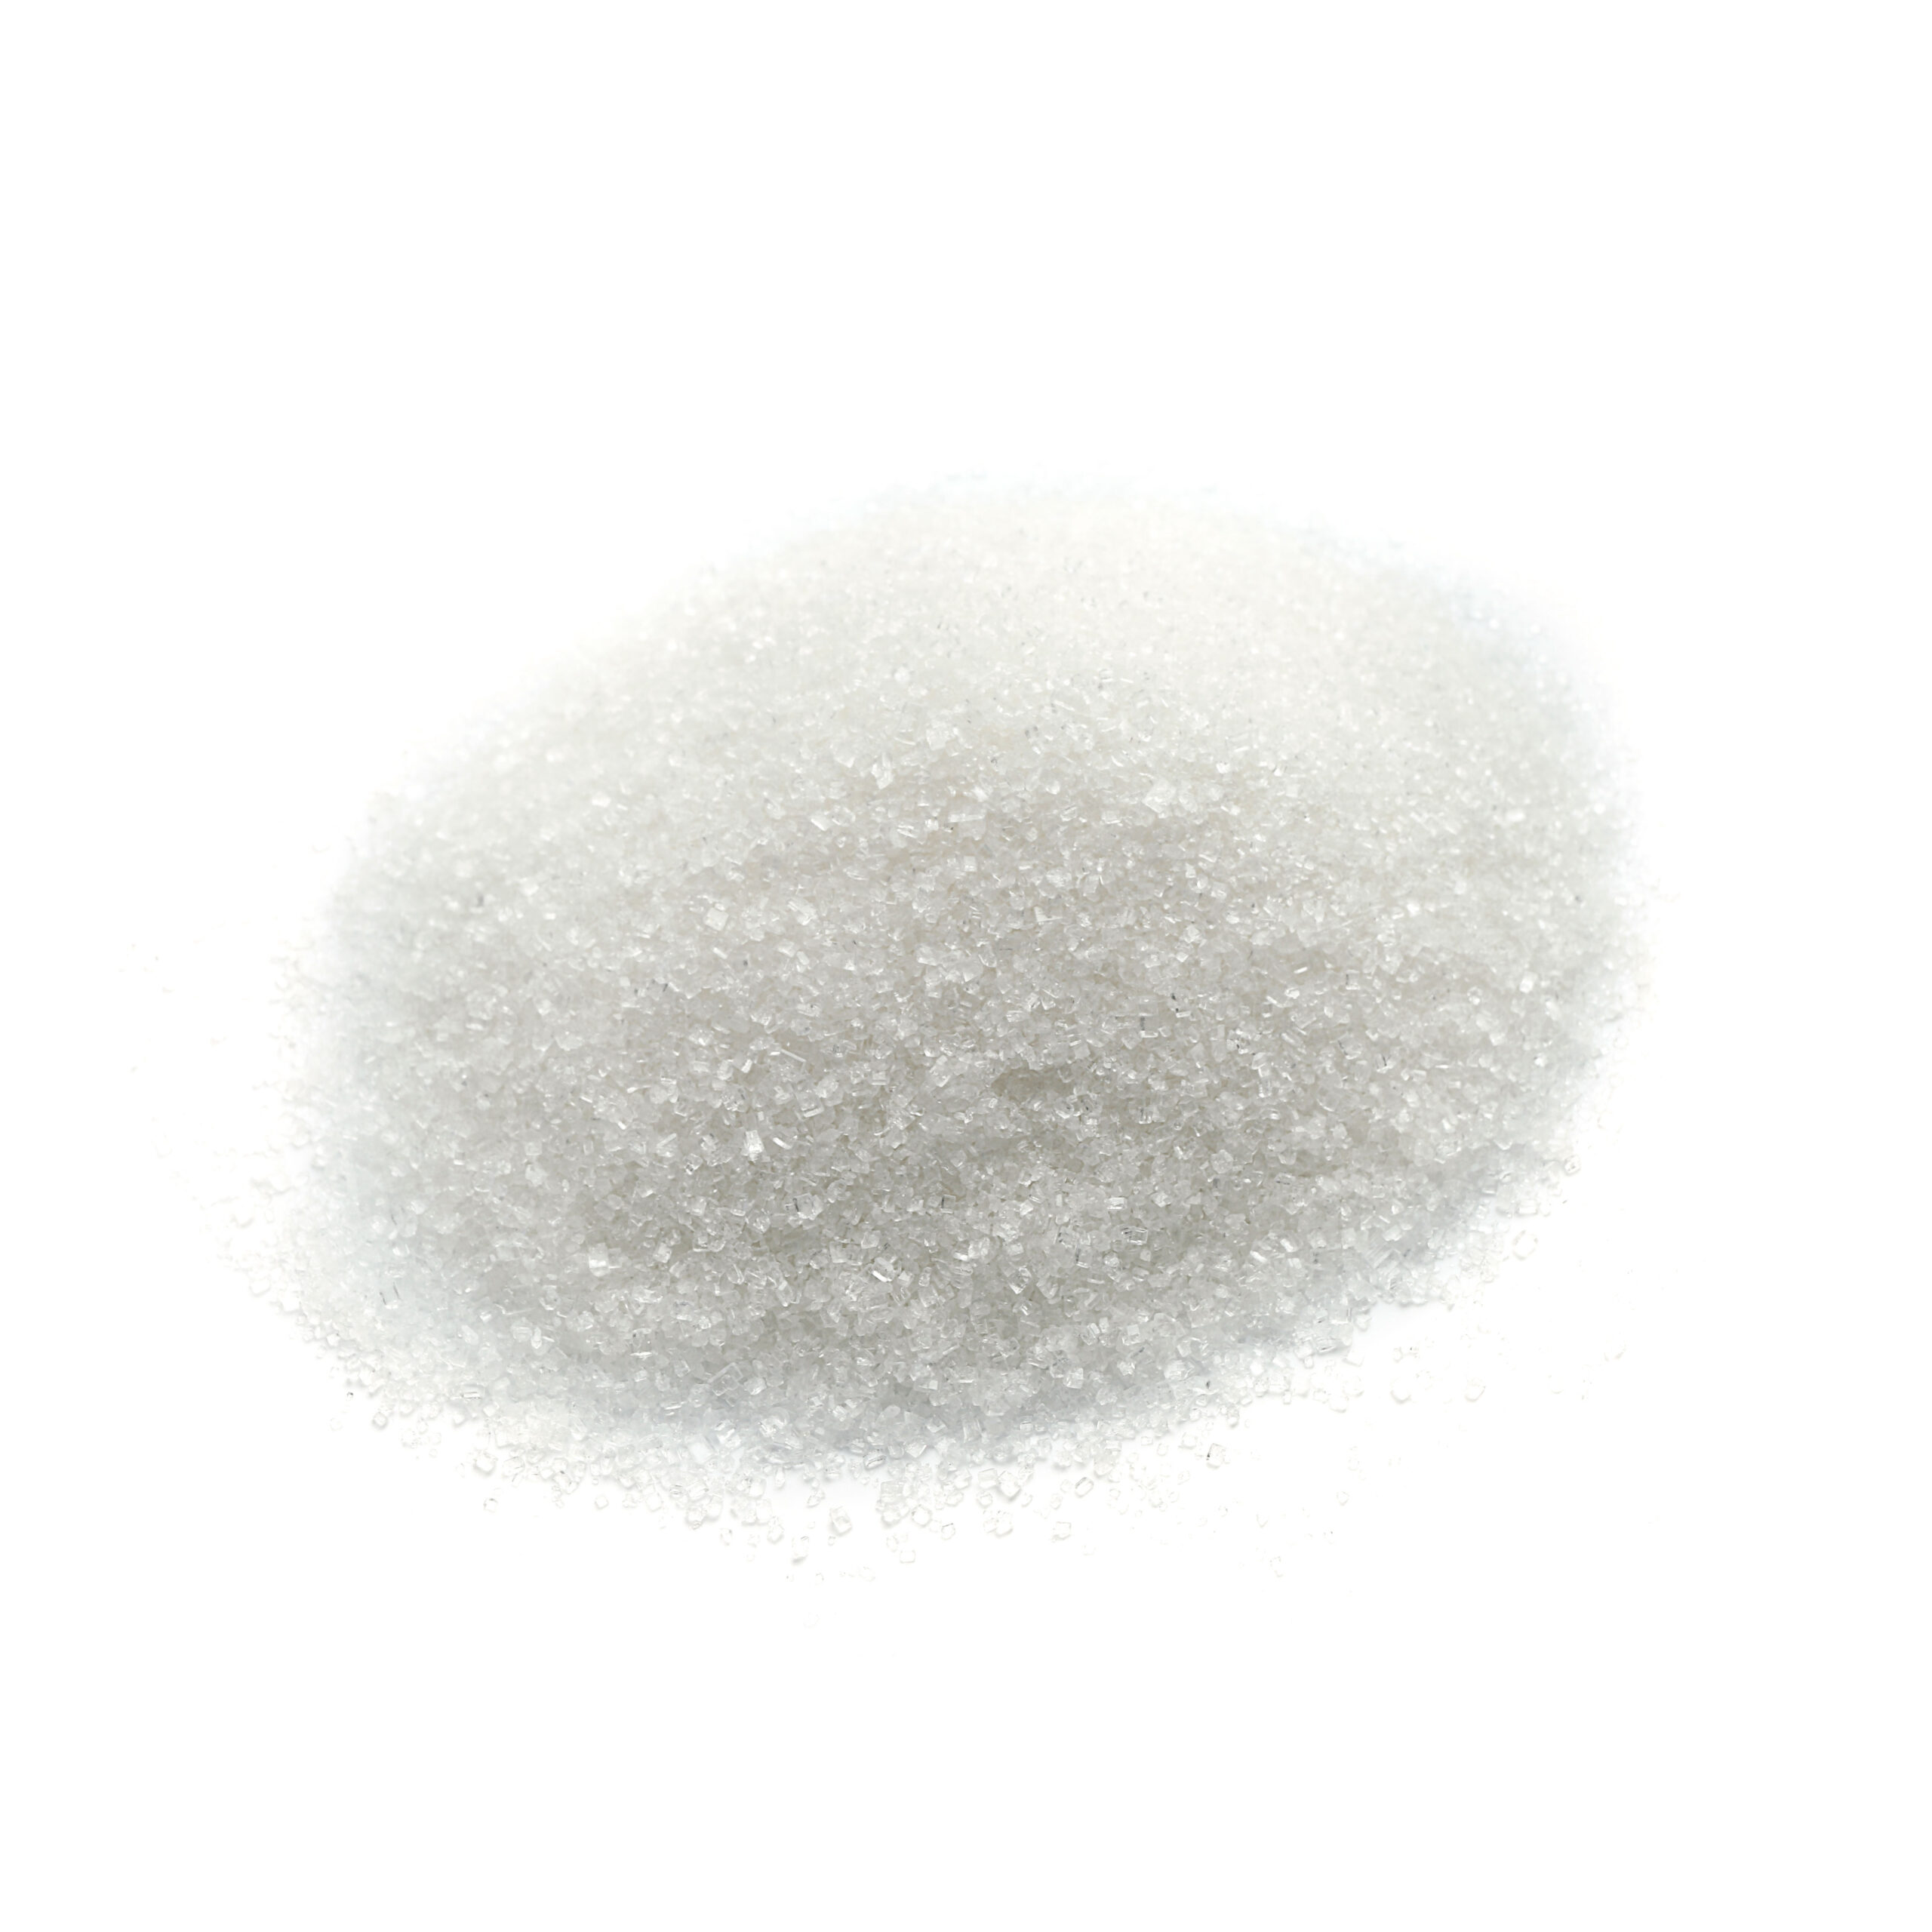


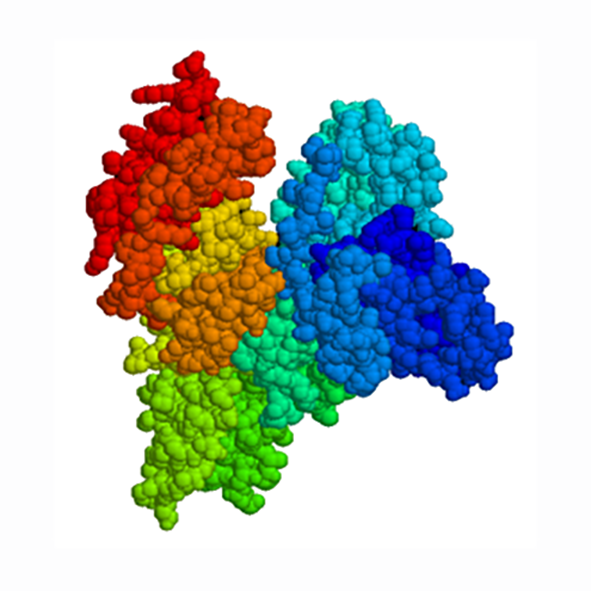
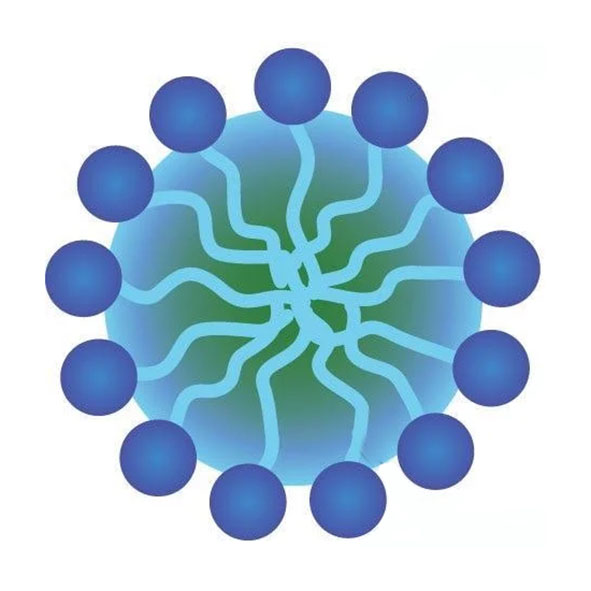
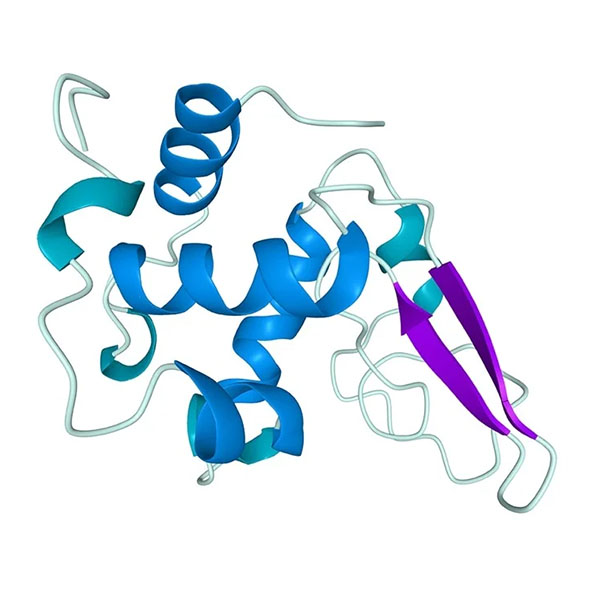

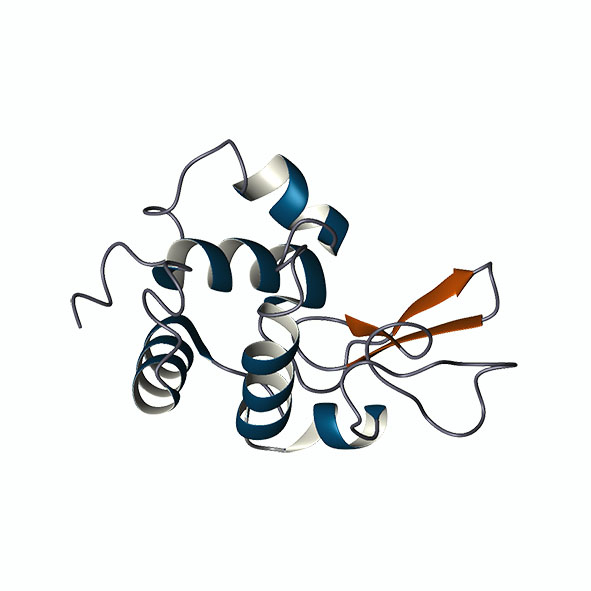
|
Functions |
Parameter |
BeNano 180 Zeta Pro |
BeNano 180 Zeta |
BeNano 90 Zeta |
BeNano Zeta |
BeNano 180 Pro |
BeNano 180 |
BeNano 90 |
|
Size |
Size |
0.3 nm – 15 μm* |
0.3 nm – 10 μm* |
0.3 nm – 15 μm* |
N/A |
0.3 nm – 15 μm* |
0.3 nm -10 μm* |
0.3 nm – 15 μm* |
|
Sample volume |
3 μL – 1 mL* |
40 μL – 1 mL* |
3 μL – 1 mL* |
N/A |
3 μL – 1 mL* |
40 μL – 1 mL* |
3 μL – 1 mL* |
|
|
Detection angle |
90° & 173° & 12° |
173° & 12° |
90° & 12° |
N/A |
90° & 173° |
173° |
90° |
|
|
Analysis algorithm |
Cumulants, General Mode, |
Cumulants, General Mode, |
Cumulants, General Mode, |
N/A |
Cumulants, General Mode, |
Cumulants, General Mode, |
Cumulants, General Mode, |
|
|
Upper limit of |
40% w/v* |
40% w/v* |
Optically clear+ |
N/A |
40% w/v* |
40% w/v* |
Optically clear† |
|
|
Detection position |
Movable position |
Movable position |
Fixed position |
N/A |
Movable position |
Movable position |
Fixed position |
|
|
Zeta potential |
Detection angle |
12° |
12° |
12° |
12° |
N/A |
N/A |
N/A |
|
Zeta potential |
No actual limitation |
No actual limitation |
No actual limitation |
No actual limitation |
N/A |
N/A |
N/A |
|
|
Electrophoretic mobility |
> ± 20 μm·cm/V·s |
> ± 20 μm·cm/V·s |
> ± 20 μm·cm/V·s |
> ± 20 μm·cm/V·s |
N/A |
N/A |
N/A |
|
|
Conductivity |
0 – 260 mS/cm |
0 – 260 mS/cm |
0 – 260 mS/cm |
0 – 260 mS/cm |
N/A |
N/A |
N/A |
|
|
Sample volume |
0.75 – 1 mL |
0.75 – 1 mL |
0.75 – 1 mL |
0.75 – 1 mL |
N/A |
N/A |
N/A |
|
|
Sample size |
2 nm – 110 μm |
2 nm – 110 μm |
2 nm – 110 μm |
2 nm – 110 μm |
N/A |
N/A |
N/A |
|
|
Other |
Molecular weight |
342 Da – 2 x 10⁷ Da* | 342 Da – 2 x 10⁷ Da* |
342 Da – 2 x 10⁷ Da* |
N/A |
342 Da – 2 x 10⁷ Da* |
342 Da – 2 x 10⁷ Da* |
342 Da – 2 x 10⁷ Da* |
|
Viscosity |
0.01 cp – 100 cp* |
0.01 cp – 100 cp* |
0.01 cp – 100 cp* |
N/A |
0.01 cp – 100 cp* |
0.01 cp – 100 cp* |
0.01 cp – 100 cp* |
|
|
Interaction parameter |
No actual limitation |
No actual limitation |
No actual limitation |
N/A |
No actual limitation |
No actual limitation |
No actual limitation |
|
|
Trend measurement |
Time and temperature |
Time and temperature |
Time and temperature |
Time and temperature |
Time and temperature |
Time and temperature |
Time and temperature |
|
|
System |
Temperature |
-15℃ – 110℃, |
-15℃ – 110℃, |
-15℃ – 110℃, ±0.1℃ |
-15℃ – 110℃, |
-15℃ – 110℃, |
-15℃ – 110℃, |
-15℃ – 110℃, |
|
Condensation control |
Dry air or nitrogen |
Dry air or nitrogen |
Dry air or nitrogen |
Dry air or nitrogen |
Dry air or nitrogen |
Dry air or nitrogen |
Dry air or nitrogen |
|
|
Laser source |
50 mW Solid-state laser, 671 nm#, Class 1 |
50 mW Solid-state laser, 671 nm#, Class 1 |
50 mW Solid-state laser, 671 nm#, Class 1 |
50 mW Solid-state laser, 671 nm#, Class 1 |
50 mW Solid-state laser, 671 nm#, Class 1 |
50 mW Solid-state laser, 671 nm#, Class 1 |
50 mW Solid-state laser, 671 nm#, Class 1 |
|
|
Correlator |
Up to 4000 channels, |
Up to 4000 channels, |
Up to 4000 channels, |
Up to 4000 channels, |
Up to 4000 channels, |
Up to 4000 channels, |
Up to 4000 channels, |
|
|
Detector |
Avalanche photodiode |
Avalanche photodiode |
Avalanche photodiode |
Avalanche photodiode |
Avalanche photodiode |
Avalanche photodiode |
Avalanche photodiode |
|
|
Intensity control |
0.0001% – 100%, |
0.0001% – 100%, |
0.0001% – 100%, |
0.0001% – 100%, |
0.0001% – 100%, |
0.0001% – 100%, |
0.0001% – 100%, |
|
|
Dimensions |
62.5 x 40 x 24.5 cm |
62.5 x 40 x 24.5 cm |
62.5 x 40 x 24.5 cm |
62.5 x 40 x 24.5 cm |
62.5 x 40 x 24.5 cm |
62.5 x 40 x 24.5 cm |
62.5 x 40 x 24.5 cm |
|
|
Power supply |
AC 100-240 V, |
AC 100-240 V, |
AC 100-240 V, |
AC 100-240 V, |
AC 100-240 V, |
AC 100-240 V, |
AC 100-240 V, |
|
|
Conformity |
21 CFR Part 11, ISO 13321, ISO 22412, ISO 13099 |
21 CFR Part 11, ISO 13321, ISO 22412, ISO 13099 |
21 CFR Part 11, ISO 13321, ISO 22412, ISO 13099 |
21 CFR Part 11, ISO 13321, ISO 22412, ISO 13099 |
21 CFR Part 11, ISO 13321, ISO 22412, ISO 13099 |
21 CFR Part 11, ISO 13321, ISO 22412, ISO 13099 |
21 CFR Part 11, ISO 13321, ISO 22412, ISO 13099 |
|
|
Optional Accessories |
Disposable |
40 – 50 μL |
40 – 50 μL |
40 – 50 μL |
N/A |
40 – 50 μL |
40 – 50 μL |
40 – 50 μL |
|
Micro-volume |
25 μL |
N/A |
25 μL |
N/A |
25 μL |
N/A |
25 μL |
|
|
Glass cuvette |
1 mL |
1 mL |
1 mL |
N/A |
1 mL |
1 mL |
1 mL |
|
|
Capillary sizing cell |
3 – 5 μL |
N/A |
3 – 5 μL |
N/A |
3 – 5 μL |
N/A |
3 – 5 μL |
|
|
Dip cell kit |
1 – 1.5 mL, |
1 – 1.5 mL, |
1 – 1.5 mL, |
1 – 1.5 mL, |
N/A |
N/A |
N/A |
|
|
* Dependent on samples and accessories † Up to 40% w/v using capillary sizing cell # 10mW 633nm He-Ne laser available on request |
||||||||

Paint rheology plays an important role in the formulation, manufacture and application of acrylic and oil-based paints. Understanding how paint flows under different shear conditions helps manufacturers optimise formulations, improve application performance and achieve consistent results. Rheological analysis can also help control properties such as viscosity, flow, levelling and resistance to sagging.
Water-based and solvent-based coatings can exhibit significantly different rheological behaviours. Measuring their flow curves as a function of shear rate allows manufacturers to understand how a coating behaves during mixing, pumping, application and drying.
By analysing these characteristics, formulators can adjust the composition of a paint or coating to achieve the desired application properties. This can help ensure that the finished product provides a consistent and user-friendly experience while also limiting unwanted flow or sagging after application.
Rheological testing provides valuable information about how a paint responds to different levels of shear. During manufacture, paints may experience high shear rates during mixing and dispersion, while application methods such as brushing, rolling or spraying create different shear conditions.
A well-characterised formulation should therefore perform consistently across these different stages. Paint rheology testing can help identify whether a formulation has the appropriate viscosity and flow behaviour for its intended application.
Acrylic and oil-based paints require carefully controlled rheological properties to achieve the desired balance between ease of application and resistance to unwanted movement. If a coating flows too easily, it may run or sag on vertical surfaces. If its viscosity is too high, it may be difficult to spread or apply evenly.
Rheological analysis allows manufacturers to investigate these behaviours and optimise formulations accordingly. This can support product development, quality control and batch-to-batch consistency.
By combining paint rheology measurements with formulation knowledge, manufacturers can develop coatings that offer predictable flow and application characteristics. Rheology testing is therefore a valuable tool for understanding acrylic, oil-based, water-based and solvent-based paints and coatings.
For more information on rheological testing and instrumentation, visit the Meritics rheology analysis services.

Gel strength plays a crucial role in the performance, texture and quality of many food, pharmaceutical and industrial products. From gelatine and confectionery to capsules and specialist formulations, manufacturers need reliable data to understand how a gel will behave during processing and in its final application.
The Gel Bloom Test provides a recognised method for assessing gel strength by measuring the force required to depress a standardised probe into a prepared gel. This measurement helps manufacturers compare formulations, monitor batch-to-batch consistency and establish whether a product meets its required specification.
The Bloom value provides an indication of the firmness and strength of a gel. A higher Bloom value generally indicates a stronger gel structure, while a lower value indicates a softer gel. However, gel behaviour depends on several factors, including concentration, temperature, preparation conditions, gelation time and raw material characteristics.
For this reason, controlling test conditions remains essential. Small differences in sample preparation or measurement can affect the result and make it difficult to identify genuine changes in product quality.
The Lamy Rheology Texture Analyser provides a controlled and repeatable way to perform the Gel Bloom Test. By applying a defined force through a standardised probe and recording the response, the analyser generates quantitative data that manufacturers can use to assess gel strength accurately.
The instrument also supports a consistent testing approach across development and quality control workflows. This helps users investigate formulation changes, verify raw material performance and monitor production batches with confidence.
A robust Gel Bloom Test gives manufacturers more than a single number. It provides a practical way to understand product behaviour, identify variation and maintain consistent quality. In this application note, we demonstrate how the Lamy Rheology Texture Analyser performs the test and how the resulting data can support reliable gel strength measurement.

Toothpaste needs to deliver more than effective oral care. Its texture, consistency and flow behaviour all influence how easily consumers dispense the product, apply it to a toothbrush and spread it across their teeth. Manufacturers therefore need to understand how toothpaste responds to mechanical forces throughout development and production.
The Lamy Rheology Texture Analyser provides quantitative data to help manufacturers characterise these important properties. By applying controlled forces and measuring the material’s response, the instrument helps users assess toothpaste consistency and identify differences between formulations.
A toothpaste that feels too firm may prove difficult to dispense, while a product that lacks sufficient structure can collapse or spread too easily. Changes in ingredients, moisture content, processing conditions and storage can all affect the final texture.
Texture analysis allows manufacturers to investigate these changes using repeatable measurements rather than relying solely on subjective assessment. This approach supports formulation development, raw material comparison and routine quality control.
The Lamy Rheology Texture Analyser can perform controlled penetration and compression tests to characterise the mechanical behaviour of toothpaste. These tests can help measure parameters such as firmness, consistency and adhesiveness, providing a clearer picture of how a formulation behaves under conditions that replicate practical use.
The Gel Bloom Test also demonstrates how the Lamy system can apply a defined test method and generate objective measurements of material strength. While traditionally associated with gel strength, the principles of controlled force measurement provide a useful foundation for understanding how different materials respond to mechanical stress.
Reliable texture measurements help toothpaste manufacturers identify formulation changes, investigate production variation and maintain consistent product performance. The Lamy Rheology Texture Analyser brings these measurements together in a controlled testing environment, giving manufacturers the data they need to make informed decisions throughout product development and quality control.

Consumers expect body creams to feel smooth, spread easily and leave the skin feeling comfortable after application. For manufacturers, achieving this balance requires careful control of formulation, ingredients and processing. Small changes in composition can alter firmness, consistency, spreadability and adhesion, affecting both product performance and the consumer experience.
Texture analysis of body cream provides manufacturers with objective data to understand these properties. Instead of relying solely on sensory assessment, manufacturers can measure how a cream responds to controlled mechanical forces and use the results to compare formulations and monitor product consistency.
Body creams need the right balance of structure and flow. A formulation that feels too firm can make dispensing and application difficult, while a cream with insufficient structure may spread too quickly or lack the desired consistency.
Ingredients such as oils, emulsifiers, waxes and thickeners can all influence the final texture. Manufacturing conditions and storage can also affect product behaviour. Measuring texture helps formulators understand these changes and optimise their products for both performance and consumer expectations.
The Lamy Rheology Texture Analyser provides controlled, repeatable measurements of the mechanical properties of body creams. A suitable probe applies a defined force to the sample, while the analyser records the material’s response.
This approach can help users evaluate parameters such as firmness, consistency, adhesiveness and work of application. Manufacturers can then compare different formulations, investigate ingredient changes and establish suitable quality-control parameters.
Reliable texture analysis of body cream gives manufacturers valuable information throughout product development and production. The data can highlight differences between batches, support formulation optimisation and help maintain a consistent consumer experience.
In this application note, we explore how the Lamy Rheology Texture Analyser can characterise body cream texture and provide quantitative data to support formulation development and quality control.

Cylindrical probes are used to make penetration test on
hard samples such as deodorant sticks. Doing this, we
can determine the firmness of the stick.

The disc plunger performs a compression test which
extrudes the product up and around the edge of the disc.
This test measures the consistency of viscous products,
like shampoo.

Compression-relaxation-traction test also known as
CRT test is used to determine the elasticity, the
consistency and the stickiness of soft sample.
Knowing theses parameters, it becomes possible to
determine the firmness, the cohesion and the
threading nature of the products.

The compression test used allows us to assess the
actuation force needed to push liquid outside the
syringe. Thanks to the adjustable workbench, it can
be used for syringes with a diameter between
0.9cm and 2.9cm in diameter.

Cosmetic products have different rheological behaviours
depending on how they were formulated and on their use.
A comparison of two different shampoos, i.e. Baby and Adult as
in this example, is characteristic of this

Particle characterisation techniques, such as laser diffraction and flow imaging microscopy, assess the size, shape, and distribution of particles in cosmetics. These analyses ensure uniformity, stability, and efficacy of products, aiding in quality control and formulation optimisation to meet consumer expectations and regulatory standards in the industry.
Analysing particle size involves techniques like laser diffraction to ensure uniformity, stability, and efficacy, meeting quality standards and consumer expectations in the cosmetics industry.
Powder flow analysis evaluates the flow properties of powders using techniques like flowability testing and caking, ensuring consistent manufacturing and optimal product performance.
Utilising rheometry, cosmetics undergo viscosity and flow analysis, ensuring product consistency, stability, and performance, crucial for meeting consumer expectations and regulatory standards in the cosmetics industry.
Particle shape analysis assesses the geometry of particles, ensuring product efficacy, texture, and stability, vital for formulating high-quality cosmetics that meet consumer preferences and regulatory requirements.
We encountered difficulties in maintaining the desired viscosity and texture of our hair gel formulations across production batches. This lead to performance issues and customer dissatisfaction.
At this point we turned to particle characterisation specialists – Meritics for their expertise.
Meritics advised us of the best way to address these challenges, was to implement viscometry as part of our quality control process. Investing in a rotational viscometer allowed us to measure the viscosity of our hair gel formulations accurately.
Dealing with Meritics was easy, we sent in an initial email with our query, their friendly staff asked us to send in some samples for them to test. The results were clear and concise, just what we needed to add to our production.