Our phone lines are down, this issue has been reported and is being dealt with in the meantime please email info@meritics.com or call 01582 519755 – we apologise for any inconvenience.

Author: Sophie Lindsey

Cosmetics

Industry
Information
Cosmetics

Why particle characterisation is important in the cosmetics industry

Particle characterisation techniques, such as laser diffraction and flow imaging microscopy, assess the size, shape, and distribution of particles in cosmetics. These analyses ensure uniformity, stability, and efficacy of products, aiding in quality control and formulation optimisation to meet consumer expectations and regulatory standards in the industry.

Analysing particle size

Analysing particle size involves techniques like laser diffraction to ensure uniformity, stability, and efficacy, meeting quality standards and consumer expectations in the cosmetics industry.

Powder Flow analysis

Powder flow analysis evaluates the flow properties of powders using techniques like flowability testing and caking, ensuring consistent manufacturing and optimal product performance.

Using Rheometry to test your cosmetics

Utilising rheometry, cosmetics undergo viscosity and flow analysis, ensuring product consistency, stability, and performance, crucial for meeting consumer expectations and regulatory standards in the cosmetics industry.

Using particle shape analysis

Particle shape analysis assesses the geometry of particles, ensuring product efficacy, texture, and stability, vital for formulating high-quality cosmetics that meet consumer preferences and regulatory requirements.

Case study

We encountered difficulties in maintaining the desired viscosity and texture of our hair gel formulations across production batches. This lead to performance issues and customer dissatisfaction.

At this point we turned to particle characterisation specialists – Meritics for their expertise.

Meritics advised us of the best way to address these challenges, was to implement viscometry as part of our quality control process. Investing in a rotational viscometer allowed us to measure the viscosity of our hair gel formulations accurately.

Dealing with Meritics was easy, we sent in an initial email with our query, their friendly staff asked us to send in some samples for them to test. The results were clear and concise, just what we needed to add to our production.

Instruments to support the cosmetics industry

Applications to support the cosmetics industry

Continue reading

Wall Coating Application Note

Industrial Applications
Wall Coating

Viscosity measure
of wall filler

Measuring the viscosity of wall filler is often difficult: either
the filler is too viscous for the instrument being used, or the
geometry compounds the product during measurement. We
have introduced a simple and effective technical solution for this
application

Continue reading

BeDensi B1-S

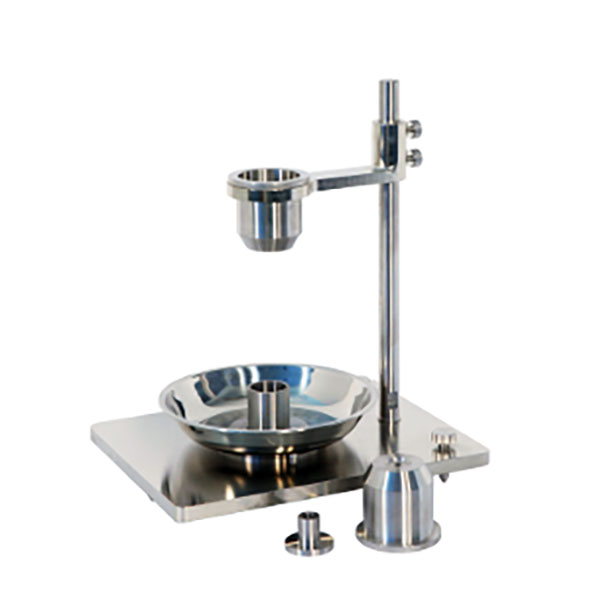
BeDensi B1-S Bulk Density Tester for Metals

Bettersize
BeDensi B1-S

Bulk Density Tester for Metals

  • Bulk Density
  • Scott Capacity meter
  • For use with metal powders

Download
brochure
   Request
quote

Beckman Coulter LS 13 320 XR Laser Diffraction Particle Size Analyser 21 CFR Part 11

The BeDensi B1-S is a bulk density tester designed for accurate and reliable measurements of various metal powders and pharmaceutical powders. It uses Scott capacity meter technology and is compliant with industry standards such as ISO 3923-2, ASTM B329, USP <616>, and EP 2.9.34. With its compact and durable design, the BeDensi B1-S is ideal for use in laboratories and production facilities. Whether you’re working with metal or pharmaceutical powders, the BeDensi B1-S is the perfect choice for precise and reliable bulk density measurements.

  • Key Features

    1. Measurement: Bulk density using Scott capacity meter technology

    The BeDensi B1-S bulk density tester measures bulk density using advanced Scott capacity meter technology. This method provides highly accurate and reliable measurements of the bulk density of various metal powders and pharmaceutical powders.

    2. Compliance with industry standards

    The BeDensi B1-S is fully compliant with ISO 3923-2, ASTM B329, USP <616>, and EP 2.9.34 manufacturing standards. This ensures that your results are precise, reliable, and accepted within the industry, giving you peace of mind and confidence in your measurements.

  • Technology

    Introduction

    Powder characterization includes flow measurements, morphology, particle size distribution, density, and chemical composition. Bettersize PowderPro Series instruments are mainly used for the analysis of the powder physical properties by testing items such as angle of repose and fall, angle of spatula (flat plate angle), bulk and tapped density, dispersibility, voidage and cohesion, angle of difference, compressibility, uniformity, flowability Index, floodability index, sieve size, angle of slide, etc.

    What are bulk density, tapped density and compressibility, flowability index?

    Bulk density: fill the powder sample into a measuring cup, and flatten the top, the ratio of the powder mass to the volume of the cup is defined as bulk density. It indicates the mass of the powder that can be added into the vessel per volume under normal conditions.

    Tapped density: fill the powder sample into a measuring cup; vibrate the cup at a certain amplitude and frequency to remove air from the powders. After reaching the required vibration time, flatten the sample. The ratio of the powder mass to the volume of the cup is defined as tapped density. Tapped density indicates the mass of powders filled into the vessel per volume after excluding air from the powders. The data of bulk density and tapped density are often used for the design of vessels, bags, and tanks for powder storage.

    Compressibility: it is the ratio of the difference between tapped density and bulk density to tap density. It shows the degree of volume reduction from bulk to tap state.

    Flowability Index: is a set of numerical values obtained by the weighted summation of angle of repose, Compressibility, angle of spatula, uniformity, and cohesion. It is used to comprehensively evaluate the flowability of the powder. The Flowability Index is mainly used to describe powder flowability under gravity.

    What are angle of repose, angle of fall, angle of difference, and flat plate angle (angle of spatula)?

    Angle of repose: Under the static balance, the angle between the slope of a powder pile and the horizontal plane is angle of repose. It is measured when the powders fall to a surface via gravity and form a cone. It indicates the flowability of the powders. The smaller the angle of repose is, the better the flowability of the powders.

    Angle of fall: After measuring the angle of repose, apply an external force to the powder pile to collapse it. The angle between the slope of the collapsed pile and the horizontal plane is defined as angle of fall.

    Angle of difference: It means the difference between the angle of repose and the angle of collapse. The larger the angle of difference is, the better flowability of the powders.

    Flat plate angle: immerse a plane in the powder pile; pull up the plane vertically, and one angle is formed between the slope of the powders on the plane and the plane. Apply an external force to obtain another angle. The average of these two angles is flat plate angle. The smaller the flat plate angle is, the better the flowability of the powders. The flat plate angle is usually larger than the angle of repose.

    How to measure flowability of metal powders?

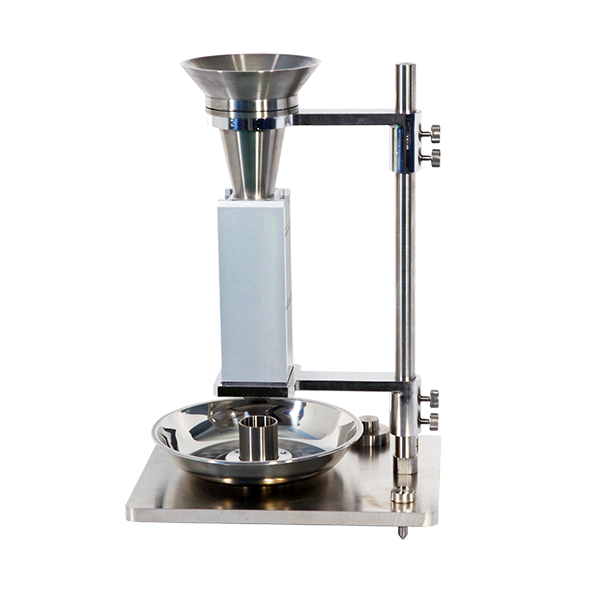
    According to ISO4490, the flowability of metal powders is usually measured with a Hall flow meter.

    The measurement process is:

    • Weigh 50g + 0.1g sample;
    • Plug the hole in the funnel with the finger;
    • Pour the sample into the funnel;
    • Quickly remove the finger from the small hole and start the stopwatch at the same time (precision 0.2S);
    • Wait until the powder sample runs out, and stops the timing immediately;
    • Evaluate the fluidity of the metal powder through the time of the 50g powder passing through the hole.

    The standard funnel of the Hall flowmeter needs to be calibrated by a standard sample with a flow speed of 40 + 0.5s/50g.

Not sure if it’s the right instrument?

No worries, send us a sample and we will test it for you


Send a sample

Continue reading

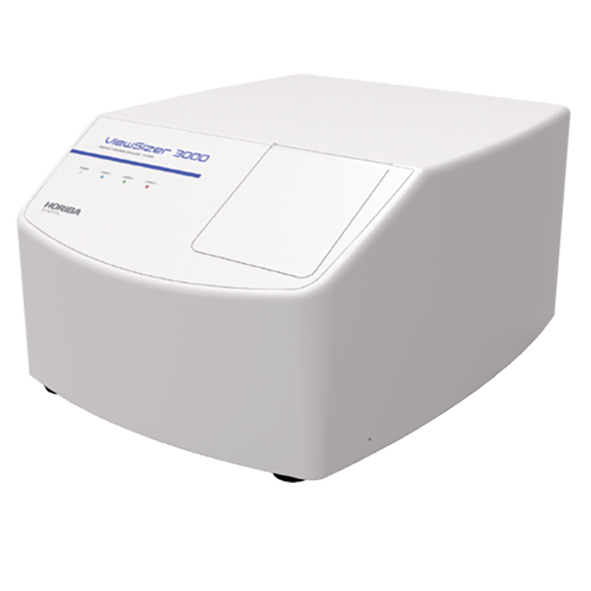
ViewSizer 3000

Viewsizer 3000 Simultaneous Multi-Laser Nanoparticle Tracking Analysis (NTA) Horiba Scientific Meritics Ltd Characterise metal powders whiskey shelf life

Horiba Scientific
ViewSizer 3000

Simultaneous Multi-Laser Nanoparticle Tracking Analysis (NTA)

  • Measurement range 10 nm – 15 µm
  • Concentration Measurement Range: 1E5 to 1E9 particles/mL
  • No cross-contamination

Download
brochure
   Request
quote

Beckman Coulter LS 13 320 XR Laser Diffraction Particle Size Analyser 21 CFR Part 11

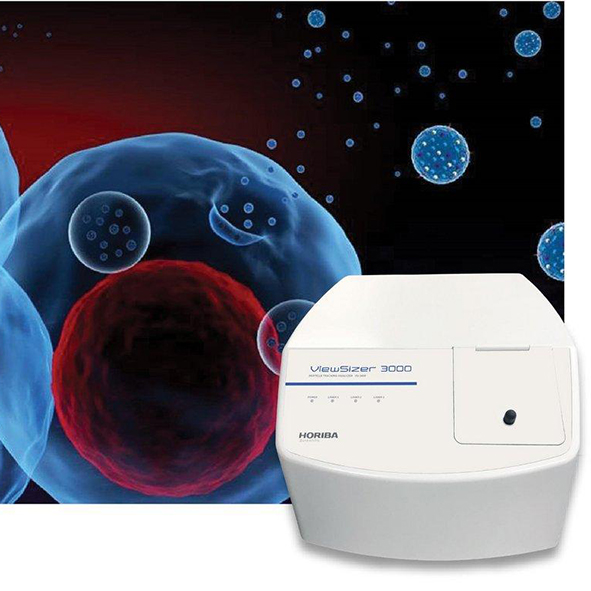
Exosomes? Virus? Nanoparticle? Use multiple lasers for complete, detailed analysis of all the particles in your sample.

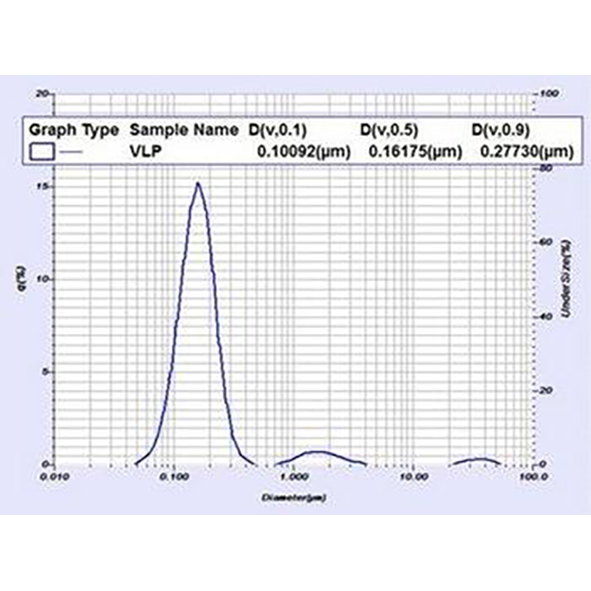
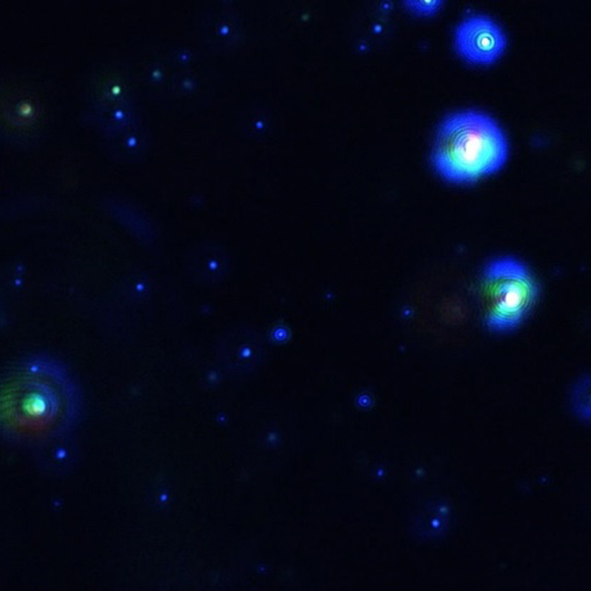
Exosomes, viruses, and nanoparticles all have wide size distributions which defeat traditional Nanoparticle Tracking Analysis (NTA) analyzers. The ViewSizer 3000 features simultaneous measurement with three lasers to collect the most accurate distribution and concentration information over a wide range of sizes within the same sample. Where the signal from a particle is too bright and saturates the detector from one laser, the software automatically uses data from a lower power laser to ensure the most accurate size and concentration information. On the other hand, when scattering from one laser is too weak for detection, the software uses data from a higher power laser to accurately track the particle.

Cross contamination is a concern in all analyses. Simplified cleaning means thorough cleaning. The easy-to-remove sample cells can be dissassembled for rapid, thorough cleaning, which leads to better data.

Escape the limits of traditional Nanoparticle Tracking Analysis

Accurate and sensitive analysis without cross contamination

Not sure if it’s the right instrument?

No worries, send us a sample and we will test it for you


Send a sample

Continue reading

BeDensi B1

BeDensi B1 Powder flow analyser

Bettersize
BeDensi B1

Bulk Density Analyser

  • Measurement: Bulk density
  • Testing sample: Except for metal powders
  • Technology: Natural deposition

Download
brochure
   Request
quote

Beckman Coulter LS 13 320 XR Laser Diffraction Particle Size Analyser 21 CFR Part 11

The BeDensi B1 is a bulk density analyser designed to provide accurate and reliable measurements of bulk density for samples other than metal powders. It uses the natural deposition method and is compliant with GB/T16913.3-1997-Part III: Determination of bulk density, ensuring that your results are always precise and consistent. With its easy-to-use and versatile capabilities, the BeDensi B1 is the perfect choice for anyone who needs reliable bulk density measurements for their materials and processes.

  • Key Features

    1. Natural deposition method for accurate measurements:

    The BeDensi B1 bulk density analyser uses the natural deposition method to provide highly accurate measurements of bulk density. This technology ensures that your results are always reliable and precise, no matter what type of material you are testing.

    2. Designed for testing samples other than metal powders:

    The BeDensi B1 bulk density tester is specifically designed for testing samples that are not metal powders, making it a versatile choice for a wide range of applications. Whether you are working with plastics, ceramics, or other non-metallic materials, the BeDensi B1 can provide accurate and reliable measurements of bulk density. With its easy-to-use and intuitive controls, it’s easy to get precise measurements of your materials, allowing you to make informed decisions about your processes and products.

    3. Compliant with GB/T16913.3-1997-Part III: Determination of bulk density:

    The BeDensi B1 bulk density tester is fully compliant with GB/T16913.3-1997-Part III: Determination of bulk density, ensuring that your results meet industry standards and are accepted around the world. This rigorous standard sets out precise guidelines for measuring bulk density, ensuring that your results are accurate and reliable. By using a compliant bulk density tester like the BeDensi B1, you can be confident that your measurements are consistent and comparable, allowing you to make informed decisions about your materials and processes.

  • Technology

    Introduction

    Powder characterization includes flow measurements, morphology, particle size distribution, density, and chemical composition. Bettersize PowderPro Series instruments are mainly used for the analysis of the powder physical properties by testing items such as angle of repose and fall, angle of spatula (flat plate angle), bulk and tapped density, dispersibility, voidage and cohesion, angle of difference, compressibility, uniformity, flowability Index, floodability index, sieve size, angle of slide, etc.

    What are bulk density, tapped density and compressibility, flowability index?

    Bulk density: fill the powder sample into a measuring cup, and flatten the top, the ratio of the powder mass to the volume of the cup is defined as bulk density. It indicates the mass of the powder that can be added into the vessel per volume under normal conditions.

    Tapped density: fill the powder sample into a measuring cup; vibrate the cup at a certain amplitude and frequency to remove air from the powders. After reaching the required vibration time, flatten the sample. The ratio of the powder mass to the volume of the cup is defined as tapped density. Tapped density indicates the mass of powders filled into the vessel per volume after excluding air from the powders. The data of bulk density and tapped density are often used for the design of vessels, bags, and tanks for powder storage.

    Compressibility: it is the ratio of the difference between tapped density and bulk density to tap density. It shows the degree of volume reduction from bulk to tap state.

    Flowability Index: is a set of numerical values obtained by the weighted summation of angle of repose, Compressibility, angle of spatula, uniformity, and cohesion. It is used to comprehensively evaluate the flowability of the powder. The Flowability Index is mainly used to describe powder flowability under gravity.

    What are angle of repose, angle of fall, angle of difference, and flat plate angle (angle of spatula)?

    Angle of repose: Under the static balance, the angle between the slope of a powder pile and the horizontal plane is angle of repose. It is measured when the powders fall to a surface via gravity and form a cone. It indicates the flowability of the powders. The smaller the angle of repose is, the better the flowability of the powders.

    Angle of fall: After measuring the angle of repose, apply an external force to the powder pile to collapse it. The angle between the slope of the collapsed pile and the horizontal plane is defined as angle of fall.

    Angle of difference: It means the difference between the angle of repose and the angle of collapse. The larger the angle of difference is, the better flowability of the powders.

    Flat plate angle: immerse a plane in the powder pile; pull up the plane vertically, and one angle is formed between the slope of the powders on the plane and the plane. Apply an external force to obtain another angle. The average of these two angles is flat plate angle. The smaller the flat plate angle is, the better the flowability of the powders. The flat plate angle is usually larger than the angle of repose.

    How to measure flowability of metal powders?

    According to ISO4490, the flowability of metal powders is usually measured with a Hall flow meter.

    The measurement process is:

    • Weigh 50g + 0.1g sample;
    • Plug the hole in the funnel with the finger;
    • Pour the sample into the funnel;
    • Quickly remove the finger from the small hole and start the stopwatch at the same time (precision 0.2S);
    • Wait until the powder sample runs out, and stops the timing immediately;
    • Evaluate the fluidity of the metal powder through the time of the 50g powder passing through the hole.

    The standard funnel of the Hall flowmeter needs to be calibrated by a standard sample with a flow speed of 40 + 0.5s/50g.

Not sure if it’s the right instrument?

No worries, send us a sample and we will test it for you


Send a sample

Continue reading

Sausage Application Note

Industrial
Applications
Sausage Firmness

Sausages firmness determination using Warner-Bratzler cell

Sausages are placed on the Warner-Bratzler base plate.
The cut inside it allows the blade to cut through samples
without trouble. Three different types of sausage are
used: pork, chicken and vegetable (wheat and peas). A
21mm compression test allows the blade to cut the
entire sausages.

Continue reading

Moxi V

Cell analysis Moxi V Introducing Moxi V

Orflo
Moxi V

Automated Cell Counter

  • True Cell Viability Counts
  • Precision Sizing
  • Highly Accurate
  • Rapid Assays

Download
brochure
   Request
quote

Beckman Coulter LS 13 320 XR Laser Diffraction Particle Size Analyser 21 CFR Part 11

Gold Standard Automated Cell Counter, Cell Size, and Viability

The Orflo Moxi V is your top choice for an Automated Cell Counter due to its exceptional accuracy and efficiency. Utilising Coulter Principle and fluorescence-based technology, it provides precise, reliable results quickly. Its user-friendly interface and high-throughput capability streamline operations, making it ideal for research. With its compact design and robust performance, the Moxi V ensures consistent, high-quality cell analysis, making it a valuable addition to any laboratory.

  • Overview

    The Moxi V Automated Cell Counter provides a combination of volumetric cell sizing (Particle Sizer) with simultaneous fluorescence (Cell Analyzer) to provide the most accurate cell counts, size, and viability in the industry. Specifically, the Moxi V employs the Coulter Principle to precisely measure the volumetric particle size of each particle for exact size measurements down to 3um in diameter (14fL volume), easily distinguishing between cells and debris. The system is also equipped with a 532nm laser and a 561nm/LP detection channel for robust cell viability analysis. Propidium Iodide (PI)-stained dead cells measure 50-100 times brighter fluorescence on the system than do live cells, removing the ambiguity associated with traditional Trypan Blue viability assessments. For each test, these size and viability measurements are applied, individually, to up to 23,000 cells in a matter of a few seconds. This ensures the highest level of precision and statistical robustness. As the fluidic volume is precisely metered as well, the particle counts are presented as an exact cell concentration.

    The Moxi V employs a patented, single-use, microfluidic flow cell. The flow cells eliminate the hassle of traditional Cell Analyzers and Coulter Counters, eliminating the need for cleaning, maintenance, clearing of clogs, cross contamination and occasionally replacement of bottles and tubes. The Moxi V uses very little sample volume, 60ul, allowing you to conserve your precious, potentially expensive, sample (e.g. stem cells). Cell concentrations as low as 10 cells/ul are possible, typically requiring just 5ul of cell sample diluted in 55ul of PBS.

    The Moxi V™ system comes standard with an ultra-intuitive, plug-and-play interface with free OS updates for as long as you own the instrument. No prior Cell Analysis experience is required – you simply just plug and play.

    Some Key Features of the Moxi V include:
    • True Cell Viability Counts – 50-100x more sensitive than vision counters.
    • Precision Sizing – Uses the Coulter Principle to get precise cell volumes with CVs less than 3% and no need for triplicates.
    • Highly Accurate – Accurate counts for smaller cells down to 3um (i.e. nuclei, RBCs). Uniquely accurate at low cell concentrations down to 10 cells per ul.
    • Rapid Assays – Offers a less than 15 second test that counts up to 23,000 cells compared to 200-300 counts on most vision counters.
  • Technical Specs

    Id

    MXV102

    Included accessories

    USB power cord, US style USB power adapter, and Type S+ cassette pack

    AC power type

    110 VAC

    Applications

    Gold Standard Cell Count, Cell Size, and Viability

    Battery Type

    Rechargeable 3.7 V, 7500 mAh lithium ion

    Cassette types

    Type S+

    Cell Particle Concentration Range

    10,000 – 5,000 cells/mL Type S+

    Cell types tested

    HEK-293
    HeLa
    PC12
    CD3+T
    CHO-K1
    Cos-7
    HepG2
    Hybridoma
    Jurkat E6-1

    MCF7
    Mesenchymal SC
    Monocyte
    Mouse ESC
    NIH 3T3
    PBMC (cultured)
    Red Blood Cells (RBC)
    L5178y
    C. albicans (Yeast)
    S. cerevisiae Vin 13 (Yeast)
    S. cerevisiae X5 (Yeast)
    Wine Yeast (natural fermentaion)
    S.cerevisiae (Baker’s Yeast
    Safale US-05 Yeast

    Data output formats

    FCS 3.1, screen shots (.bmp), CSV

    Data storage capasity

    4Gb

    Display resolution

    800 x 480 colour touchscreen

    Excitation wavelengths

    532nm

    In British units

    8 lbs

    Intended use statement

    For Research Use Only. Product is not for use in diagnostic procedures

    Laser colour

    Green

    Measurable dynamic range

    3 – 27 microns Type Type S+
    4 – 35 microns Type MF-M

    Measurement time

    10 seconds Type S+

    MPI cell health ratio

    Yes (Size histogram only)

    Number of detection channels flow parameters

    2 colour, 1 size, 1 forward extinction

    Number of PMTs

    1

    Optical detection range

    561nm/LP (e.g. PI)

    Particle size detection method

    Impedimetric (Coulter Principle)

    Pre-programmed tests

    Gold Standard Cell Count, Cell Size, and Viability

    Sample type

    Cell Preparations

    Sample volume

    60 µL

    Supported connectivity

    USB on-the-go

    Useable cell volume

    14 – 10,306 fL Type S+
    14 – 22,449 fL Type MF-M

    Weight

    3.6 kg

  • How it works

    The operating principle behind the Moxi V is a unique combination of Coulter-Principle cell size determination with simultaneous fluorescence detection. As cells flow single file through the microfabricated single-use flow cell the volume of each particle is measured at the exact same time as their primary fluorescence is measured using a 532nm solid state diode laser with a 561nm/LP (e.g. PI) emission filter. Thousands of cells are measured in the 10 second read time and the data are plotted in a gradient density scatter plot as Cell size (volume) vs. Fluorescence (PMT voltage). Gating is automatically performed by the system but can be easily adjusted/tuned by the user. The resulting live/dead ratios are automatically calculated (depending on the app selected). The analyzed data can also be displayed as a two color size histogram. Total volumetric cell counts are automatically determined for each test by precisely measuring the volume of fluid being analysed.

    Step 1:
    Select desired app, insert the cassette and close the doors.

    Step 2:
    Once auto-alignment is complete, open the top door and pipette 60μl of labelled sample into the cassette.
    Step 3:
    Close the top door, assays run automatically and results are generated in ~10 seconds. Note: Each cassette holds 2 tests. When Sample 1 is complete, simply re-insert other end of cassette into Moxi V, and load Sample 2.
    Data

    Data can be displayed on the unit in both a color density scatter plot and a two color size histogram. Simply drag gates using the intuitive touch display for instant live/dead ratio calculations and each of the gated volumetric cell counts (i.e., total population, live population, and dead population (Viability App). The mean cell volume for the gated populations is also automatically displayed on the unit. Results from each test are stored in the standard FCS 3:1 format and can be viewed using any Cell Analysis package. The actual Moxi V screenshots from each assay (dot plots and histograms) are also stored in bitmap format for use online. Hundreds of files can be stored on each Moxi V and are easily transferred to a Mac or PC using USB on-the-go. No aditional software is required.

Not sure if it’s the right instrument?

No worries, send us a sample and we will test it for you


Send a sample

Continue reading

Moxi GO II

Orflo
Moxi GO II

Mini Automated Cell Analyzer

  • Small footprint enables portability and convenience.
  • Fast (<10 sec) test times and no warm-up periods ensure rapid results.
  • Intuitive, touchscreen design for ease of use.
  • No cleaning or maintenance required.

Download
brochure
   Request
quote

Beckman Coulter LS 13 320 XR Laser Diffraction Particle Size Analyser 21 CFR Part 11

Next Generation Coulter-Principle Cell Analyser.

The Orflo Moxi GO II  Cell Analyser is the best solution for cell counting due to its precision, speed, and ease of use. Combining Coulter Principle-based sizing with fluorescence-based viability, it offers highly accurate and reproducible results. Its intuitive interface and automated processes ensure rapid and user-friendly operation, making it ideal for both novice and experienced users. The Moxi GO II’s compact design and high-throughput capabilities make it perfect for various applications, including research labs and biotech industries, providing consistent and reliable cell analysis.

  • Overview

    Combines the Coulter Principle (for highly-accurate cell counts and exact, volumetric cell sizing) with a 488nm laser and two PMT fluorescence detection channels (for cell health assays, robust CAR-T monitoring, cellular response profiling, and immuno-profiling).

    The Moxi GO II’s new Auto-Gating feature will analyse results in an accurate, repeatable way to provide the most consistent results — presented in a simplified new Data Summary page. The new Batch Mode feature allows you to run multiple tests of the same sample type. It will auto-find live and dead cell populations, eliminating user-to-user variability.

  • Technical Specs

    Id

    MXG102

    Included accessories

    USB power cord, US style USB power adapter, and Type S+ cassette pack

    AC power type

    110 VAC

    Applications

    Mulitplexed Bead ELISA’s
    In Cell Westerrns
    In Cell Protein Quant
    GFP
    Gold Standard Cell Count and Viability
    Mito Potential
    ROS
    Phagocytosis

    Battery Type

    Rechargeable 3.7 V, 4400 mAh lithium ion

    Cassette types

    Type S+

    Cell Particle Concentration Range

    5,000 – 1,000,000 cells/mL Type S+

    Cell types tested

    HEK-293
    HeLa
    PC12
    CD3+T
    CHO-K1
    Cos-7
    HepG2
    Hybridoma
    Jurkat E6-1
    K562
    MCF7
    Mesenchymal SC
    Monocyte
    Mouse ESC
    NIH 3T3
    PBMC (cultured)
    Red Blood Cells (RBC)
    L5178y
    C. albicans (Yeast)
    S. cerevisiae Vin 13 (Yeast)
    S. cerevisiae X5 (Yeast)
    Wine Yeast (natural fermentaion)
    S.cerevisiae (Baker’s Yeast
    Safale US-05 Yeast

    Data output formats

    FCS 3.1, screen shots (.bmp), CSV

    Data storage capasity

    4Gb

    Display resolution

    800 x 480 color touchscreen

    Excitation wavelengths

    488nm

    In British units

    10 lbs

    Intended use statement

    For Research Use Only. Product is not for use in diagnostic procedures

    Laser colour

    Blue

    Measurable dynamic range

    3 – 27 microns Type Type S+
    4 – 35 microns Type MF-M

    Measurement time

    10 seconds Type S+

    MPI cell health ratio

    Yes (Size histogram only)

    Number of detection channels flow parameters

    2 color, 1 size, 1 forward extinction

    Number of PMTs

    2

    Optical detection range

    525/45nm (e.g. FITC, GFP) and 561nm/LP (e.g. PE, RFP)

    Particle size detection method

    Impedimetric (Coulter Principle)

    Platform

    Open platform: 561nm/LP (PI, PE, DS Red, Sytox Orange, 7 AAD, Nile Red, Rhodamine Red, Sun Coast Yellow, PE/Cy5), 525/45nm (FITC, GFP, Alexa Fluor 488nm, Calcein)

    Pre-programmed tests

    Mulitplexed Bead ELISA’s
    In Cell Westerrns
    In Cell Protein Quant
    RFP
    Gold Standard Cell Count and Viability
    Mito Potential
    ROS
    Phagocytosis

    Resolution histogram bins

    1000

    Sample type

    Beads
    Cell Preparations

    Sample volume

    60 µL

    Supported connectivity

    USB on-the-go

    Useable cell volume

    14 – 10,306 fL Type S+
    14 – 22,449 fL Type MF-M

    Weight

    4.53 kg

  • How it works

    The operating principle behind the Moxi GO II Cell Analysers is a unique combination of Coulter-style cell size determination with simultaneous fluorescence detection. As cells flow single file through the microfabricated single-use flow cell the volume of each particle is measured at the exact same time as their primary fluorescence is measured using a 488nm (MXG102) solid state diode laser with and with the following emission filters – 525/45nm (e.g. FITC, GFP, Alexa 488) and 561nm/LP (e.g. PE, RFP). Thousands of cells are measured in the 10 second read time and the data are plotted in a gradient density scatter plot as Cell size (volume) vs. Fluorescence (PMT voltage). Gating is easily performed on the unit using a interactive touch display, and the resulting live/dead ratios are automatically calculated (depending on the app selected). The analyzed data can also be displayed as a two color size histogram. Total volumetric cell counts are automatically determined for each test by precisely measuring the volume of fluid being analysed.

    Step 1:
    Select desired app, insert the cassette and close the doors.

    Step 2:
    Once auto-alignment is complete, open the top door and pipette 60μl of labelled sample into the cassette.
    Step 3:
    Close the top door, assays run automatically and results are generated in ~10 seconds. Note: Each cassette holds 2 tests. When Sample 1 is complete, simply re-insert other end of cassette into Moxi GO, and load Sample 2.
    Data

    Data can be displayed on the unit in both a color density scatter plot and a two color size histogram. Simply drag gates using the intuitive touch display for instant live/dead ratio calculations and each of the gated volumetric cell counts (i.e., total population, live population, and dead population (Viability App). The mean cell volume for the gated populations is also automatically displayed on the unit. Results from each test are stored in the standard FCS 3:1 format and can be viewed using any Cell Analysis analysis package. The actual Moxi Flow screenshots from each assay (dot plots and histograms) are also stored in bitmap format for use online. Hundreds of files can be stored on each Moxi GO and are easily transferred to a Mac or PC using USB on-the-go. No aditional software is required.


  • Applications

    Apoptosis Monitoring

    Transfection Monitoring

    Yeast Monitoring in Brewing

    Immuno-phenotyping

    Mitochondrial Membrane

    Reactive Oxygen Species

Not sure if it’s the right instrument?

No worries, send us a sample and we will test it for you


Send a sample

Continue reading

Magnometer

Mageleka
MagnoMeter XRSTM

Particle Suspension Characterisation Analyser

  • Remote operation for controlled or hazardous substances
  • Direct Digital Synthesis technology
  • Simple and intuitive software

Download
brochure
   Request
quote

Beckman Coulter LS 13 320 XR Laser Diffraction Particle Size Analyser 21 CFR Part 11

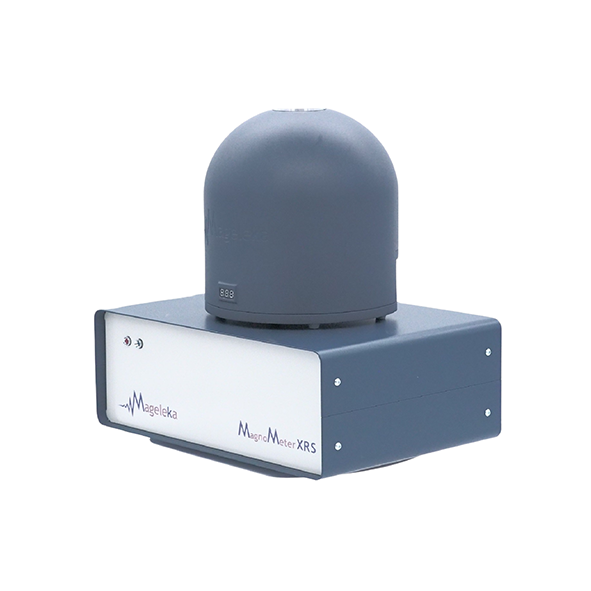
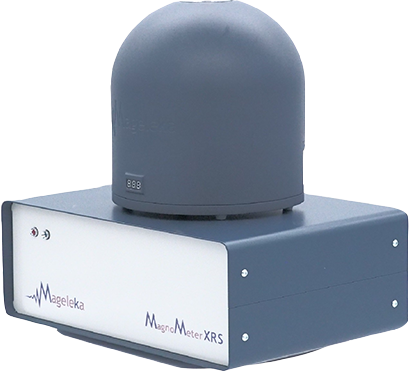
MagnoMeter XRS – Particle Suspension Characterisation Analyser

The MagnoMeter XRS™ suite of instruments provides unmatched functionality and unparalleled particle suspension characterisation analyser, at any stage of the formulation or manufacture process, across any industry.

Mageleka’s flagship instrument is the MagnoMeter XRS™ RelaxoMeter, a powerful and versatile next-generation benchtop low-field NMR spectrometer that provides fast, accurate, particle suspension characterisation and solid-liquid interface analysis of dispersions and liquid-liquid interface analysis of emulsions. It is ideal for fundamental formulation R&D, rapid QC of incoming raw materials, and QA of final commercial products.

The RelaxoMeter Flow is ideal for use with heterogeneous suspensions where batch sampling is problematic. Use it to monitor milling processes in real time, and under industry-relevant conditions. Also for investigation of the impact of continuous addition of chemical reactants, and for laboratory studies of process control.

The SedimentoMeter is a simple benchtop device for: determining settling/sedimentation rates of slurries, investigating particle aggregation (coagulation/flocculation), and measuring fast or slow kinetic processes and mechanisms. It is ideal for accelerated aging and shelf-storage studies

  • Key Features

    Separate magnet/probe assembly pod

    Easily exchangeable for different nuclei and/or higher field strength magnets

    Highly customizable pulse sequencing

    Phase cycling, composite pulses, two channel RF, and 1D, 2D, and 3D shaped gradients

    Remote operation

    For use in controlled, hazardous, or radioactive environments.

    Uses regular length NMR tubes

    Four diameters available, from 2mm (highest resolution) to 10mm (lowest resolution)

    Simple and intuitive software

    Easy to use and upgrade PC software and a dedicated dual core ARM9 processor running Debian

    All industry relevant concentrations

    Measure materials or products at any stage of the formulation and manufacturing process

  • Applications

    Raw Materials

    Ink-jet

    API Solution

    Pigment Dispersion

    Cosmetics

  • Capabilities

    Separate magnet/sample probe assembly

    The magnet/sample probe assembly – called a MagnoPod™ – is a separate, temperature-controlled unit. This practical feature allows the MagnoMeter XRS™ devices to be operated remotely. Each unit can accommodate multiple MagnoPods™, which adds flexibility and extends the scope of any application. The MagnoMeter XRS™ devices are ideal for use in controlled or hazardous environments, and can be integrated into production equipment. The small footprint saves space in any lab, and the low weight makes it easily portable.

    By direct digital synthesis (DDS)

    At the heart of the MagnoMeter XRS™ is state-of-the-art NMR technology (patent-pending). It features Direct Digital Synthesis, which incorporates a software defined radio device. Radio frequency generation and detection is done digitally; there are no analogue multiplexing steps in detecting the NMR signal. This next-generation technology provides the MagnoMeter XRS™ devices with exceptional resolution of complex solid-liquid and liquid-liquid formulations at any concentration – and at significantly faster speeds than the competition.

    MagnoSoft™: simple and intuitive software

    Measurements using the MagnoMeter XRS™ devices are based on the simple and intuitive MagnoSoft™ program, and operation requires minimal training and expertise. The MagnoSoft™ program can control multiple MagnoPods™ from one central control unit, which adds incredible flexibility and eliminates the need to purchase multiple instruments.

    Highly-customisable pulse sequencing

    The MagnoMeter XRS™ features phase cycling, composite pulses, and two-channel radio frequency and 3D shaped gradients, all customizable by the pulse programming interface of the MagnoSoft™ program. This makes possible 1D, 2D, and 3D imaging, robust self-diffusion measurement (10-9 to 10-13 m2s-1), droplet sizing analysis, polymer characterization in solution and melts, and more.

    Uses regular length NMR tubes

    With the MagnoMeter XRS™ there is no need to change the way you work – or the type of NMR tube you use. It is challenging to fill a narrow NMR tube with a highly viscous fluid, so larger-diameter tubes are needed. Conversely, when sample volume is very low, or higher resolution is needed, a narrow-diameter tube is ideal. Accordingly, the MagnoPod™ can accommodate four different diameter NMR tubes: 2 mm (highest resolution), 4 mm (standard resolution), 8 mm (lower resolution) and 10 mm (lowest resolution).

    Measurements have never been easier

    The MagnoMeter XRS suite of products offers the user a wide degree of flexibilty to meet their individual need. Do you need to measure samples at multiple locations, or analyse multiple nuclei? The MagnoPod™ is easily exchangeable, and convenient additional pods are available for a wide range of nuclei (including 7Li, 19F and 32P). Multiple MagnoPods™ can be connected and driven by one controller, all run by the powerful MagnoSoft™ program. Sometimes the difference between success and failure is a matter of degrees. All MagnoPods™ come standard with a temperature exchanger unit installed. An optional upgrade to a Peltier controlled system is available. Need more resolution? Higher field magnets are available. Talk to us, and we can tailor the MagnoMeter XRS™ to meet your specific needs.

Not sure if it’s the right instrument?

No worries, send us a sample and we will test it for you


Send a sample

Continue reading

HFlow-1

3P Instruments
HFlow-1

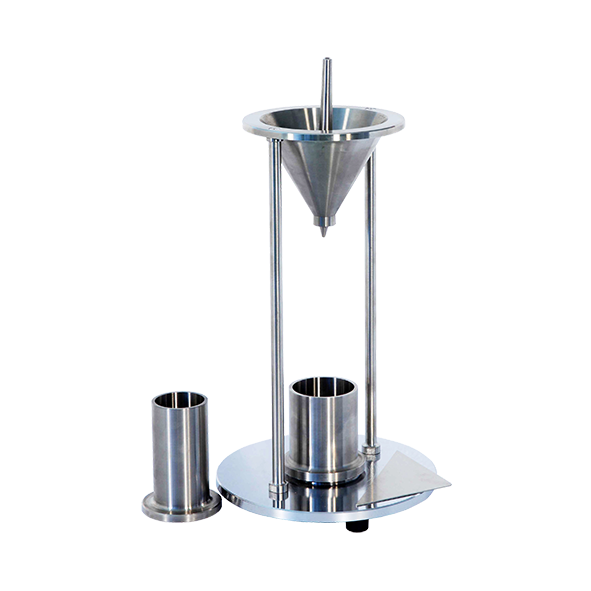
Hall Flowmeter

  • Compliant with ISO 4490, ASTM B213-13
  • Determination of the flowability of metal powders

Download
brochure
   Request
quote

Beckman Coulter LS 13 320 XR Laser Diffraction Particle Size Analyser 21 CFR Part 11

HFlow 1 Hall Flowmeter

Hall flowmeter for the norm compliant determination of the flowability of metal powders

Compliant with ISO 4490, ASTM B213-13

The HFlow 1 flowmeter funnel is a reliable and accurate device to measure bulk density and flow rate in pharmaceutical and metal powders. It allows the sample to flow through a standard Hall funnel, Carney funnel, or Gustavsson funnel, providing precise and reliable measurements of powder flowability. Complied with USP, Ph. Eur., ASTM, and ISO standards, it is ideal for use in laboratories and production facilities working with pharmaceutical and metal powders.

This instrument is crucial for characterizing powder behavior, which is essential for optimizing production processes in industries such as pharmaceuticals, food, cosmetics, and chemicals. By understanding the flow properties of powders, manufacturers can improve product consistency, reduce waste, and enhance overall production efficiency.

The HFlow 1 is designed for ease of use, with a user-friendly interface that simplifies the testing process. Its automated data collection and real-time analysis capabilities enable users to obtain results quickly, streamlining the workflow in laboratory and industrial settings. This efficiency is particularly beneficial in high-throughput environments where time and accuracy are critical.

Features and Benefits

 Measurement: Bulk density and Flow rate

 Technology: Flowmeter Funnel

 Three funnels: Hall (2.5 mm orifice), Carney (5 mm orifice), and Gustavsson (2.5 mm orifice).

Not sure if it’s the right instrument?

No worries, send us a sample and we will test it for you


Send a sample

Continue reading

Moxi Z

Orflo
Moxi Z

Mini Automated Cell Counter Kit

  • Produce repeatable cell counts with >95% accuracy in just 8 seconds
  • Improve downstream results with better quality control
  • Offers Precise Cell Counting
  • Assess cell culture health without reagents or dyes

  • Measure the smallest cells at very high concentrations

Download
brochure
   Request
quote

Beckman Coulter LS 13 320 XR Laser Diffraction Particle Size Analyser 21 CFR Part 11

MOXI Z Mini Automated Cell Counter Kit – Coulter Principle Counts and Sizing. 

The Orflo Moxi Z offers precise cell counting through its advanced Coulter Principle technology and fluorescence-based viability analysis. Its user-friendly interface ensures quick and accurate measurements, making it ideal for research and clinical settings, enhancing cell analysis efficiency with reliable, reproducible results for various applications.

For research Use Only. Not for use in diagnostic procedures.

  • Overview

    Improve downstream results with better quality control.

    Moxi Z is the only automated cell counter that combines the Coulter Principle typically used in high-end cell counters with a patented thin-film sensor technology to allow for highly accurate (> 95%) and repeatable particle counting and sizing for a broad range of cell types – from mammalian cells to cells as small as wine yeast and more. Since today’s workflows demand accurate quality control of samples, determining cell counts precisely has a significant impact on outcomes and downstream costs.

    Produce repeatable, precise cell counting with >95% accuracy in just 8 seconds.

    This ultra-small instrument uses patented microfluidic thin-film cassettes that enable automatic load and measure operation. The resulting single cell volumetric measurements are completely technique-independent. It provides the ideal alternative to the tedious manual counting associated with cytometers, or the inaccurate results associated with image-based automated cell counters (typical accuracies of 75-80%).

    Assess cell culture health without reagents or dyes.

    Moxi Z also automatically reports a unique cell health assessment index – MPI (Moxi Population Index) – without the need for reagents or dyes.MPI is a ratio of the cell population of interest relative to the entire particle distribution in that sample, factoring in dead cells that have shrunken or broken apart as well as other debris and contaminants in the sample. For monodisperse mammalian cultures this is closely correlated to the overall health of the sample.In the case of mixed cell populations, it’s provides an assessment of the relative fraction of the largest sized population in the sample. Unlike staining-based viability methods that focus on the uptake by dead cells and do not account for contaminants and other debris, MPI provides insight on the primary population of interest (based on size) and its relationship to ALL other particles in the sample.

    Measure the smallest cells at very high concentrations.

    Using the new Type S cassette, you can now accurately measure the smallest cells of any automated cell counter (down to 3um average diameter) at concentrations of up to 2.5e+6/ml. This means the new Type S cassette can measure Yeast (including wine yeast) and non-spherical particles down to 14 fL in volume.

    Results in just 8 seconds
    • Ultra-small and ultra-easy to use (no manual counting, no focusing of any kind)
    • Complete, high-resolution cell size/count histogram
    • Handles “de-aggregation” and coincidence events
    • Post-processing/analysis of count distributions with user-adjustable regions/gates
    • Assess cell health (MPI) without the need for reagents like Trypan blue
  • Technical Specs

    Id

    MXZ001

    Included accessories

    Instrument only

    AC power type

    110 VAC

    Applications

    Cell Counting | Cell Size | Cell Health

    Average Cell Diameter Range

    4 – 25 microns Type M | 3 – 20 microns Type S

    Battery Type

    Rechargeable 3.7 V, 4400 mAh lithium ion

    Cassette types

    Type M | Type S

    CE Certification

    Yes

    Cell Particle Concentration Range

    3,000 – 500,000 cells/mL Type M | 3,000 – 1,750,000 cells/mL Type S

    Cell types tested

    HEK-293
    HeLa
    PC12
    CD3+T
    CHO-K1
    Cos-7
    HepG2
    Hybridoma
    Jurkat E6-1
    K562
    MCF7
    Mesenchymal SC
    Monocyte
    Mouse ESC
    NIH 3T3
    PBMC (cultured)
    Red Blood Cells (RBC)
    L5178y
    C. albicans (Yeast)
    S. cerevisiae Vin 13 (Yeast)
    S. cerevisiae X5 (Yeast)
    Wine Yeast (natural fermentaion)
    S.cerevisiae (Baker’s Yeast
    Safale US-05 Yeast

    Data output formats

    .csv format (Orflo MoxiChart or Microsoft Excel)

    In British units

    1.5 lbs

    Intended use statement

    For Research Use Only. Product is not for use in diagnostic procedures

    Measurable dynamic range

    4- 34 microns Type M
    3 -26 microns Type S

    Measurement time

    15 seconds Type S
    10 seconds Type M

    MPI cell health

    Yes

    Number of detection channels flow parameters

    1

    Overall dimensions

    7.6 L x 4.3 W x 2.8 H (in)

    Particle size detection method

    Impedimetric (Coulter Principle)

    Platform

    No

    Pre-programmed tests

    None

    Sample type

    Mammalian Cells|Large Yeast|Large Algae|Protozoa Type M
    Mammalian Cells|Most Yeast|Small Algae|Small Protozoa Type S

    Sample volume

    75 µL

    Supported connectivity

    USB on-the-go; PC or Mac compatible; requires Windows XP, Windows Vista, Windows 7, or Mac OS X operating system

    Useable cell volume

    34 – 20,580 fL Type M
    14 – 4,200 fL Type S

    Weight

    0.68 kg

  • How it works

    Electronic current is passed through a small hole (Cell Sensing Zone) in a thin-film membrane. Cells flow substantially single file through the CSZ causing momentary increases in measured voltage that are directly proportional to cell or particle volume. Thousands of cells are measured during a single test and the size of each cell is plotted and saved in histogram format. Total volumetric counts are determined by precisely measuring the
    volume of fluid being analysed.

    Insert cassette into Moxi Z.

    Pipette 75 μL sample into cassette. Touch Screen.

    Finished! Automatic, hands-free measurement in just 8 seconds.

    Note: Each cassette holds 2 tests. When Sample 1 is complete, simply re-insert other end of cassette into MoxiZ, and load Sample 2.

    Data

    Data For each measurement, a complete histogram is displayed as well as cell count, average cell size and Moxi Population Index. The raw waveform from the most recent cell count, containing each cell spike, is also stored on the Moxi Z and can be both viewed on the Moxi Z and uploaded to the PC for additional analysis. The Moxi Z also performs sophisticated curve fitting analysis to more accurately determine cell counts in the event of overlapping populations of cells (or debris), significantly improving the accuracy of the volumetric counts produced by the Moxi Z. Data for 500 samples may be stored on the unit. All data can be transferred to a PC/Mac via Bluetooth. No special software is required for the PC since date files are Excel®-compatible. Sophisticated PC/Mac compatible analys software is included with each Moxi Z. Cell health may be assessed by comparing differences in histograms from culture to culture.

    Instructional Videos


  • Applications

    Blood Cells

    Monitoring Cell Health

    Algal Growth

    Yeast Monitoring

Not sure if it’s the right instrument?

No worries, send us a sample and we will test it for you


Send a sample

Continue reading

Breakthrough Curves

Technology
Breakthrough Curves

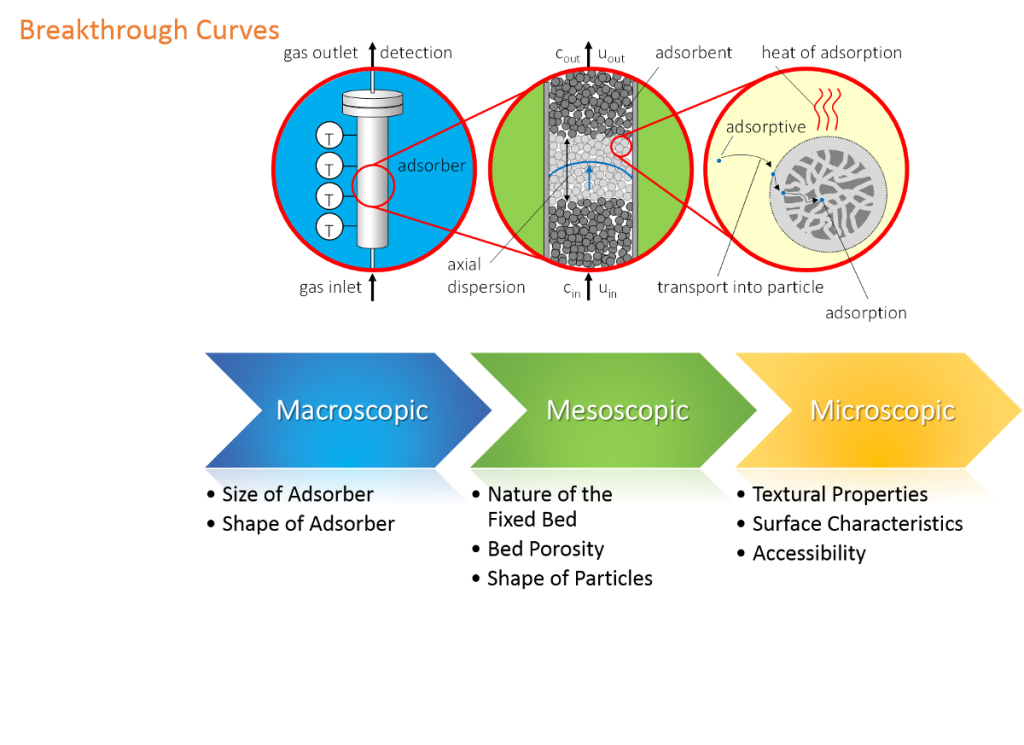
Breakthrough curves: dynamic sorption of gas- and vapor mixtures

Investigation experiments of practically relevant separation processes by standard gas sorption instruments for pore size analysis are limited.

BioLector Microbioreactor

Regarding the assignment of tasks such as

  • investigation of the adsorption of CO2 from dry and wet air
  • adsorption of methane of biogas
  • differentiation of practically relevant sorption behaviour of adsorbents like gas or vapor mixtures.
  • BET- or pore size distribution cannot predict or model separation processes.

The dynamic flow method is applied for practical investigation such as

  • dynamic gas flow adsorption and desorption
  • determination and evaluation of breakthrough curves
  • investigation of sorption kinetics
  • investigation of co-adsorption and replacement effects
  • determination of sorption selectivities
  • determination of sorption equilibria of gas mixtures
  • transfer of technical sorption processes to lab-scale
  • investigation of thermal balance of dynamic adsorption processes

BioLector Microbioreactor

Measuring method

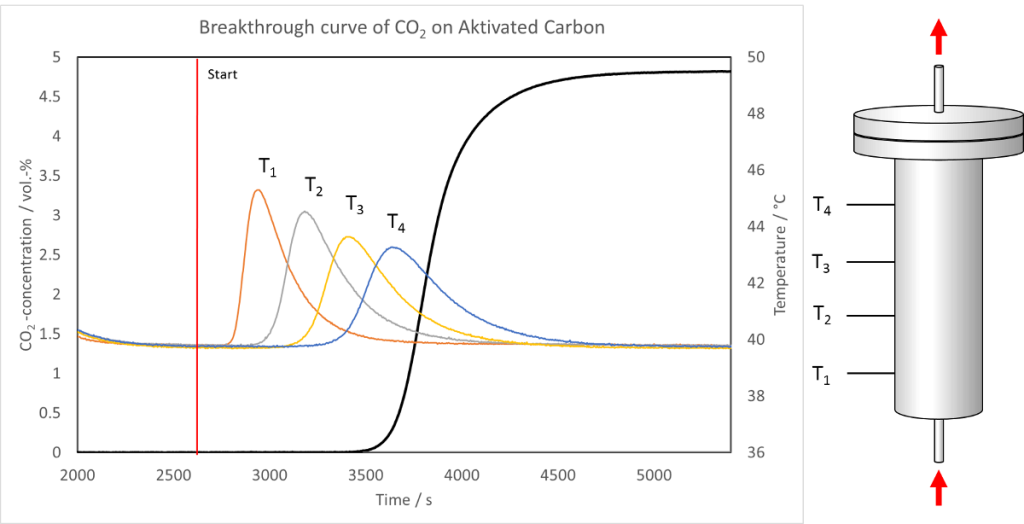
The figure above shows a breakthrough curve of CO2 at activated carbon measured with the mixSorb L. The vertical, red line marks the start of the breakthrough measurement. From this point a gas mixture of 5 Vol.-% CO2 in Helium flows through the adsorbent at a pressure of 5 bar at 40 °C with a flow of 1 L min-1. The black line represents the concentration of CO2 at the end of the adsorber column. One can observe that after 15 minutes traces of CO2 are detected. Before that time CO2 is completely withheld by adsorption on the activated carbon followed by a steep increase of the CO2 concentration, which is called mass transfer zone. From the shape of the breakthrough curve in this zone different parameters concerning sorption kinetics or concentration distribution can easily be determined. After approximately 30 minutes the activated carbon reaches the maximum sorption capacity under this experimental conditions. Consequently the CO2 concentration at the end of the column approaches the initial CO2 concentration.

BioLector Microbioreactor

The releasing heat of sorption results in a temperature increase of the adsorber bed. To follow this process the mixSorb L is equipped with four temperature sensors along the adsorber. Their position is sketched at the right side of the figure. The four sensors respond in accordance to the direction of the gas flow starting with T1 and ends with T4. The measured temperature curves (orange, grey, yellow and blue) are also depicted. They give information of the released heat, the speed of energy exchange processes and the dispersion of the concentration profile in the adsorber column.

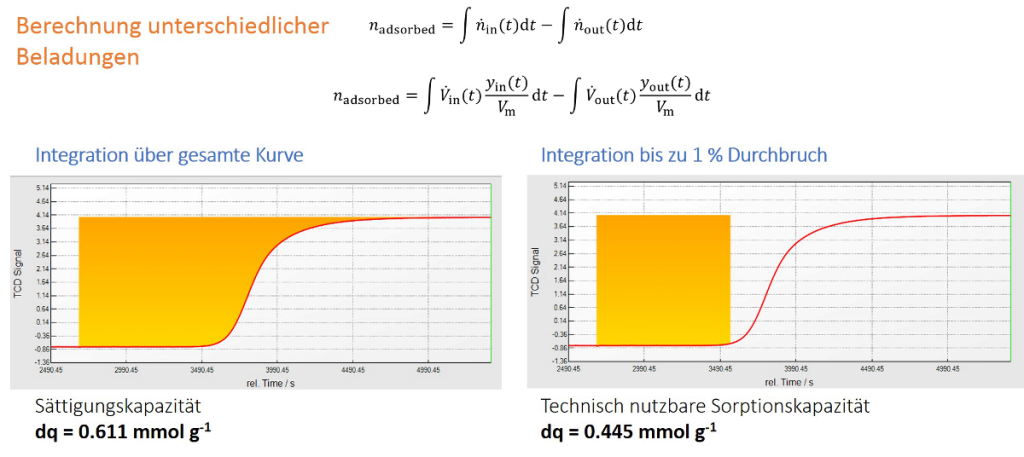
The following figure illustrates how to determine the technical usable sorption capacity from a breakthrough curve under certain experimental conditions. The BET surface area or the micropore volume, which are exactly known by standard gas sorption methods, are not accessible completely in technical flow processes for certain kind of purification or separation processes. As an example: The separation of CO2 from N2 (40 °C, 2 L min-1, 5 bar, initial gas composition: 5% CO2 in N2) occurs with the breakthrough of CO2 when the sorption capacity reaches 75% of the maximum sorption capacity. The dynamic sorption analyzer mixSorb L can help to predict technical relevant sorption processes in an easy a quick way.

BioLector Microbioreactor

Continue reading

Chemisorption

Technology
Chemisorption

Chemisorption

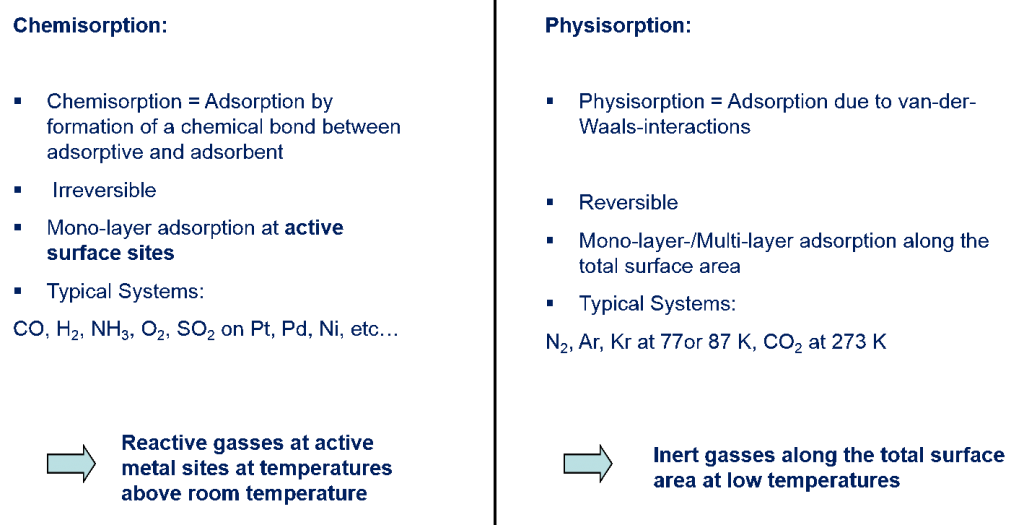
The chemisorption analysis is specially used to characterize catalysts. The most crucial point is to determine the chemically active part of the surface area. To determine the active surface area a measuring gas is used, which is able to strongly chemisorb at the active sites. Hydrogen gas is often used for the analysis, which creates a chemisorption bond to noble metals (e.g. platinum-alumina catalysts).

BioLector Microbioreactor

BioLector Microbioreactor

1. Static-volumetric method

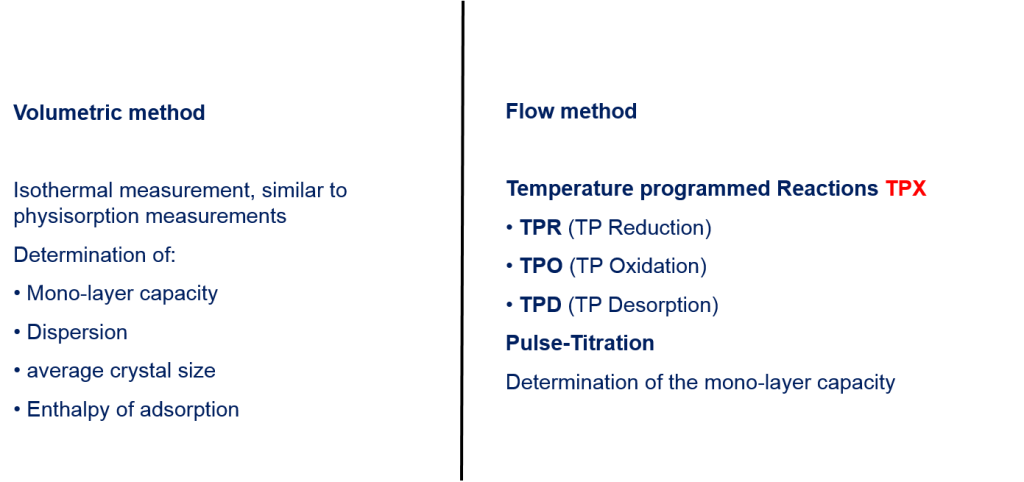
A certain amount of gas is dosed onto the active material in vacuum. The determination of the amount of adsorbed gas is carried out by pressure measurement in a system with known volume. Typically two isotherms are measured during the chemisorption experiment: The first isotherm reflects the sum of physisorption and chemisorption. After that the sample is evacuated to desorb loosely bonded gas molecules (physisorbed measuring gas) from the surface. Repeating the isotherm then only shows the physisorption again due to the blockage of the active sites from the first isotherm. Subtracting the second from the first isotherm only reveals the pure chemisorption. From this isotherm the amount of active sites can be calculated.

BioLector Microbioreactor

2. Dynamic method

2.1. Isotherm (Pulse chemisorption)

An inert gas continuously flows over a solid. A thermal conductivity detector analyses the measuring signal (base line). After that pulses of the measuring gas are added successively into the flow of the inert gas and after each pulse the instrument waits until the signal reaches the base line again. Initially the active material chemisorbs the measuring gas. After a while the actives sites are getting saturated. The measurement is being continued until the thermal conductivity detector shows constant peaks and no measuring gas is chemisorbed any more. This method is called pulse- or titration method.

Chemisorption experiments are often carried out temperature-controlled, please read more at measuring method „temperature-programmed reactions“.

2.2. Temperature-programmed reactions

Non-isothermal measurements are carried out usually through linear heating of a sample and continuous recording the changes of the gas composition. Temperature-controlled reactions can involve desorption (TPD), reduction (TPR), oxidation (TPO) and other relevant reactions for the characterization of catalysts.

BioLector Microbioreactor

Before performing temperature-controlled reactions to characterize catalysts the sample is prepared in-situ. Therefore so-called macros are defined, so that the procedure of the sample preparation is done fully automatically. The further approach is then task-oriented: A TPD experiment starts with the adsorption of active gas on a sample (e.g. by pulse chemisorption) followed by the characterization of the temperature-dependent desorption process. TPR reactions are done using a reducing gas, usually H2, TPO experiments are performed with an oxidizing gas, typically O2.

The experiments are carried out in a gas flow and changes in the gas composition are recorded by the thermal conductivity detector. Before performing an experiment, it has to be considered that not only the gas composition has to change during the reaction, also the thermal conductivity has to change due to ad- and desorbing molecules. In principle gases and vapors can be divided up into two main groups regarding their thermal conductivities:

1. H2, He
2. CO, CO2, Ar, NH3, H2O, Pyridin, N2O etc.

By this classification, the experiments can be easily derived. During a chemisorption reaction a gas/vapor from both group has to be present. Examples:

  • 1. TPR with hydrogen (group 1) needs a carrier gas from group 2, e.g. Argon.
  • 2. TPD of NH3 (group 2) requires a carrier gas from group 1, typically Helium.
  • 3. TPO with Oxygen (group 2) needs a carrier gas from group 1, e.g. Helium.

The advantages of temperature-controlled reactions are not only to determine the active sites of catalysts but also determining on the different strengths of chemically active sites due to the temperature dependence.

Product

Continue reading

Gene Regulation Application Note

Biological
Applications
Gene Regulation

Gene Regulation, Lac Operon / Lac Repressor
(DNA-Protein binding)

The regulation of lac operon (lacO), a set of
Escherichia Coli genes responsible for the lactose
metabolism in the bacteria, by the lac repressor is a
well-studied system in molecular biology. The lac
repressor, a DNA-binding protein (lacl), is key to
controlling the lac operon. The equilibrium
dissociate constant (KD) of this system is estimated
to be in the nM range.

Continue reading

Environmental Waters Application Note

Industrial
Applications
Environmental Waters

On-site testing of RDX in environmental waters

Energetic materials (commonly known as explosives)
such as 1,3,5-trinitroperhydro-1,3,5-triazine (RDX)
(Figure 1) has been used extensively in the
manufacturing of munitions, and accounts for a
large part of the explosive’s contamination at active
and former military installations in various parts of
the world. 1 Most RDX compounds are not
significantly retained by soils and biodegrade very
slowly. As a result, RDX can easily percolate through
the ground to contaminate ground water which
serves as drinking water for surrounding
populations. RDX is not only classified as potentially
carcinogenic, but it can also damage the nervous
system if inhaled or ingested. Hence, continuous
monitoring of RDX levels in ground water would be
ideal for public safety to reduce RDX exposure to the
population and limit its potentially adverse health
effects.

Continue reading

Protein-small Molecule Interaction Application Note

Biological
Applications
Protein-small molecule interaction

Understanding the mechanism of action of
transmembrane (TM) proteins

The CD36 (cluster of differentiation 36) is part of
transmembrane proteins with versatile functions.
Encoded by the CD36 gene, the CD36 protein is
found on the surface of many cell types in
vertebrates. It has various roles in lipid uptake, cell
adhesion and pathogen sensing. As a result, several
diseases related to arterial hypertension, diabetes,
cardiomyopathy are associated with mutation or
misregulation of these transmembrane proteins.

Continue reading

Immunosensing Application Note

Biological
Applications
Immunosensing

Understanding the factors affecting sensing efficiency in SPR
biosensing

Acute lymphoblastic leukemia (ALL) is a disease where
immature white blood cells originated from the bone
marrow become cancerous, inducing proliferation in
the blood flow and subsequently to organs in addition
to prevent the proper function of other blood cells. One
of the main chemotherapeutic agents proven for its
efficacy for ALL is the E. coli L-asparaginase (EcAII) as a
biological therapeutic agent. The challenge with
undergoing such treatment is that the patient can
potentially develop silent inactivation of the biological
chemotherapeutic agent by generating antibodies to
neutralize EcAII and therefore reducing treatment
efficiency.

Continue reading

Antibody QC Application Note

Biological
Applications
Quality Control of Antibodies

Rapid quality control of antibodies using Affinité’s simple
P4SPRTM

The quality control of biopharmaceuticals such as
antibodies must be performed to ensure quality and
safety. For instance, the quality of antibodies is affected
by process parameters such as pH, temperature, CO2,
and cell culture metabolites [1]. Not only should these
biopharmaceuticals be characterized by standard
physicochemical methods such as mass spectrometry,
but their biological activities must also be investigated
as well. This has traditionally been done using endpoint
assays such as Enzyme-Linked Immunosorbent Assays
(ELISA). However, these assays do not provide
kinetic and affinity data. An alternative method is
Surface Plasmon Resonance (SPR). SPR is a powerful
technique to characterize proteins because it is a label
free technique that enables real-time assessment of
protein interactions, and it does not require much
sample preparation.

Continue reading

Protein-Protein Application Note

Biological
Applications
Protein-Protein

Rapid screening of protein-protein interactions

The central dogma of molecular biology stipulates
that DNA is transcribed to RNA, and RNA is
subsequently translated into protein [1] . While the
central dogma adequately encapsulates the field of
molecular biology, protein-protein interactions are
at the heart of virtually every biological process.
While many are familiar with the term genome, the
comprehensive genes of organism, or the term
proteome, the comprehensive proteins expressed
in an organism, fewer are familiar with an
organism’s interactome. In short, the interactome
typically refers to the entire set of protein-protein
interactions (PPIs) in an organism. The importance
of protein-protein interactions, and its central
nature in biological processes, is highlighted by its
role in human diseases.

Continue reading

Protein Application Note

Biological
Applications
Protein

Drug discovery application: Determination of dissociation
constant (KD) between a fragment and a protein

Drug discovery is a long and rigorous process, and
there are many approaches from different branches
of science to find ideal drug candidates. Fragment
based drug discovery has been established as a
strategy to identify small compounds that can be
further developed into leads and clinical candidates
(1, 2). Fragment compounds are typically < 300 Da in size (3), and they are typically screened against a target protein.

Continue reading

Vaccine Application Note

Industrial
Applications
Vaccine Monitoring

Detection of hemagglutinin using Affinité’s P4SPRTM as a
potential platform to monitor production of influenza
vaccine

The influenza vaccine is manufactured each year to
protect people against serious illness that require
hospitalization and reduce the number of
mortalities associated with influenza. Therefore, the
timely production and validation of influenza
vaccine lots are of utmost importance. Each vaccine
lot must be evaluated for potency, which is based on
the amount of the hemagglutinin (HA) content
found on influenza viruses in the vaccine.

Continue reading

ezSPR

Affinite
ezSPR

Benchtop SPR

  • Core technology
  • Flexible design
  • Rapid data processing

Download
brochure
   Request
quote

Beckman Coulter LS 13 320 XR Laser Diffraction Particle Size Analyser 21 CFR Part 11

Core Technology

Basic thin film SPR found in most benchtop devices capable of detection in complex media such as serum, plasma, cell lysates, or wastewater.

Flexible Design

Adaptable from injection to sensor. Comes with two injection models with multiple options to meet your research needs

Rapid Data Processing

Intuitive software providing key data for biosensing and protein interaction characterization in real time.

  • Key Features

    • Thin film-based Kretschmann configuration SPR
    • Switchable manual or sample loop injection mode
    • Two sensing channels
    • Two independent pump with sample injection loops
    • Each loop injection volume 100 micro L
    • Sensitivity: 2750 nm/RIU
    • Resolution : 1 micro RIU
    • Dynamic range: 1.33 to 1.39 refractive index unit
    • Coefficient of variation on signal: < 0.6%
    • Polychromatic light source
    • ezControl™ graphic user interface
    • Output data compatible with TraceDrawer™
  • Applications

    Gene Regulation

    Environmental Waters

    Protein-small molecule interation

    Immunosensing

    Antibody QC

    Protein-Protein

    Protein

    Vaccine

Not sure if it’s the right instrument?

No worries, send us a sample and we will test it for you


Send a sample

  • Name of customer

    Morbi ornare magna nec tortor rutrum interdum. Donec interdum facilisis elit, et iaculis nunc facilisis vitae. Sed quis semper dolor, id efficitur ex.
  • Name of customer

    Morbi ornare magna nec tortor rutrum interdum. Donec interdum facilisis elit, et iaculis nunc facilisis vitae. Sed quis semper dolor, id efficitur ex.
  • Name of customer

    Morbi ornare magna nec tortor rutrum interdum. Donec interdum facilisis elit, et iaculis nunc facilisis vitae. Sed quis semper dolor, id efficitur ex.
  • Name of customer

    Morbi ornare magna nec tortor rutrum interdum. Donec interdum facilisis elit, et iaculis nunc facilisis vitae. Sed quis semper dolor, id efficitur ex.
  • Name of customer

    Morbi ornare magna nec tortor rutrum interdum. Donec interdum facilisis elit, et iaculis nunc facilisis vitae. Sed quis semper dolor, id efficitur ex.
  • Name of customer

    Morbi ornare magna nec tortor rutrum interdum. Donec interdum facilisis elit, et iaculis nunc facilisis vitae. Sed quis semper dolor, id efficitur ex.
  • Name of customer

    Morbi ornare magna nec tortor rutrum interdum. Donec interdum facilisis elit, et iaculis nunc facilisis vitae. Sed quis semper dolor, id efficitur ex.

Continue reading

P4SPR

Affinite
P4SPR

Surface Plasmon Resonance

  • Dual and Quad inlet modules
  • Fast assay development
  • Ideal for intermediate screening

Download
brochure
   Request
quote

Beckman Coulter LS 13 320 XR Laser Diffraction Particle Size Analyser 21 CFR Part 11

The P4SPR utilises Surface Plasmon Resonance (SPR) technology to deliver precise, real-time measurements of molecular interactions. This Surface Plasmon Resonance system is ideal for studying binding kinetics, affinity, and concentrations without the need for labels. By leveraging advanced SPR technology, the P4SPR enhances biosensing accuracy and sensitivity, making it an invaluable tool for research in fields like biochemistry, pharmaceuticals, and material science.

Core Technology 

Basic thin film Surface Plasmon Resonance (SPR) found in most benchtop devices capable of detection in complex media such as serum, plasma, cell lysates, or wastewater.

Flexible Design

Adaptable from injection to sensor. Comes with two injection models with multiple options to meet your research needs

Rapid Data Processing

Intuitive software providing key data for biosensing and protein interaction characterization in real time.

  • Key Features

    • Thin film-based Surface Plasmon Resonance (SPR)
    • Dimensions: 175 x 155 x 55 mm
    • Weight: < 1.3 kg.
    • USB powered
    • Microfluidic cell min. volume: 50 uL
    • Sensitivity: 2750 nm/RIU
    • Resolution : 1 micro RIU
    • Dynamic range: 1.33 to 1.39 refractive index unit
    • Coefficient of variation on signal: < 0.6%
    • Polychromatic light source
    • P4SPR Control™ graphical user interface
    • ezControl graphic user interface
    • Output data compatible with TraceDrawer™
    • CE Marked
  • Dual Inlet Module

    Best for assay development

    • Triplicate sample channel measurement with reference channel
    • Connect to Affinité’s injection loop side module for kinetics analysis
  • Quad Inlet Module

    Best for intermediate screening

    • Simultaneous comparison of four different samples at once.
    • Fewer chip consumable usage.
  • Applications

    Gene Regulation

    Environmental Waters

    Protein-small molecule interaction

    Immunosensing

    Antibody QC

    Protein-Protein

    Protein

    Vaccine

Not sure if it’s the right instrument?

No worries, send us a sample and we will test it for you


Send a sample

Continue reading

Water Treatment

Industry Information
Water Treatment

Why particle characterisation is important in water treatment

Particle characterisation is crucial for designing effective filtration and purification systems. It helps identify particle size, shape, and distribution, enabling the selection of appropriate treatment methods. Accurate characterisation ensures efficient contaminant removal, optimal chemical dosing, reduced operational costs, and compliance with water quality standards.

BET analysis

BET analysis measures surface area of adsorbents in water, optimising the selection and performance of materials for efficient contaminant removal, enhancing purification processes and ensuring water quality.

Case study

A manufacturing plant producing electronics components faced significant challenges with wastewater containing heavy metals like lead (Pb) and cadmium (Cd). Traditional monitoring methods were insufficient for real-time detection and quantification of these contaminants at low concentrations, posing environmental and regulatory compliance risks.

The integration of SPR technology for real-time monitoring of heavy metal contaminants in wastewater demonstrated significant improvements in detection sensitivity, treatment efficiency, and regulatory compliance. This case study highlights the potential of SPR as a vital tool in advanced water treatment systems, ensuring environmental safety and operational efficiency.

Instruments to support the water treatment industry

Applications to support the water treatment industry

Continue reading

Ceramics

Industry Information
Ceramics

Meritics particle characterisation solutions for the Ceramics Industry

Particle characterisation is vital for ceramic industries as it dictates product quality, performance, and processing efficiency.

Particle Size Analysis using Laser Diffraction

Understanding particle size distribution ensures uniformity in properties like strength and shrinkage, crucial for product consistency. Meritics supply particle sizing solutions to customers working with both traditional and advanced ceramics

Particle Shape Analysis using Flow Imaging Microscopy

Particle shape influences packing density and flowability, impacting processing methods and final product properties. Meriitics offer a wide range of shape analysers, we offer stand alone units, modules to compliment your particle sizing and counting instrumentation and sizing instruments with shape analysis built in.

Surface Area Analysis using BET Analysers

Surface area measurement guides in optimising material reactivity and porosity, essential for functionalities like adsorption and catalysis. Meritics offer comprehensive range of surface area analysers.

Case study

We take pride in our reputation for producing high-quality ceramic tiles for both domestic and international markets. However, like any manufacturer, we faced challenges in maintaining consistent quality across our product line despite stringent quality control measures.

Our primary challenge was to reduce defects such as surface imperfections, color variations, and dimensional inconsistencies, which led to increased waste and customer dissatisfaction.

To tackle these challenges head-on, we decided to integrate image analysis technology into our quality control process.

Using Meritics specialist knowledge in particle characterisation instruments we were able to find the best solution to suit our needs. This was a FlowCam 5000, which measures particles in the range of 3 μm to 300 μm

By harnessing the power of image analysis technology, we transformed our quality control process, achieving greater accuracy, efficiency, and cost-effectiveness.

Instruments to support the ceramics industry

Applications to support the ceramics industry

Continue reading

Polymers and Plastics

Industry Information
Polymers and Plastics

Why particle characterisation is important in the polymers and plastics industry

Meritics provides tailored particle characterisation solutions for the polymers and plastics industries, offering advanced techniques such as laser diffraction and flow imaging microscopy to analyse particle size, shape, and distribution. These solutions optimise material performance, processing, and quality control in polymer and plastic manufacturing processes, ensuring product excellence.

Laser diffraction

Laser diffraction particle size analysis enhances polymer and plastic production by accurately measuring particle size distribution, optimising formulations, and improving product performance and quality control processes.

Flow image microscopy

Flow imaging microscopy analysis aids polymer and plastic production by providing real-time visualization of particle characteristics, facilitating process optimisation, and ensuring product quality and consistency.

BET surface area analysis

BET surface area analysis supports polymer and plastic production by accurately measuring surface area, aiding in material characterisation, formulation optimisation, and enhancing product performance and quality control processes.

Viscometry

Using a viscometer in polymer and plastic production enables precise characterisation of material flow and viscoelastic properties, optimising processing parameters and ensuring product consistency and performance.

Case study

As a leading manufacturer of composite materials, ensuring consistent resin quality is essential for our production processes. Dynamic viscosity is a critical parameter influencing resin flow behavior and final product properties.

We encountered challenges in accurately measuring and monitoring changes in the dynamic viscosity of our resin formulations during processing. Variations in viscosity could lead to inconsistencies in product performance and quality.

To address these challenges, we implemented a viscometer as a key tool in our quality control process. This instrument provided real-time monitoring of resin viscosity, allowing us to make adjustments as needed to maintain optimal processing conditions.

Instruments to support the polymers and plastics industry

Applications to support the polymers and plastics industry

Continue reading

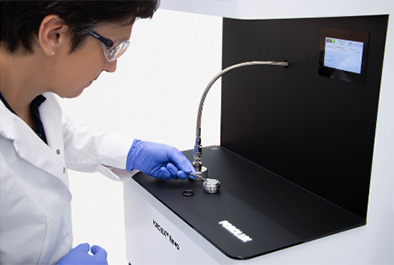
Poroliq

Porometer
Poroliq

Liquid-Liquid Porometer

  • Liquid-liquid technology
  • Designed to measure the smallest pores in the most fragile samples
  • For pore sizes down to 2nm
  • Offers Porosity Measurement

Download
brochure
   Request
quote

Beckman Coulter LS 13 320 XR Laser Diffraction Particle Size Analyser 21 CFR Part 11

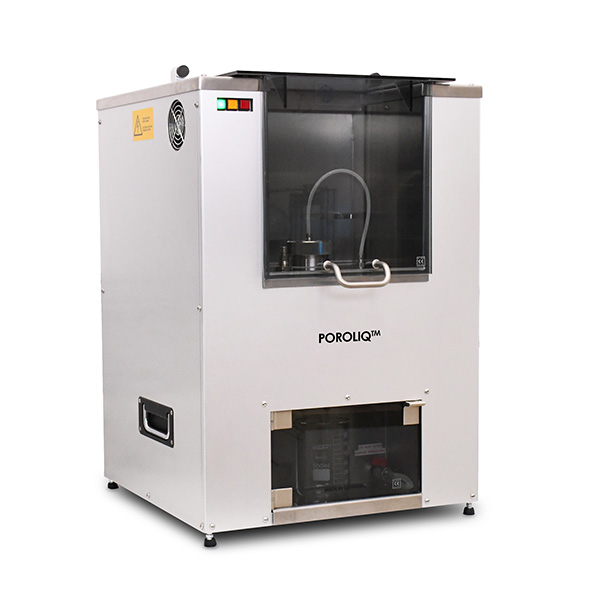
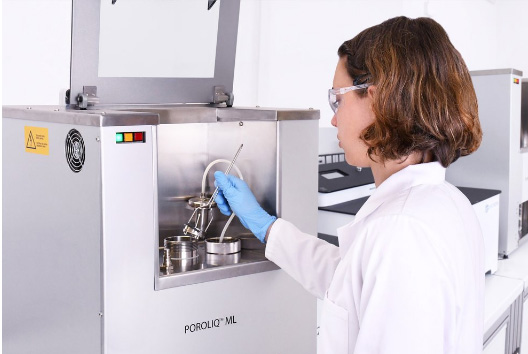
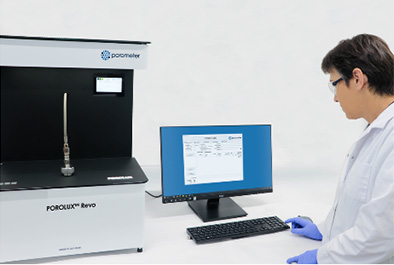
The POROLIQ™ is a liquid-liquid porometer (LLP) that determines pore sizes based on the pressure step stability method. This means that a data point is only accepted on the condition that the user-defined stability algorithms for pressure and flow are met.

The Poroliq provides precise porosity measurement for a wide range of materials, ensuring accurate characterisation of porous structures. This advanced instrument is designed for detailed porosity measurement, including pore size distribution, pore volume, and surface area analysis. Ideal for industries such as pharmaceuticals, materials science, and manufacturing, the Poroliq enhances the understanding of material properties and performance. Its high sensitivity and user-friendly interface make it suitable for both laboratory and industrial applications, ensuring reliable and comprehensive data for quality control, research, and development.

  • Key Features

    Complete and accurate measurements

    The POROLIQ™ – widely regarded as the most accurate liquid-liquid porometer on the market – is very well suited to detect very small pores, as well as to characterize pressure sensitive membranes such as hollow fibers.

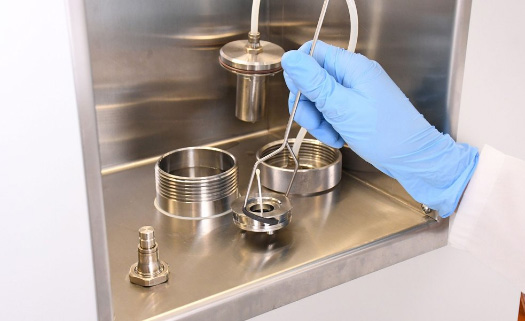
    The instrument will first detect the opening of a pore at a certain pressure but will wait until all pores of the same diameter are completely opened before accepting the data point. This method results in a very accurate pore size measurement, down to 2 nm, and allows to calculate the true pore size distribution.

    Technology and quality combined

    All our porometers are designed and manufactured in-house, enabling us to equip our instruments with the best and latest technology.

    The POROLIQ™ stands out of the crowd with its intelligent sensor switching, making sure that throughout the entire measurement the most suitable sensor is always engaged, resulting in very accurate measurements. Additionally, the Porometer is equipped with a highly advanced, multilevel stability algorithm for characterisation of complex pore structures. A more advanced and representative characterisation of your through pores is not possible!

    Very intuitive and easy to use software

    Even though our software is powerful and comprehensive, it’s also very intuitive and easy to use.

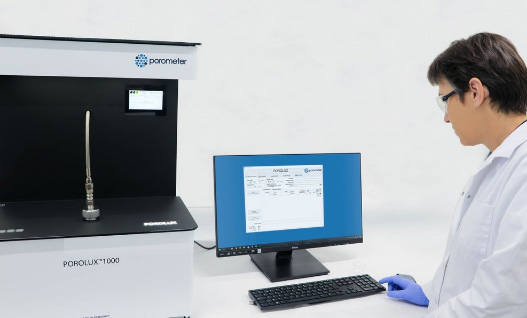
    By allowing to change many parameters with a click of the mouse, the software enables its many users to tune the measurement to their exact needs. Additionally, the software, with built-in intelligence, gives the user access to many advanced functions, such as the re-evaluation function and the observation window.

    Furthermore, our porometers are equipped with an onboard ethernet port allowing remote access via the internet for installation, support, and diagnosis.

    Easily to understand and presentable output

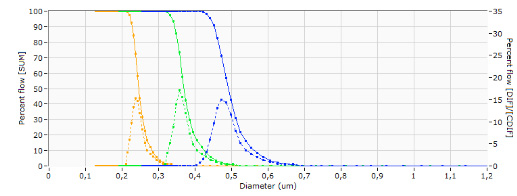
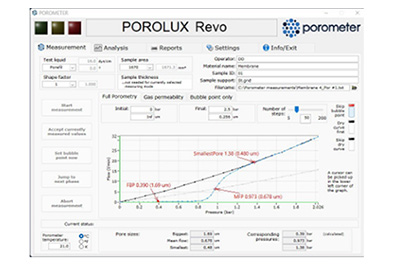
    With one click of the button, results are exported in word, excel or pdf. The Porometer software makes it very easy to present multiple measurements next to each other, allowing for a straightforward comparison between different filter media. Thanks to the adjustable scales, graphs such as wet and dry curve and pore size distribution are presented in a very clear and sophisticated manner.

  • Technical Specs

    POROLIQ™
    AQ ML
    Measurement mode Full porometry Full porometry
    Method Pressure step/stability Pressure step/stability
    Max pressure 40 bar/580 psi 40 bar/580 psi
    Min pore (1) 2 nm 2 nm
    Max pore (1) 0,3 µm 1 µm
    Flow range <1 μl/min – 10 ml/min 1 μl/min – 10 ml/min
    Dimensions (DxWxH) 510x510x760 mm 510x510x760 mm
    Weight 80 kg 80 kg
    Displacement liquid water-based multiple liquids

    (1) depending on the wetting liquid

  • Accessories

    Horizontal hollow fiber sample holder

    Specially designed inlay for 25 mm sample holder for horizontal measurements of hollow fibers.

    Vertical hollow fiber sample holder (picture)

    Specially designed inlay for 25 mm sample holder for vertical measurements of hollow fibers (pack of 5 pcs).

    Deep sample tablet

    Special sample tablet designed to host an inlay and a sample.

    Metal inlay

    For the sample holder for flat sheet sample (inner diameter 4 or 8.8).

  • Applications

    Membranes

    Hollow Fibres

Not sure if it’s the right instrument?

No worries, send us a sample and we will test it for you


Send a sample

Continue reading

Porolux BP

Porometer
Porolux BP

Bubble Point Tester

  • Bubble point measurement only
  • Quick and easy determination of the bubble point
  • For pore size analysis down to 0.1 µm

Download
brochure
   Request
quote

Beckman Coulter LS 13 320 XR Laser Diffraction Particle Size Analyser 21 CFR Part 11

The POROLUX™ BP is a bubble point tester, used to measure the largest pore size – often referred to as ‘bubble point (BP)’ – in media that are used for filtration and separation applications.

The Porolux BP excels in pore size analysis by precisely determining the largest pore size through bubble point measurement. This pore size analysis technique involves assessing the pressure at which gas displaces liquid from the largest pores, providing accurate data on pore structure. Ideal for characterising materials like membranes, filters, and powders, the Porolux BP ensures reliable results for both research and industrial applications. With its advanced technology, the Porolux BP delivers detailed pore size analysis, enhancing material performance evaluation and quality control processes. This makes it an essential tool for accurate and comprehensive pore size analysis.

  • Key Features

    Quick, accurate and reproducible results

    POROLUX™ BP delivers quick and accurate results of the first bubble point in the pressure range from 0 bar (0 psi) up to 5 bar (75 psi) and detects pores from ca. 300 μm down to 0.13 μm.

    Thanks to its simplified operation, the POROLUX™ BP provides highly reproducible results for both the BP x-ml and BP dPL bubble point. This makes the POROLUX™ BP a clear choice for quality control and/or R&D in many companies producing filtration and separation media.

    Full automatic detection of Bubble point

    The ASTM F-316-03 standard defines the BP as ‘the pressure at which the first continuous stream of gas bubbles is detected’.

    While this is based on visual detection, the POROLUX™ BP now offers a fully automated way to determine the bubble point.

    Detection of both BP x-ml and BP dPL

    The POROLUX™ BP can detect both the BP x-ml and BP dPL bubble point. The BP dPL is the bubble point measured as a deviation from the linearity of a user-defined pressure increase, while BP x-ml is the bubble point measured at a user-defined flow rate.

    It is evident that the dPL bubble point generates highly reproducible measurements with correspondingly low scatter. The dPL bubble point is typically very accurate. However, at high pressures, the dPL bubble point can be falsely created by turbulence. In this case, we advise using the BP x-ml.

    The instrument determines the bubble point by using digital pressure and flow sensors. In this way, the chance of a human error or the subjective operator’s opinion is eliminated. This helps to standardize the filter media testing in terms of consistency and reliability.

  • Technical Specs

    Max pressure

    5 bar/75 psi

    Min pore (1)

    0,13 µm

    Max pore (1)

    300 µm

    Max flow

    150ml/min

    Bubble point

    BP x-ml and BP dPL (*)

    Dimensions

    350x400x350 mm

    Weight

    10 kg

    (1) Depending on the wetting liquid.

    (*) BP x-ml is the bubble point measured at a user-defined flow rate. BP dPL is the bubble point measured as a deviation from the linearity of a user-defined pressure increase.

  • Applications

    Membranes

    Nonwovens

Not sure if it’s the right instrument?

No worries, send us a sample and we will test it for you


Send a sample

Continue reading

Porolux Revo

Porometer
Porolux Revo

Porous Materials Analyser

  • Gas-liquid technology with patent pending MP2 technology
  • The most accurate pore size results combined with high resolution
  • For pore sizes down to 13nm

Download
brochure
   Request
quote

Beckman Coulter LS 13 320 XR Laser Diffraction Particle Size Analyser 21 CFR Part 11

The POROLUX™ Revo, the successor of the POROLUX™ 1000, is the revolution in porometry for porous materials. Setting the bar in step stability method with our patent pending MP² (Multistage Pressure Process) technology, the POROLUX™ Revo delivers the most accurate and reproducible pore size measurements, in the highest resolution.

Measuring porous materials with the Porolux Revo provides accurate and detailed insights into pore size and distribution. This advanced analyser utilises cutting-edge technology to assess porosity, including pore volume and surface area. Ideal for materials such as membranes, filters, and powders, the Porolux Revo enhances quality control and research by delivering reliable, high-resolution data. Its user-friendly interface and precise measurements make it an essential tool for thorough porous materials analysis.

  • Key Features

    Patent pending MP² technology

    MP² stands for Multistage Pressure Process. This innovative technology ensures a smooth pressure increase during the measurement and speeds up the process of reaching flow and pressure stability.

    This advanced pressure built-up process makes it possible to do the measurements with smaller, and perfectly uniform pressure steps, leading to the most accurate and reproducible pore size results. Additionally, the technology makes it possible to record more data points in the pore opening region, resulting in more detailed pore size distribution curves.

    Step stability method

    The POROLUX™ Revo detects the opening of a pore at a certain pressure and waits until all pores of the same diameter are completely opened before accepting the data point. This method results in a very accurate pore size measurement and allows to calculate the true pore size distribution.

    Additionally, the instrument can determine the bubble point in three different ways (largest pore according to ASTM F-316-03), a very unique feature in the market of porometry.

    Next to that, results on mean flow pore size, smallest pore, pore size distribution, cumulative flow distribution & gas permeability are reported. With our enhanced mathematical model, we can also obtain additional results such as total pore number and total pore area.

    Very intuitive and easy to use software

    Not only is the fully integrated software powerful and comprehensive, it is also very intuitive and easy to use.

    By allowing to change many parameters with a click of the mouse, the software enables its many users to tune the measurement to their exact needs. Additionally, the software, with built-in intelligence, gives the user access to many advanced functions, such as the re-evaluation function and the observation window.

    Last but not least, the POROLUX™ Revo software comes with a very advanced curve smoothing and fitting function.

    Straightforward and presentable output

    With one click of the button, results are exported in word, excel or pdf. The Porometer software makes it very easy to present multiple measurements next to each other, allowing for a straightforward comparison between different filter media.

    Thanks to the adjustable scales, graphs such as wet and dry curve and pore size distribution are presented in a very clear and sophisticated manner.

  • Technical Specs

    POROLUX™ Revo
    Technique Gas-liquid porometry
    Measurement method Pressure step/stability with patent pending MP² technology
    Max pressure 35 bar/500 psi
    Min pore (1) 13 nm
    Max pore (1) 500 µm
    Max flow 200 l/min
    Bubble point BP dPL, BP x-ml, BP pCF (*)
    Dimensions (DxWxH) 530x530x755 mm
    Weight 70 kg

    (1) Depending on the wetting liquid.

    (*) BP dPL is the bubble point measured as a deviation from the linearity of a user-defined pressure increase. BP x-ml is the bubble point measured at a user-defined flow rate. BP pCF is the bubble point measured as a user-defined percentage of the cumulative flow.

  • Accessories

    Universal sample holder 3 in 1

    Sample holder 3 diameters in 1 (13, 25 and 47 mm).

    Hollow fibre sample holder

    Specially designed sample holder for hollow fibres, including 5 sealant rings.

    Sample holder of 25 mm diameter for thicker samples

    External sample holder for samples of thickness up to 10 mm.

    Customer specific solutions

    Porometer can also create customer specific sample holders to meet special requirements, such as measuring thick samples, samples with larger diameters, working with assembled filter setups, etc.

    Advanced liquid permeability

    The liquid permeability extension performs a fully automatic measurement of the flow of liquid through a membrane or filter at a predefined pressure. The liquid is then collected in a receptacle and the weight data – which is recorded by the balance – is automatically transferred to the operating software, which calculates the liquid permeability.

    This method is user friendly, very accurate and is strongly recommended when a lot of liquid permeability measurements are envisaged. The advanced liquid permeability extension consists of a hardware extension – including the liquid tank, an external sample holder, a balance and all tubing and connections, as well as a software extension.

  • Applications

    Membranes

    Ceramics

    Metals

    Hollow Fibres

Not sure if it’s the right instrument?

No worries, send us a sample and we will test it for you


Send a sample

Continue reading

Paper Application Note

Industrial
Applications
Paper Porolux

Paper

Filter paper is a semi-permeable paper barrier permeable to one or more components of a suspension and impermeable to others. The raw materials for filter paper production are different paper pulps, which can be made of softwood, hardwood, fibre crops and mineral fibres. Paper or wet-laid fibrous media is used for different filtration applications, mainly in laboratories or industrial applications.

The POROLUX™ Cito series is the ideal porometer to measure your paper filters. It guarantees not only fast & reproducible results, but also an easy software interface and a straightforward way of presenting the results.

  • Product

  • Industry

Continue reading

Hollow Fibres Application Note

Industrial
Applications
Follow Fibres Porolux

Hollow Fibre Membranes

Hollow fiber filters are used in many different filtration applications, and determining the pore sizes is of crucial importance. An extra challenge is that hollow fiber membranes are often delicate and subject to stretching, deformation, and even rupture. Therefore, selecting the proper instrument to properly measure your hollow fiber membrane is key.

The POROLUX™ and POROLIQ™ series are the reference for hollow fiber measurements. Our customers appreciate the technology and ease of use of the instruments, but above all that we can recommend the best technique to measure their hollow fibers.

Additionally, our specially designed sample holder allows for easy adaptation and testing of fibers of various internal and external diameters.

  • Product

  • Industry

Continue reading

Metals Application Note

Industrial
Applications
Metals Porolux

Metals

Metal-based filter media are available in many different shapes and structures. They are very often used in filtration and separation applications because of their high temperature and corrosion resistance, high porosity and permeability, as well as their high mechanical strength and durability. The characteristics of the pore structure, such as pore sizes and pore size distribution, govern the filtration properties of all filter media.

The pore sizes and pore size distribution of metal-based filter media are easily measured with our gas-liquid POROLUX™ porometers.

  • Product

  • Industry

Continue reading

Ceramics Application Note

Industrial
Applications
Ceramics Porolux

Ceramics

Ceramic filters are usually hard and rough in surface but porous inside the structure. Porous ceramic tubes, sheets, membranes, etc., have long been used for various industrial applications. Such materials have great resistance to thermal and physical shock, low-pressure drop, and weight. Therefore, they are indispensable in many filtration applications.

Our porometers can determine the pore sizes in porous ceramic media made in any form. If the POROLUX™ cannot measure it, no instrument can.

  • Products

  • Industry

Continue reading

Nonwovens Application Note

Industrial
Applications
Nonwovens Porolux

Nonwovens

Nonwovens are very commonly used as filtration media. Typical examples are air-conditioning, masks, water purification, blood filtration, pharmaceutical filtrations, and many others.

Nonwovens are often characterized by how they are produced (spunbond, meltblown, etc) and their weight, leading to differences in strength and durability. But also the pore sizes are an influential factor in selecting the most suitable nonwoven for the different filtration requirements.

Capillary flow porometry is an easy and straightforward way to characterize the pores in nonwoven filter media. On top of that, our porometers generate fast & reproducible results. Especially our POROLUX™ Cito L is a well established instrument within the nonwoven media industry.

  • Product

  • Industry

Continue reading

Membranes Application Note

Industrial
Applications
Membranes Porolux

Polymeric membranes

Polymeric membranes are widely used in many filtration processes. The degree of selectivity of a membrane depends, amongst others, on the membrane pore size and pore size distribution. Therefore, the correct determination of pore sizes and pore size distribution is vital.

Gas-liquid and liquid-liquid porometry are exceptionally well suited for measuring polymeric membranes. Both flat sheets and hollow fibres membranes can easily be analysed with these techniques. Given its accurate determination and correct representation of pore sizes, it’s no wonder that our POROLUX™ and POROLIQ™ porometers are the most wanted brand in membrane labs worldwide.

  • Products

  • Industry

Continue reading

Porolux Cito

Porometer
Porolux Cito

Pore Size Analyser 

  • Gas-liquid technology
  • Designed to deliver fast and reproducible results
  • For pore sizes down to 13 nm

Download
brochure
   Request
quote

Beckman Coulter LS 13 320 XR Laser Diffraction Particle Size Analyser 21 CFR Part 11

The POROLUX™ Cito series are gas-liquid porometers (GLP) that determine pore sizes based on the pressure scan method. This is a fast, yet reproducible method whereby air pressure is continually increased while the resulting flow rates are recorded simultaneously.

The Porolux Cito Pore Size Analyser offers precise pore size analysis, delivering accurate measurements of pore volume and distribution. As a leading pore size analyser, it is designed for rapid and reliable characterisation of various materials. This pore size analyser ensures detailed insights into material properties, making it essential for applications in research and quality control. Its advanced technology and user-friendly interface make the Porolux Cito an indispensable tool for comprehensive pore size analysis.

  • Key Features

    Fast, reliable and reproducible measurements

    Our POROLUX™ Cito technology stands for fast and reproducible measurements of through pores in filtration and separation media.

    The instruments determine the first bubble point (largest pore-ASTM F-316), mean flow pore size, smallest pore, pore size distribution,cumulative flow distribution & gas permeability with the highest accuracy in the whole pressure range.

    Measurement after measurement, our porometers get you the most accurate and reliable results on the pore sizes of your materials.

    Technology and quality combined

    The POROLUX™ Cito series stands out of the crowd with its intelligent sensor switching. This ensures that the most suitable sensor is always engaged throughout the entire measurement.

    As a result, very accurate measurements are obtained. Additionally, the porometers allow taking up to 400 real (measured) data points, resulting in the best possible resolution.

    Very intuitive and easy to use software

    Even though our software is powerful and comprehensive, it’s also very intuitive and easy to use.

    By allowing to change many parameters with a click of the mouse, the software enables its many users to tune the measurement to their exact needs. Additionally, the software, with built-in intelligence, gives the user access to many advanced functions, such as the re-evaluation function and the observation window.

    Furthermore, our porometers are equipped with an onboard ethernet port allowing remote access via the internet for installation, support, and diagnosis.

    Easily to understand and presentable output

    With one click of the button, results are exported in word, excel or pdf. The Porometer software makes it very easy to present multiple measurements next to each other, allowing for a straightforward comparison between different filter media.

    Thanks to the adjustable scales, graphs such as wet and dry curve and pore size distribution are presented in a very clear and sophisticated manner.

  • Technical Specs

    POROLUX™ Cito
    Cito L Cito M Cito
    Technique Gas-liquid porometry Gas-liquid porometry Gas-liquid porometry
    Measurement method Pressure Scan Pressure Scan Pressure Scan
    Max pressure 1.5 bar/22 psi 7 bar/100 psi 35 bar/500 psi
    Min pore (1) 0.427 µm 0.091 µm 13 nm
    Max pore (1) 500 µm 500 µm 500 µm
    Max flow 200 l/min 200 l/min 200 l/min
    Bubble point BP x-ml and BP pCF (*) BP x-ml and BP pCF (*) BP x-ml and BP pCF (*)
    Dimensions (DxWxH) 530x530x560 mm 530x530x560 mm 530x530x560 mm
    Weight 30 kg 30 kg 35 kg

    (1) Depending on the wetting liquid.

    (*) BP x-ml is the bubble point measured at a user-defined flow rate. BP pCF is the bubble point measured as a user-defined percentage of the cumulative flow.

  • Accessories

    Universal sample holder 3 in 1

    Sample holder 3 diameters in 1 (13, 25 and 47 mm).

    Hollow fibre sample holder

    Specially designed sample holder for hollow fibres, including 5 sealant rings.

    Sample holder of 25 mm diameter for thicker samples

    External sample holder for samples of thickness up to 10 mm.

    Customer specific solutions

    Porometer can also create customer specific sample holders to meet special requirements, such as measuring thick samples, samples with larger diameters, working with assembled filter setups, etc.

  • Applications

    Membranes

    Nonwovens

    Ceramics

    Metals

    Paper

Not sure if it’s the right instrument?

No worries, send us a sample and we will test it for you


Send a sample

Continue reading

Extracellular Vesicles Application Note

Enhanced Characterization of Fluorescently Labelled Extracellular Vesicles using ViewSizer 3000

Biological
Applications
Extracellular Vesicles ViewSizer 3000

Enhanced Characterisation of Fluorescently Labelled Extracellular Vesicles using ViewSizer 3000

Exosomes are small extracellular vesicles (EVs), 30-150 nm in diameter, which have been determined to play a crucial role in extracellular signaling. They have been observed in both prokaryotic and eukaryotic organisms, meaning they are incredibly widely spread in nature. Exosomes bud off from their parent cells in a sealed package, taking the properties of their parent cell walls with them and encasing many intracellular components. A wide variety of bioactive markers have been found encased in exosomes including but not limited to proteins, lipids, DNA, and RNA. Upon formation, exosomes are released into the extracellular space and have been found in many body fluids including: blood, urine, saliva, and breast milk.

The diversity of this cargo has led to exosomes having a litany of roles within the body including but not limited to: immune regulation, tissue regeneration, cancer progression, and neurodegenerative diseases. This application note examines how the ViewSizer is an excellent tool for characterizing the size and concentration of EVs and that it can detect labeled populations of fluorescently tagged exosomes with high repeatability and accuracy.

Continue reading

Drinking Water Application Note

Quantifying Trace Amount of Nanoparticles in Drinking Water

Industrial
Applications
Drinking Water

Quantifying Trace Amount of Nanoparticles in Drinking Water

Plastic is a type of material that is resistant to degradation and is practically indestructible. While plastic will break down into fragments and fragments will become microplastics (1 µm to 5 mm*) and become nanoplastics via photo-oxidative mechanisms, plastic fundamentally remains the same throughout the process. Nanoparticles can gain access through inhalation, ingestion, or dermal exposure and have greater cellular uptake than those bigger in size. Nanoparticles subsequently pose a greater impact on health. The concern of water contamination from nanoplastics (≤ 1 µm) is, therefore, a study receiving close scrutiny from FDA and EPA alike.

* Size-based nomenclature per Section 116376 of the State of California Health and Safety Code

One of the proven methods of tackling microplastics applications is the use of Raman spectroscopy. Raman spectroscopy allows chemical identification of organic and inorganic particles, giving clues to the origins of the plastic. When Raman is coupled with ParticleFinder, the subsampling of microplastics by particle size and shape can be automated well within the software. HORIBA Scientific offers a microplastics solution; click to read the latest development and academic collaboration on Microplastics Analysis.

Particles smaller than 1 µm, however, are tedious and difficult to quantify using spectroscopy or other traditional techniques. In a recent publication, Yang et al used the ViewSizer 3000 multispectral Nanoparticle Tracking Analysis (m NTA) technique to study transport of microplastics from ocean to atmosphere via sea spray aerosolization. The experiment utilized m NTA’s ability to accurately count particles in a complex environmental matrix, and in so doing, refuted the popular belief that ocean contributes to the majority of plastic in air.

While counting only plastic nanoparticles among all other materials in water is still an application in progress involving proper particle staining procedure, here we offer examples of nanoparticle counts in three drinking water sources:

  • Home reverse osmosis filtered water (where water is forced through membranes to remove impurities) collected in a glass vial
  • 365 Everyday Value purified water (plastic bottle)
  • Icelandic Glacial spring water (plastic bottle)

The analysis workflow is straightforward. 500 µL of water was transferred directly from the source to the measurement cell. Three simultaneous operating lasers (635 nm, 520 nm, 445 nm) were then used to collect and track particles until a statistically significant number of particles were collected over 50 videos or approximately 30 minutes. The analyses below are average results of triplicates. It demonstrated that although bottled water is marketed as cleaner and superior, the data beg to differ. Home RO water shows the lowest nanoparticle count overall compared to its similarly filtered water from 365 Everyday Value. Icelandic Spring Water contains the highest number of particles per mL.

  • Product

  • Industry

Continue reading

Protein Therapeutics Application Note

Characterization of Sub-Visible Particles in Protein Therapeutic Formulations

Biological
Applications
Protien Therapeutics
ViewSizer 3000

Characterisation of Sub-Visible Particles in Protein Therapeutic Formulations

The ViewSizer™ 3000 enables scientists to visualize and quantify the kinetics of protein aggregation in real-time for biologic therapeutics under a variety of stress conditions including agitation, temperature and the addition of contaminants. The case study featured here validates these capabilities for agitation and temperature stress conditions with the 100 mg/mL mAb A. These insights support the development of stable, effective and safe biologic products.

Continue reading

Exosomes Application Note

Size Distribution and Concentration of Exosomes

Biological
Applications
Exosomes ViewSizer 3000

Size Distribution and Concentration of Exosomes

In this study, we demonstrate the ViewSizer 3000’s capabilities as a next generation NTA based analysis instrument in order to accurately and efficiently measure and characterize exosomes via particle size and concentration.

It tracks particle Brownian motion. Distinct from the conventional NTA systems that uses one laser (one wavelength) to illuminate particles in the colloid, the ViewSizer 3000 instrument includes a patented system of three solid-state lasers with wavelengths of 445 nm, 520 nm, and 635 nm. Due to the range of laser powers used, varying the power a wider range of particle sizes in the same sample can be analyzed. The combination of the 3 lasers overcomes the common drawback of conventional NTA which is the failure to size particles accurately in a polydisperse sample.

Continue reading

Protein Aggregation Application Note

Accurate Protein Aggregation Analysis

Biological
Applications
Protein Aggregation

Accurate Protein Aggregation Analysis

Protein aggregation is an important concern when developing and manufacturing biotherapeutics since these subvisible aggregate particles have been associated with the adverse drug reactions. Protein aggregates may provoke adverse events through an unwanted immune response. And, regardless of mechanism of reaction, subvisible particle contamination has been a concern for manufacturers and regulators.

Therefore, it is important to quantify protein aggregation and particle formulation due to various stresses such as temperature, shear, high concentration and time. Values for particle concentration and size distribution allow direct comparison of samples and treatments. Such data is needed to guide formulation development, evaluate handling requirements, and monitor product quality.

Continue reading

Powder Metallurgy Application Note

Optimization of High-Performance Nanostructured Powder Metallurgy Materials

Industrial
Applications
Metal Powders ViewSizer 3000

Optimization of High-Performance Nanostructured Powder Metallurgy Materials

In this note, we will briefly explore the history of powder metallurgy and then examine the importance of powder quality to the production of nanomaterials. Using a case study from the Vecchio lab at the University of California, San Diego, we will highlight the necessity of accurate particle sizing in the production of nanoparticles by spark erosion. Data from the ViewSizer 3000 indicates that particle quality and process control can be heavily reliant on capacitance charge, and that the choice of liquid dielectric has a significant impact on the resulting size distribution.

Continue reading

Whiskey Shelf Stability Application Note

Predicting Whiskey Shelf Stability with Particle Size Distribution

Industrial
Applications
Whiskey ViewSizer 3000

Predicting Whiskey Shelf Stability with Particle Size Distribution

Careful control of the particulates in whiskey is an important step to quality flavor and color. Inadequate monitoring of particle size impedes the final product stability, consistency, quality, and price. In this note, the particle science behind these determining factors will be thoroughly examined and explained.

Continue reading

Emulsion Polymerisation Application Note

Optimization of an Emulsion Polymerization Process and Product Through Nanoparticle Concentration Analysis

Industrial
Applications
Emusion ViewSizer 3000

Optimization of an Emulsion Polymerization Process and Product Through Nanoparticle Concentration Analysis

This note covers the history, theory and processes used for emulsion polymerization. It also examines the importance of measuring the concentration of latex nanoparticles produced by emulsion polymerization for a biotech application developed by the Gianneschi lab at UCSD. The Gianneschi case study includes data from HORIBA’s ViewSizer 3000.

Continue reading

Infections Titer Application Note

Achieving Infectious Titer with Multi-laser Nanoparticle Tracking Analysis (NTA)

Biological
Applications
Infectious Titer ViewSizer 3000

Achieving Infectious Titer with Multi-laser Nanoparticle Tracking Analysis (NTA)

The viral vector market became highly active after the launch of a number of Advanced Therapy Medicinal Products (ATMPs). Based on the number of cases in clinical trials and its success rate to date of this writing, we can likely anticipate a cascade of FDA-approved products within years.

The complexity of viral particles remains one of the biggest hurdles in the development process. In this note, the upstream process of analyzing viral preparations is addressed, as well as the use of multi-laser nanoparticle tracking analysis (NTA) as a cost and time efficient method to measure size, count virus particles, and correlate to infectious titer.

Continue reading

Vaccine Manufacturing Application Note

Industrial
Applications
Vaccine Manufacuring
ViewSizer 3000

Particle Analysis in Vaccine Manufacturing and Development

One Size Doesn’t Fit All

Size matters in vaccine delivery systems. Nanoparticles smaller than 200 nm generally present a greater immunogenic response than micro-particles larger than 1 micron. This rather simple statement is based on the common understanding that particles with sizes resembling the dimensions of viruses are treated like viruses by the body. In the case of manufacturing for novel COVID-19 vaccine, adenovirus around the same size as SARS-Cov-2 (median of roughly 90-100 nanometers) are manipulated as carriers (or viral vectors) to trigger spike proteins production. In contrast, published literature showed that the effect of vaccines given orally, intranasally, or via other mucosal surfaces favor micro- over nanoparticulate formulations due to higher antigen load. The size of the impurities also significantly affects vaccine efficacy. In sum, many vaccine formulation ingredients should have controlled particulate size, size distribution, and count throughout the process of development, manufacturing, storage, and administration.

Vaccine Commercial Production

The upstream process of vaccine preparations requires careful virus characterization to achieve optimized infectivity and stability. Infectious titers are used to determine the concentration of viral particles that can transduce cells and its virus load in a sample. Two established analytical techniques to measure infectious titers are:

  • Viral Plaque Assay (VPA)
  • Quantitative Polymerase Chain Reaction (qPCR)

Both approaches quantify the amount of virus present in a solution. Viral Plaque Assay for lentivirus, for example, takes up to two weeks of incubation time to determine its result in a form of Plaque Forming Units (PFU) per mL. The counting of PFU is also subjective, resulting in low reproducibility from one analyst to another. qPCR, on the other hand, does not discriminate between whole, broken, empty, aggregates, infectious or non-infectious viruses; it merely determines relative viral gene expression and correlates the value back to PFU. The drawback is that the qPCR requires prior knowledge of the viral genome sequence, can be costly, and analyzes concentration of genomic material, not infectious virus since uncoated RNA or DNA may exist in a sample, but, without a coat, be unable to enter a cell.
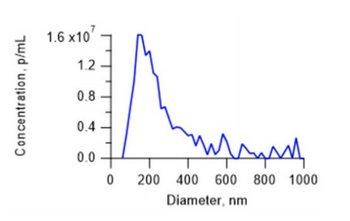
Figure 1: Measurement result of a human viral vector sample. Note the distribution displayed presence of both host cell debris and aggregates.

Particle concentration analysis results from ViewSizer 3000™ multi-laser Nanoparticle Tracking Analysis (NTA) correlate with PFU, similar to qPCR. Due to three simultaneous operating lasers, it quantifies not only the intact viral particles but also infectious aggregates. Figure 1 demonstrates the measured size distribution of a sample of human viral vector, a virus candidate used in vaccine manufacturing. Note the significant population of larger particles.

Download Application Note 1: Achieving Infectious Titer with multi-laser Nanoparticle Tracking Analysis (NTA) on the right hand side

The ability to effectively analyze the entire size range allows the ViewSizer 3000 to successfully correlate known infectious titer to the total particle concentration with a R2 value of greater than 0.9, proving the multi-laser NTA technique a new, cost-effective and time-efficient alternative to VPA and qPCR.

Figure 2: Infectious titer correlation.

Viruses and Virus-Like-Particles (VLP)

Virus-like particles (VLP) are meant to mimic the virus of interest to provoke a therapeutic effect (such as immunity) without the expense of virus or risk of infection. They have been the focus of countless investigations on innovative vaccines. The size of VLPs is similar to that of viruses, which typically ranges from a few tens to a few hundred nanometers. Laser diffraction is an ensemble technique that allows quick, routine analysis. The technique is also fundamentally more sensitive to larger particles such as contaminants. Depending on how the VLP is manufactured, fragments of starting material will likely be present in the sample at larger sizes than the VLP itself. This arises when materials (such as emulsions) are prepared with a large or broad size distribution and then the size reduced to produce a final product. Remaining large particles can lead or unwanted immune response or issues with filtration in subsequent processing (such as filtration sterilization). To analyze viruses and VLP alike, it is essential a technique covers a wide dynamic particle range.

An example size result (below Figure 3) shows three separate populations. The finest (smallest particle size) population is the VLP itself. The remaining populations (with diameters over about 1 micron) are starting material that has not yet been sheared or otherwise milled to finer sizes. The LA-960 can report size metrics for the entire population as well as metrics for each individual population using the Multimodal Report.
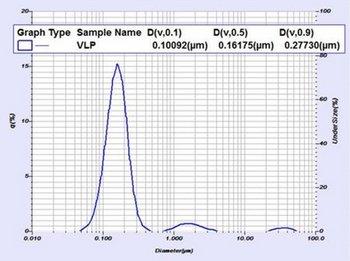
Figure 3: Particle size distribution and results for a VLP material as measured by the LA-960. This sample shows three separate populations. The finest (smallest particle size) population is the VLP itself. The remaining populations (with diameters over about 1 micron) are starting material that has not yet been sheared or otherwise milled to finer sizes.

Exosomes for a New Generation Vaccine

A subgroup of extracellular vesicles (EV) known as exosomes play an increasingly important and intricate role in diagnosis and treatments of various diseases. They are responsible for transferring genetic material and cell-to-cell communication by carrying various nucleic acids, including RNA, lipids and proteins. Its immunogenic properties reportedly correlate with the amount of associated antigens, according to many published reports, thus, creating an opportunity for potential vaccine development.

Exosome particle size and concentration are especially scrutinized as they present important clinical information. To date, however, EV research still lacks standardization for its purification process. It also have been limited by the analytical technologies used to measure them. It is well understood, however, that EVs are a heterogeneous group of particles with a range of sizes and biogenesis; the size distribution are expected to be wide, even after processing.

The ViewSizer 3000 features three simultaneous operating lasers at 635 nm (red), 520 nm (green), 445 (blue) and a color camera to accurately visualize particles of large dynamic range. It overcomes the common drawback of conventional NTA, which is the failure to size particles accurately in a polydisperse sample. Human Preadipocyte (Mesenchymal Stem Cell) Exosomes (100 ug) samples acquired from ZenBio was measured using the ViewSizer 3000. The result was validated by a tunable resistive plug sensing technique and showed a profile with D50 particle diameter of 148 nm and total particle concentration of 5.7 x 10⁷ particles/mL.
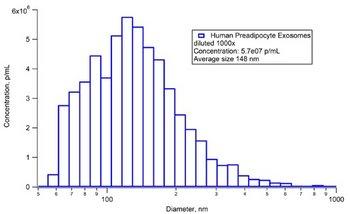
Figure 4: Particle size and concentration distribution of exosome.

Download Application Note 2: Particle Size Distribution and Concentration of Exosomes

Conclusions

Viruses, VLP’s (such as adjuvants) and exosomes can be analyzed for size and concentration using a multi-laser nanoparticle tracking analysis (NTA) instrument, the ViewSizer 3000. Most samples show a wide size distribution that frustrates single laser NTA. If only size distribution is needed, such as in a size reduction process, laser diffraction has also proven useful.

Continue reading

Single and Multi-point comparison Application Note

Comparison of Single-Point and Multi-Point Surface Area Measurements BET

Industrial
Applications
Single- and multi-point comparison

Comparison of Single-Point and Multi-Point Surface Area Measurements

The Flowing Gas Technique for determining BET Surface Area has been in use for over 70 years. Many facets of the technology make it a very attractive alternative to the Static-Volumetric approach.

First and foremost is the fact that the detection is done by measuring a gas concentration difference instead of an absolute pressure. Difference measurements are typically more accurate than many absolute measurements.

The speed of analysis and the resulting high sample throughput is also quite attractive. As a result, for routine QA/QC analysis, there has been a renewal of interest in this technique.

Continue reading

Surface Area Standards

Measuring Low Specific Surface Area Standards with the SA-9600

Industrial
Applications
Low Specific Surface Area Standards
Horiba SA-9600

Measuring Low Specific Surface Area Standards with the SA-9600

A feasibility study to measure low specific surface areas with the SA-9600 Series was performed using Certified Reference Materials BCR 169, 170 and 172 from the European Commission Joint Research Centre. The reference materials consist of two alpha-alumina powders and one quartz powder, with certified values 0.1, 1.05, 2.56 m2/gram, respectively. The results show the SA-9600 can measure low specific surface area, with great agreement with certified values.

Continue reading

Metal Powder Application Note

Metal Powder Properties: A Case with Low Specific Surface Area Horiba SA-9600 BET surface area analysis

Industrial
Applications
Metal Powders SA-9600

Metal Powder Properties: A Case with Low Specific Surface Area

Powder metallurgy is the study of transforming metal into powder and the consolidation of powder into the desired final product through methods such as sintering, compaction, blending, injection molding, or extrusion. Powder metallurgy is the essence of 3D additive manufacturing and it covers a broad spectrum of traditional applications including orthopedic implants, dental restorations, or paint pigments. The success of any powder metallurgical process, however, depends heavily on the understanding and control of the metal powder characteristics.

Continue reading

Food Packaging Application Note

Optimizing Food Packaging Size by Measuring the Tapped Density

Industrial
Applications
Food Packaging BeDensi T Pro

Optimizing Food Packaging Size by Measuring the Tapped Density

A reasonable packaging size in the food industry is important not only to ensure the success of the packaging process, but also to decrease the cost of transporting products. This application note explores how the size of the food powder container is determined by measuring the bulk density and tapped density. In this research, three types of protein powders, including whey protein, soy protein and whey-soy protein mixture, were analyzed by an automatic tapped density tester – The BeDensi T1 Pro. The result demonstrates that the instrument relies entirely on providing food manufacturers with reliable information to determine the optimum packing size and choose a container that is satisfying to the customer.

Continue reading

Pharmaceutical Application Note

Research on particle size dispersion of domperidone

Industrial
Applications
Pharmaceuticals BeDensi T Pro

How to Perform a Standardised Tapped Density Test for Pharmaceutical Powders

Tapped density is a significant parameter to explore the compressibility and flowability of pharmaceutical powders, which is useful to promote the approach of QbD and GMPs. Standardization of apparatus and procedure is vital to get meaningful repeatable results. In this application note, standardized tapped density tests of three excipients were performed by the BeDensi T3 Pro with 3 workstations. It is worthy of note that this highly efficient and economic tester is designed to meet the USP and EP standards fully.

Continue reading

Resins Application Note

Analyse resins using BeNano

Industrial Applications
Resins BeNano Series

Using BeNano 90 Zeta to measure the particle size and zeta potential of multicolor UV-sensitive resins

Multicolor UV-sensitive resins are widely used in the fields of 3D printing, inks, and paintings. When the size of the added particles is down to the nanoscale, many properties of the resin, such as dispersibility, uniformity, curing properties, glossiness, and brightness, will be improved greatly. However, the nanoparticles in resin are not always dispersed at the nanoscale as expected. BeNano 90 Zeta is a powerful tool for measuring the nanoparticle size and zeta potential to help in investigating the actual size of particles dispersed in resin and the dispersing stability.

Continue reading

Pesticides Application Note

Particle characterisation of pesticides Meritics Bettersizer Laser diffraction

Industrial
Applications
Pesticides Bettersizer ST

Application of Laser Particle Size System in Pesticide Industry

The particle size distribution of pesticides directly affects the trajectory of particle movement, surface energy and adhesion. This application note shows that the laser analyzer can not only optimize the component content in the formulation development, but also effectively monitor the particle size distribution of the pesticide in the process production to ensure the stability of product performance.

Continue reading

Gypsum Application Note

Particle characterisation of Gypsum for agriculture and mining Meritics Bettersizer

Industrial
Applications
Gypsum Bettersizer ST

Measuring Particle Size Distribution of Gypsum Using Laser Diffraction

The performance of gypsum such as setting time, compressive strength or density deeply relies on its particle size distribution. Bettersizer ST, an analyzer for quality control, allows the measurement of particle size distribution of gypsum. In this note, two gypsum samples were rapidly and accurately measured with Bettersizer ST. Outstanding repeatability was presented subsequently by measurements of a ground sample, which indicates its excellent reliability.

Continue reading

Abrasives Application Note

Particle characterisation of Abrasives Meritics Betrtersizer laser diffraction

Industrial
Applications
Abrasives Bettersizer ST

Application of Laser Particle Size Analyzer in Quality Inspection of Silicon Carbide Abrasive Grains

The particle size distribution is one of the most important characteristics of abrasive grain products. In this application note, we will be looking at the particle size distribution of four batches of black silica carbide using a Bettersizer ST laser diffraction particle size analyzer. The stability of the production process can be evaluated by comparing the particle size distribution of abrasive grain products with each other. The particle size distribution of different abrasive grain products can be determined and be compared to ISO standards to determine if they are up to standard or not.

Continue reading

Ceramic Powders Application Note

Particle Characterisation of Ceramic Powders Meritics bettersizer Laser Diffraction

Industrial
Applications
Ceramic Powder Bettersizer ST

Analysis of Particle Size Distribution of Ceramic Powder Based on Laser Diffraction

During ceramic powder processing, the particle size distributions of powder, slurry and granule are different, which are necessary to be monitored. In this note, three forms of aluminium oxide, namely powder, slurry and granule were measured with the Bettersizer ST. And outstanding repeatability was demonstrated through the measurement of a granule sample.

Continue reading

Calcium Carbonate Powders Application Note

Particle characterisation for calcium carbonate

Industrial
Applications
Calcium Carbonate Bettersizer ST

Measuring Particle Size Distribution of Calcium Carbonate Powders with Laser Diffraction Method

Over a wide range of industries, different functions require different particle size distributions of ground calcium carbonate powders. That is the reason why particle sizing is a vital step for quality control of ground calcium carbonate. In this investigation, particle size distributions of three different ground calcium carbonates were measured by the laser diffraction method. Typical size values and size distribution curves were compared to evaluate the quality and stability of the sizing process of the three samples.

Continue reading

Mining and Minerals

Particle characterisation in the mining industry

Industry Information
Mining and Minerals

Why particle characterisation is important in the mining and minerals industry

Meritics Ltd’s particle characterisation solutions offer precise analysis for mining and minerals industries, aiding in optimal resource utilisation. By providing detailed particle size distribution and shape analysis, they enhance process efficiency, quality control, and product development. From ore characterisation to tailings management, Meritics empowers clients with invaluable insights for informed decision-making.

Particle size

Particle size analysis in mining optimises extraction processes, improves resource utilisation, ensures product quality, and enhances environmental management, facilitating sustainable and efficient operations.

Pore Analysis

Pore structure analysis in mineral analysis evaluates porosity, permeability, and surface area, crucial for understanding adsorption, chemical reactions, and storage capacity, aiding in resource assessment and processing optimisation.

Zeta potential measurements

Zeta potential analysis in mining assesses particle surface charge, vital for understanding aggregation, flocculation, and dispersion in mineral slurries, optimising processing efficiency, and improving product quality.

Particle shape analysis

Particle shape analysis aids in characterising minerals by evaluating morphology, angularity, and surface texture, crucial for understanding flow properties, handling, and processing behaviour in mining operations.

Case study

As the UK’s leading independent supplier of limestone-based products, we pride ourselves on delivering high-quality materials for various industries, including construction, agriculture, and manufacturing.

Ensuring the consistent quality of our limestone powder, granules, and aggregates is paramount. We faced challenges in maintaining the desired particle size distribution across our product range, which could impact performance and customer satisfaction.

To address these challenges, we implemented particle size analysis as a fundamental component of our quality control process. Investing in advanced particle size analysis equipment allowed us to accurately measure and monitor the particle size distribution of our limestone products.

Particle size analysis has become an invaluable tool in our quality control arsenal, enabling us to deliver superior limestone products that meet the stringent requirements of our diverse customer base. By maintaining optimal particle size distribution, we ensure the performance, reliability, and consistency of our materials across various applications.

Instruments to support the mining industry and analysis of minerals

Applications to support the mining industry and analysis of minerals

Continue reading

Pesticides Application Note

Particle characterisation of pesticides

Industrial
Applications
Pesticides Bettersizer ST

Inspect the Quality of Pesticides with Laser Diffraction Particle Size Analyzer

From the key active ingredients to the final pesticide product, particle size is known to have an important role in the residual period, the biological activity, and the stability properties of pesticides. For this reason, measuring the particle size distribution plays a vital role in determining the quality of pesticides during QC inspection. In this application note, particle size distributions of suspension concentrate samples were measured by the laser diffraction method. Typical size values and size distribution curves were compared to evaluate the quality of pesticide samples and to help to optimize the milling process and produce a pesticide that is fit for the specific application.

Continue reading

Agriculture

Particle characterisation for the agriculture industry

Industry Information
Agriculture

Why particle characterisation is important in the agriculture industry

Particle characterisation is significant in agriculture as it contributes to understanding and optimising various aspects related to soil, fertilisers, pesticides, and other agricultural inputs. The properties of particles in these materials play a crucial role in determining their effectiveness, impact on crops, and overall agricultural productivity.

Laser Diffraction in Pesticides

From the key active ingredients to the final pesticide product, particle size is known to play a critical role in the residual period, the biological activity, and the stability properties of pesticides.

Laser Diffraction analysis of soils

Laser diffraction analyses soil particle sizes swiftly and accurately, aiding in soil classification, fertility assessment, and understanding soil structure for optimal crop growth and environmental management in agriculture.

Case study

To continue to be the world leaders in Animal Health and Micro Nutrition products it is important to us to continually develop new and improved solutions. Our product is slow release, from between 12 hours to as much as 240 days. We rely on particle size analysis data to ensure our product is the optimum size for slow release. For this we turned to Meritics for their guidance. Now, with our Beckman Coulter LS13320XR we are able to test every batch as it is manufactured and our R&D team are now onboard using it to develop new products.

Instruments to support the agriculture

Applications to support agriculture

Continue reading

Lithium-ion Battery Application Note

Particle Characterisation of Lithium-ion batteries

Industrial
Applications
Lithium-ion Battery Bettersizer ST

Improving the Tapped Density of the Cathode Material to make a Lithium-ion Battery Hold More Energy

Tapped density is one of two important physical properties of electrode materials and affects the energy density of a Li-ion battery (LIB). The other important physical property is the particle size distribution which provides the appropriate information to optimize the grinding parameters during production. Improving the tapped density can also optimize the high- energy-density during LIB manufacture. Thus, it is necessary for the LIB producer to determine in advance, what is the most optimal and achievable tapped density and then using this parameter as the “gold standard” measure samples from the process during production until they match or come close to the “gold standard” measurement. The easy-to-use BeDensi T Pro series is an ideal tapped density tester because it is an economical device which delivers an exceptional performance with no compromises.

Continue reading

Chinese Medicine Powder Application Note

Industrial
Applications
Chinese Medicine Bettersizer 2600

Research on Particle Size Measurement of Chinese Medicine Powder by Laser Particle Size Analyser

The particle size and particle size distribution, which are related to the quality of the products and the safety of the drugs, are the important physical properties of the Chinese medicine powder. However, because of the irregularity and inhomogeneity of particle size, the results obtained by different measurement methods are different. Laser particle size measurement has been widely used in the determination of traditional Chinese medicine by its fast operation, wide measuring range, and good reproducibility. This paper focused on the principles and characteristics of laser particle size measurement and its application of Chinese medicine powder.

Continue reading

Domperidone API Application Note

Research on particle size dispersion of domperidone

Industrial
Applications
Domperidone Bettersizer 2600

Research on Particle Sizing Dispersion Methods of Domperidone API by Laser Particle Size Analyser

For particle size distribution measurement of Domperidone API, both wet and dry dispersion methods could provide high precision results. However, since Domperidone API is fragile, adequate data support is required for sample dispersion, especially for dry dispersion method.

In this application note, compared with dry dispersion, wet dispersion was observed to provide data with better repeatability, correlation, and rationality. Therefore, wet dispersion method is relatively reasonable to analyse particle size distribution of Domperidone API.

Continue reading

Lactose Application Note

Industrial
Applications
Lactose Bettersizer 2600

Research on Particle Size Measurement of Lactose by Laser Particle Size Analyser

Lactose is one of the most common kinds of tablet excipients. The USP has clear regulations on raw materials particle sizing by laser diffraction method, such as the structure and principle of the instrument, the specific method of dry and wet dispersions, the factors in the measurement process, etc. However, for specific lactose, there is no related instruction on how to choose the dispersive pressure and how to evaluate the results of dry and wet methods. This note carried out a systematic research on lactose particle size distribution measurement in accordance with the USP and the ISO 13320.

Continue reading

Coffee Application Note

Industrial
Applications
Coffee Bettersizer 2600

Application of Laser Particle Size Analyzer in Coffee

This note explores the effects of coffee grinding method, particle size and particle size distribution on coffee quality, and introduces the measuring methods and principles for optimizing coffee particle size and particle size distribution. The study results show that the laser particle size analyzer can effectively analyze and monitor the particle size and particle size distribution of the coffee in the grinding process, ensuring the homogeneity of the product and improving the quality of the coffee and also contributing to quality control in the development and production of coffee grinding equipment.

Continue reading

Cement Application Note

Industrial
Applications
Cement Bettersizer 2600

Rapid Laboratory Particle Size Analysis of Cements Using Laser Diffraction

The large power demands of finish milling mean that improved monitoring of the grinding efficiency and optimization of the classifier speed yields an in-specification product with significant energy efficiency improvements and ultimately cost savings. This is best achieved by having a laser diffraction which is quick and easy to use with consistent repeatable results being attained no matter which operator is using the system. In addition, by having control standard results for each cement grade maintained inside the computer database, all newly produced cement for all grades can be compared in seconds to the ideal products fineness parameters. The Bettersizer 2600 has all this functionality in its software and provides the rapid laboratory fineness analysis to prove the cement meets the specifications and is thus fit for purpose.

Continue reading

Milk Powder Application Note

Particle size analysis of Powdered Milk Meritics Ltd Bettersizer 2600

Industrial
Applications
Powdered Milk Bettersizer 2600

Particle Size Analysis of Milk Powder by Laser Diffraction

In the production and application process of milk powder, the particle size of milk powder directly affects its final taste, sensory properties and quality characteristics. The Bettersizer 2600 can be used by milk powder manufacturers or relevant equipment manufacturers to accurately monitor the size changes of milk powder during production, packaging, storage and application process, as well as to better understand the relationship between dairy product formulation and quality.

Continue reading

Pharmaceutical Application Note

Pharmaceutical Application Note Bettersizer 2600

Industrial
Applications
Pharmaceutical Bettersizer 2600

Particle Sizing with Dry Dispersion Can Be the Best Choice for Pharmaceutical Analysis

This paper looks at laser diffraction technology which when initially conceived only measured particle size by diluting a sample with a suitable diluent and pumped the mix through a sample measuring cell. It explains how the move away from using solvents encouraged the use of measuring sample dry rather than wet and explains what the barriers to dry measurement were and how they were overcome during a period of 25 years.

Pharmaceutical powders are generally considered to be some of the most cohesive a particle scientist will come across and generally are very demanding when using the wet method. In this paper we will demonstrate how a modern dry laser diffraction is able to analyse these cohesive samples and achieve reliable repeatable results with an eco-friendlier method.

Continue reading

Mineral Pigment Application Note

Particle size of mineral pigment and colour hiding power Meritics Ltd Bettersizer 2600

Industrial
Applications
Mineral Pigment Bettersizer 2600

Particle Size of Mineral Pigment and Colour Hiding Power

Particle size variation in mineral pigments leads to different hiding power and diverse chromatic gradation, attributed to the light scattering effect. The Bettersizer 2600 can provide meticulous measurement of granularity and support in finding the optimal balance between particle size and desired hiding power, ensuring consistency in pigment and coating products.

Continue reading

Lithium Battery Cathode Materials

Lithium battery cathode materials analysis by laser particle size analyser bettersizer 2600 meritics

Industrial
Applications
Battery Bettersizer 2600

Application of Laser Particle Size Analyser in Lithium Battery Cathode Materials

In order to achieve high energy storage, stability and safety performance, it is necessary to strictly control the particle size distributions of lithium battery cathode materials. Therefore, it is important for battery manufacturers to measure the particle size distribution of electrode materials quickly and easily, with the Bettersizer 2600 laser particle size analyser.

Continue reading

Ceramic Powders Application Note

Laser particle size analysis of ceramic powders

Industrial
Applications
Ceramic Powder Bettersizer 2600

Application of Laser Particle Size Analyser in Ceramic Powders

Accurate measurement of the particle size distribution of ceramic powders is extremely necessary in the production of modern ceramic components. It has been proved that the particle size and dispersibility of a ceramic powder can be determined by the Bettersizer 2600, and the test results have a high repeatability.

Continue reading

Chocolate Application Note

Analysis of chocolate by laser diffraction Bettersizer 2600 Meritics Ltd

Industrial
Applications
Chocolate Bettersizer 2600

Particle Size Analyzing of Chocolate by Laser Diffraction

The manufacturing process and final characteristics of chocolate are significantly affected by particle size in many ways. As less production costs and better chocolate quality are desirable, only with the help of high-performance laser diffraction instruments, manufacturers are able to control particle size distribution of intermediates as well as final products in chocolate production in a highly efficient way. In this note, the measurements of chocolates of different types (dark, milk, white) from various countries were successfully performed by the Bettersizer 2600, and the particle size changes were displayed.

Continue reading

Coffee Application Note

Coffee Extraction and Ground Coffee Size using laser diffraction anaysis Bettersizer 2600 Meritics Ltd

Industrial
Applications
Coffee Bettersizer 2600

Investigating the Relation Between Coffee Extraction and Ground Coffee Size

Particle size and size distributions of ground coffee significantly affect the extraction level and the flavor quality of brewed coffee. Monitoring the particle sizes and size distributions in ground coffees is necessary. In this note, different ground coffees were successfully characterized by the Bettersizer 2600, which is a sophisticated and reliable instrument that can provide particle sizing solutions to the coffee industries.

Continue reading

Pigments Application Note

Laser Particle Size Analysis in Pigments - Meritics UK - Bettersizer 2600

Industrial
Applications
Pigments Bettersizer 2600

Application of Laser Particle Size Analyser in Pigments

Coarse particles influence the color of pigments, and particle aggregation that occurred during storage reduces the stability of product performance. The Bettersizer 2600 enables the manufacturers to monitor the particle size and its distribution of pigments in the production and storage process. The instrument’s wide detection range and high resolution allow all pigments to be measured accurately, and ensure excellent batch-to-batch reproducibility.

Continue reading

Abrasives Application Note

Industrial
Applications
Differing Abrasives

Application of Image Particle Size & Shape Analysis System in Abrasive

This application note compares the particle size and particle shape distribution of different kinds of abrasive by laser scattering method and image method. The results show that the accuracy of particle size measurement results adopted by image method is better and coarser particle resolution is higher, which can effectively monitor the particle size, particle size distribution and ovality, circularity in the abrasive production process to ensure the uniformity of the product, thus improving the performance of the abrasive tool, therefore, the image method is one of the indispensable detection methods in the abrasive industry.

Continue reading

Have questions or need support?

1. Get in Touch

Tell us about your application and particle characterisation needs.

2. Have a conversation

We're happy to set up a call to discuss your application and answer your questions.

3. Discuss next steps

Expand your knowledge with a seminar, demonstration, sample analysis, or obtain a quote.

We are here in the UK to help and
answer any questions you might have.
Call us directly on +44 1582 704807

© 2024 Meritics.com